| Param | Original file | Final file |
|---|---|---|
| Filename | modeM0/AS1A11_024T01_9000005250_36941cztM0_level2.evt | modeM0/AS1A11_024T01_9000005250_36941cztM0_level2_quad_clean.evt |
| Size (bytes) | 439,007,040 | 79,467,840 |
| Size | 418.7 MB | 75.8 MB |
| Events in quadrant A | 2,768,642 | 528,763 |
| Events in quadrant B | 3,188,455 | 527,503 |
| Events in quadrant C | 2,892,509 | 508,499 |
| Events in quadrant D | 4,090,184 | 474,884 |
| Mode M9 | |||
|---|---|---|---|
| Quadrant | BADHDUFLAG | Total packets | Discarded packets |
| A | 0 | 32 | 0 |
| B | 0 | 32 | 0 |
| C | 0 | 32 | 0 |
| D | 0 | 33 | 0 |
| Mode SS | |||
|---|---|---|---|
| Quadrant | BADHDUFLAG | Total packets | Discarded packets |
| A | 0 | 108 | 0 |
| B | 0 | 108 | 0 |
| C | 0 | 108 | 0 |
| D | 0 | 108 | 0 |
| Mode M0 | |||
|---|---|---|---|
| Quadrant | BADHDUFLAG | Total packets | Discarded packets |
| A | 0 | 11408 | 3 |
| B | 0 | 12734 | 2 |
| C | 0 | 11624 | 2 |
| D | 0 | 15662 | 2 |
| Quadrant | Total seconds | Saturated seconds | Saturation percentage |
|---|---|---|---|
| A | 5231 | 20 | 0.382336% |
| B | 5231 | 95 | 1.816096% |
| C | 5231 | 89 | 1.701396% |
| D | 5231 | 364 | 6.958517% |
Noise dominated data is calculated using 1-second bins in cleaned event files. If a bin has >2000 counts, and if more than 50% of those come from <1% of pixels, then it is considered to be noise-dominated and hence unusable.
| Quadrant | # 1 sec bins | Bins with >0 counts | Bins with >2000 counts | High rate bins dominated by noise | Noise dominated (total time) | Noise dominated (detector-on time) | Marked lightcurve |
|---|---|---|---|---|---|---|---|
| A | 7293 | 5232 | 3 | 3 | 0.04% | 0.06% | 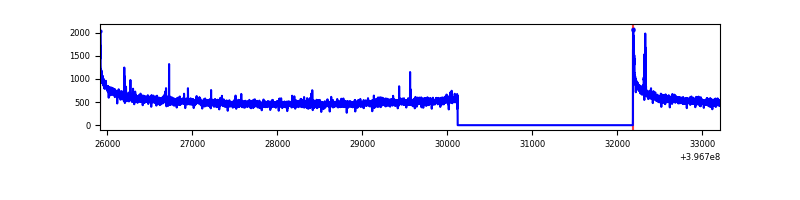 |
| B | 7293 | 5232 | 62 | 62 | 0.85% | 1.19% | 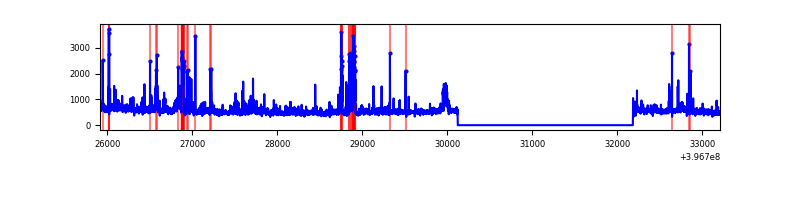 |
| C | 7293 | 5232 | 73 | 73 | 1.00% | 1.40% | 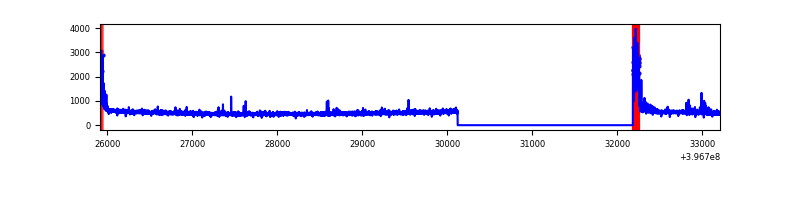 |
| D | 7293 | 5232 | 337 | 337 | 4.62% | 6.44% | 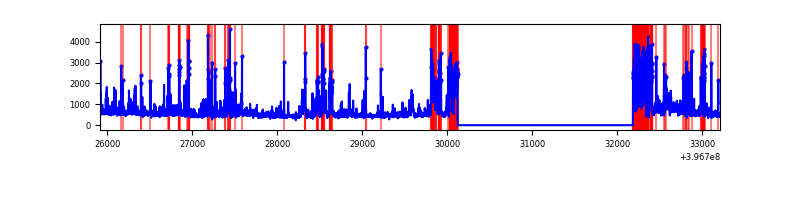 |
Top three noisy pixels from each quadrant. If the there are fewer than three noisy pixels in the level2.evt file, extra rows are filled as -1
| Pixel properties | Quadrant properties | ||||||
|---|---|---|---|---|---|---|---|
| Quadrant | DetID | PixID | Counts | Sigma | Mean | Median | Sigma |
| A | 10 | 83 | 244647 | 1889.17 | 642 | 634 | 129.2 |
| A | 13 | 254 | 12259 | 90.0 | 642 | 634 | 129.2 |
| A | 13 | 6 | 11113 | 81.13 | 642 | 634 | 129.2 |
| B | 5 | 172 | 165959 | 1375.83 | 633 | 619 | 120.2 |
| B | 4 | 81 | 126726 | 1049.37 | 633 | 619 | 120.2 |
| B | 0 | 219 | 68953 | 568.62 | 633 | 619 | 120.2 |
| C | 0 | 10 | 242593 | 1720.72 | 606 | 613 | 140.6 |
| C | 15 | 214 | 224432 | 1591.58 | 606 | 613 | 140.6 |
| C | 10 | 49 | 52412 | 368.34 | 606 | 613 | 140.6 |
| D | 12 | 17 | 552114 | 3771.24 | 594 | 578 | 146.2 |
| D | 12 | 233 | 456140 | 3115.0 | 594 | 578 | 146.2 |
| D | 1 | 52 | 172814 | 1177.7 | 594 | 578 | 146.2 |
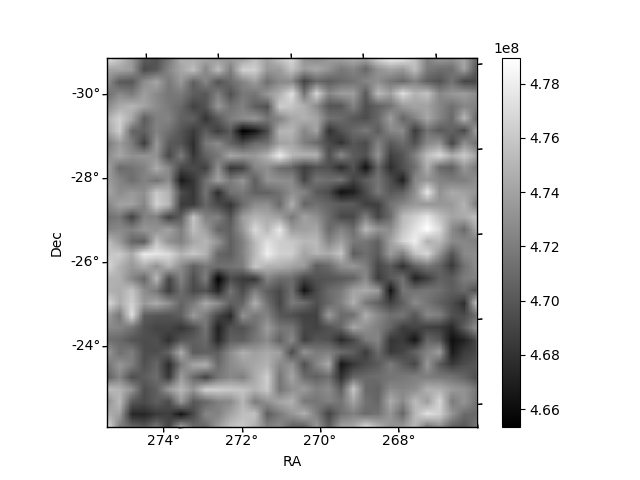
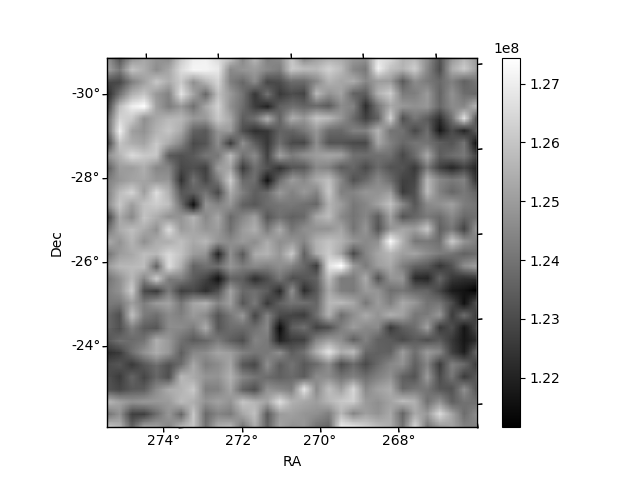
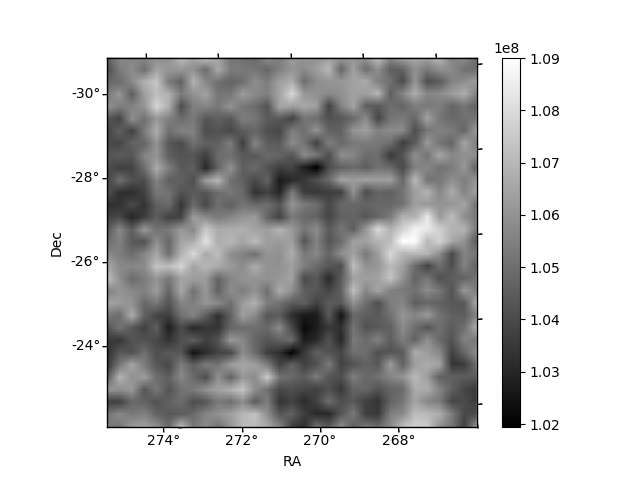
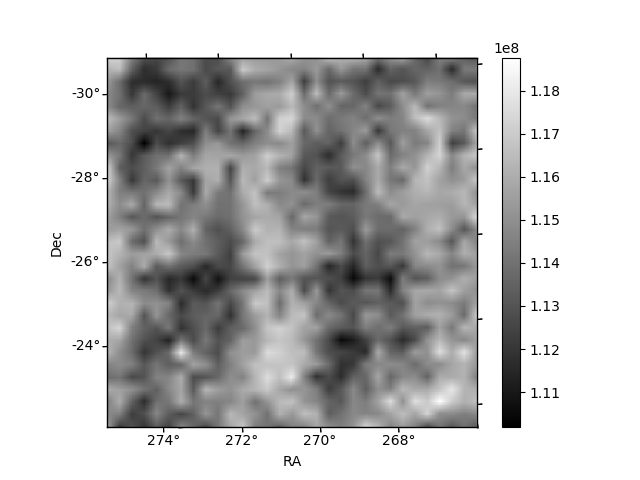
Histogram calculated using DETX and DETY for each event in the final _common_clean file
| Quadrant A | 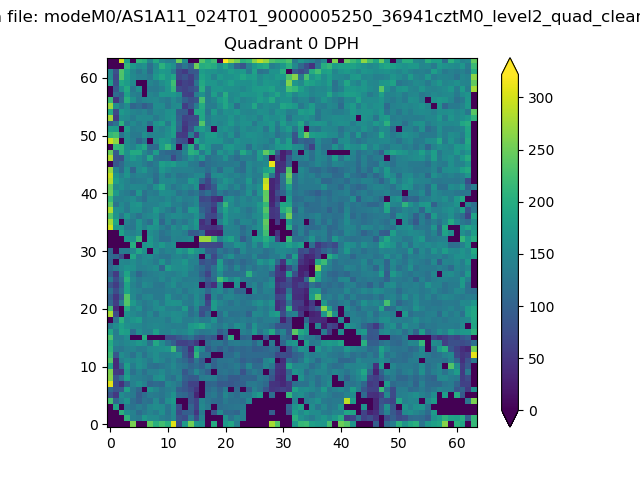 |
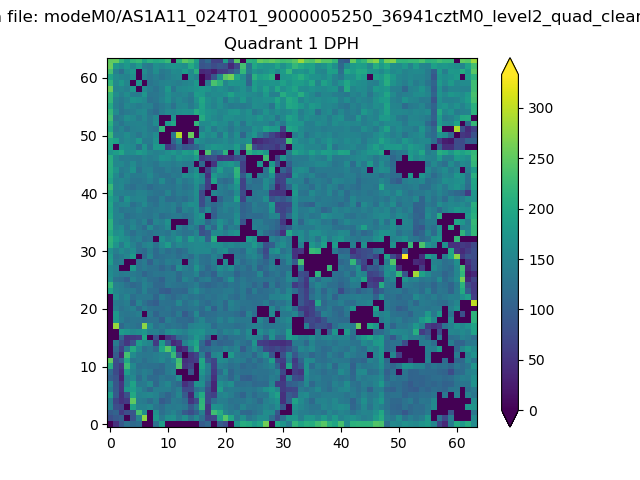 |
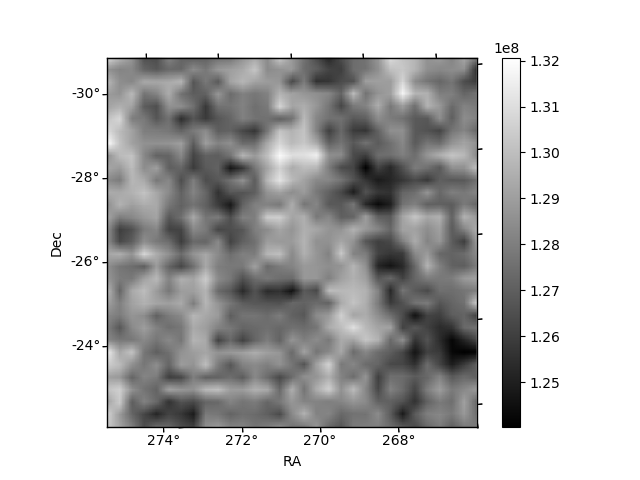
Quadrant B |
|---|---|---|---|
| Quadrant D | 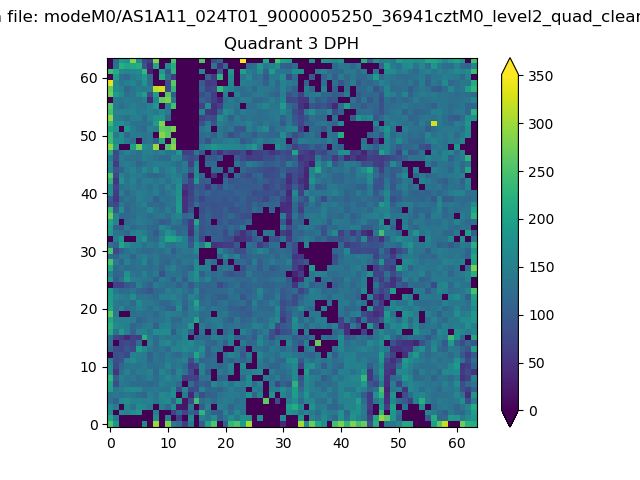 |
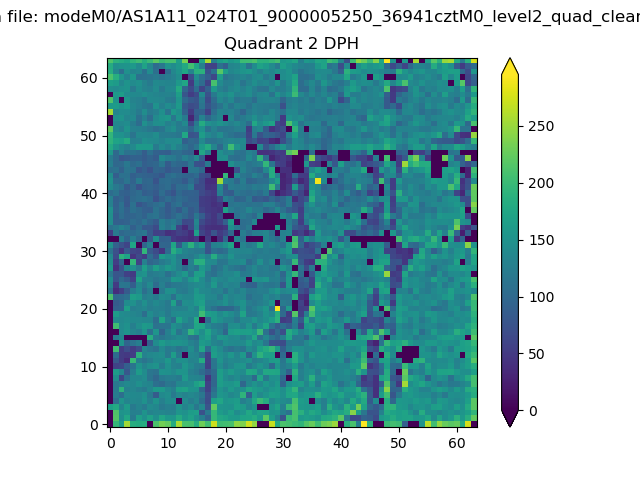 |
Quadrant C |
| Plot type | Count rate plots | Images |
|---|---|---|
| Comparison with Poisson distribution Blue bars denote a histogram of data divided into 1 sec bins. Red curve is a Poisson curve with rate = median count rate of data. |
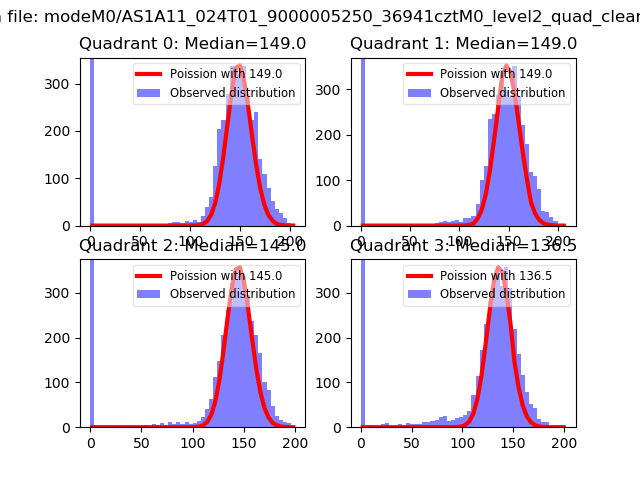 |
 |
| Quadrant-wise count rates Data is divided into 100 sec bins |
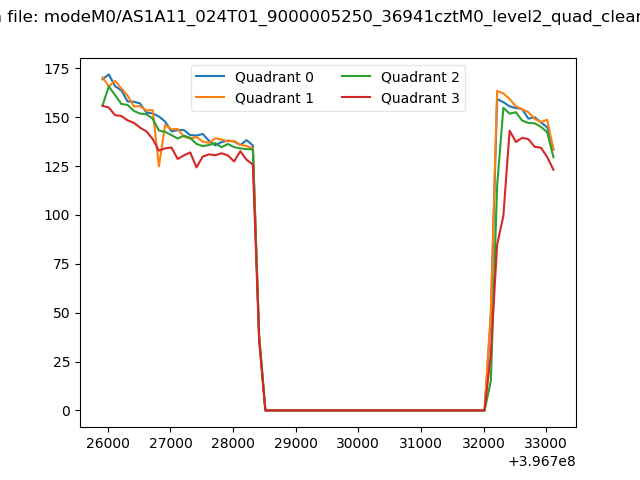 |
|
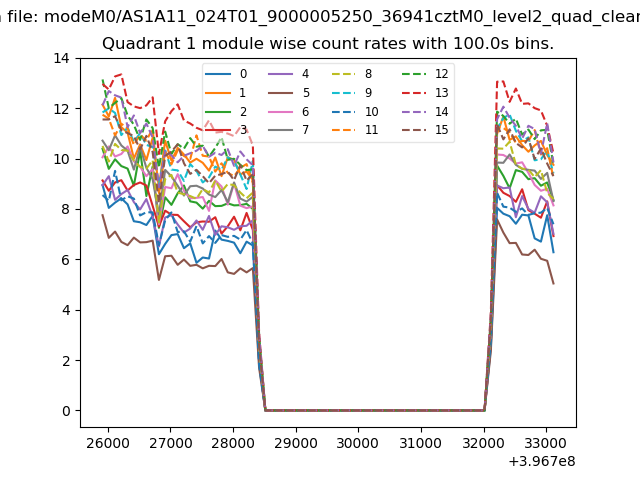
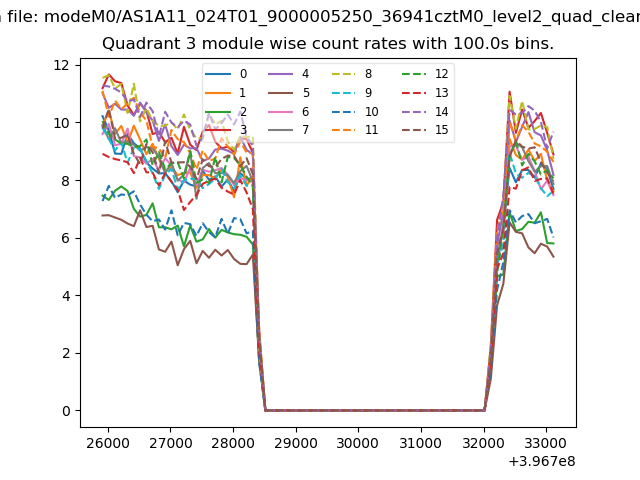
| Module-wise count rates for Quadrant A Data is divided into 100 sec bins |
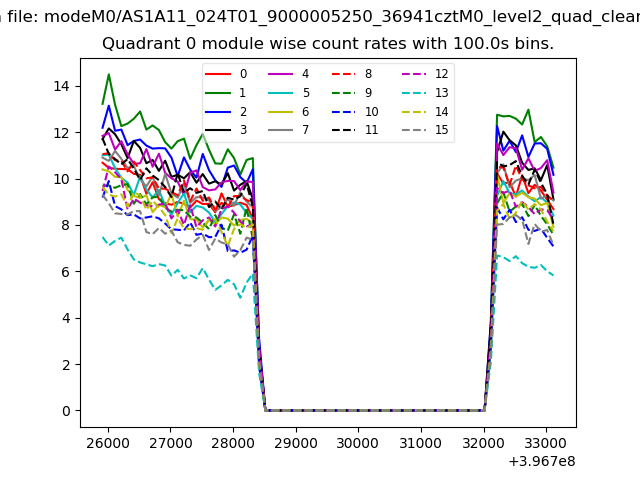 |
 |
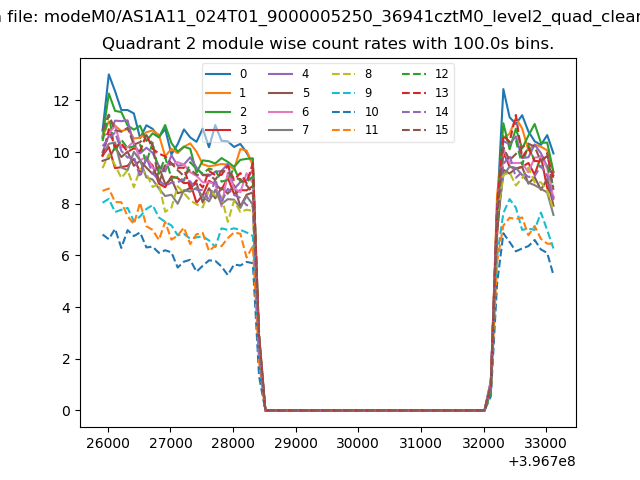
| Module-wise count rates for Quadrant B Data is divided into 100 sec bins |
 |
 |
| Module-wise count rates for Quadrant C Data is divided into 100 sec bins |
 |
 |
| Module-wise count rates for Quadrant D Data is divided into 100 sec bins |
 |
 |
| Parameter | Plot |
|---|---|
| CZT HV Monitor | 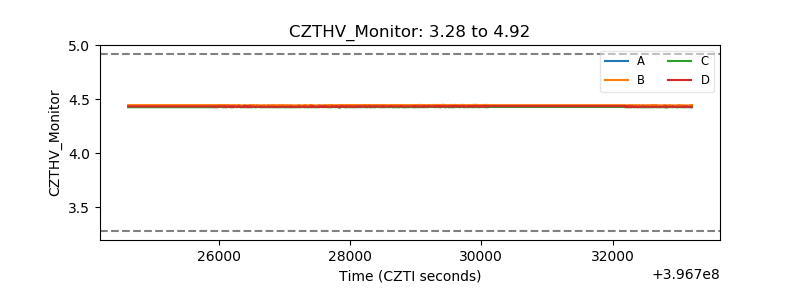 |
| D_VDD | 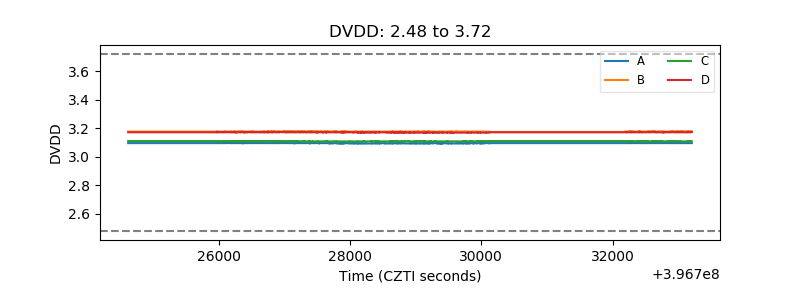 |
| Temperature 1 | 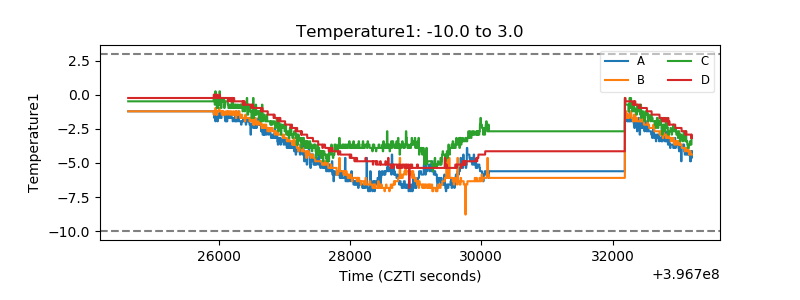 |
| Veto HV Monitor | 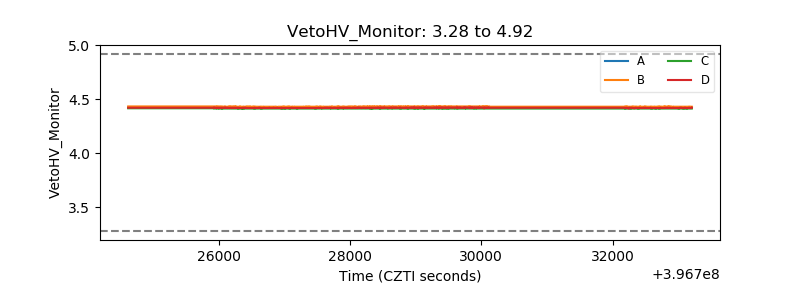 |
| Veto LLD | 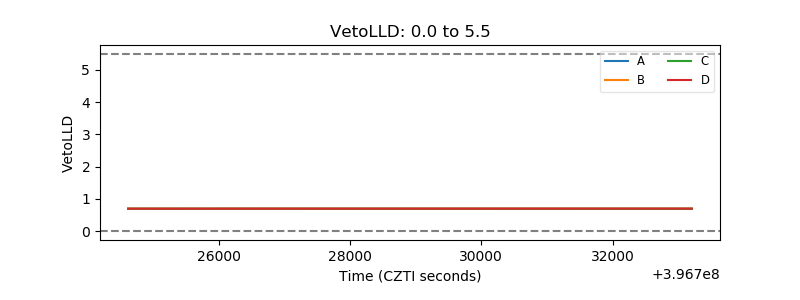 |
| Alpha Counter | 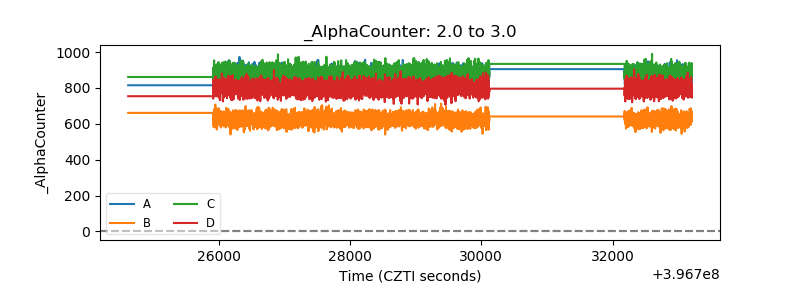 |
| _CPM_Rate | 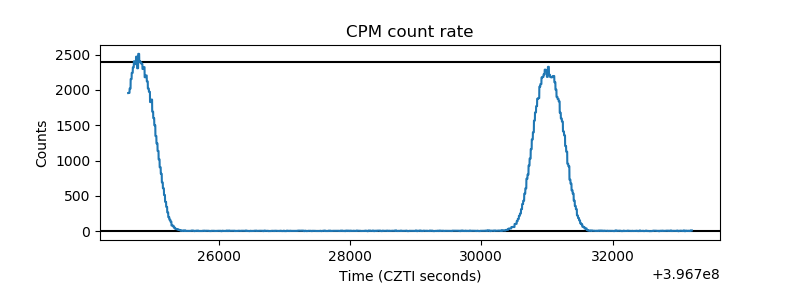 |
| CZT Counter | 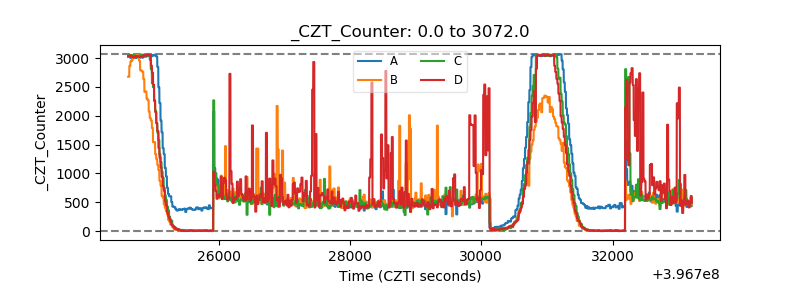 |
| +2.5 Volts monitor | 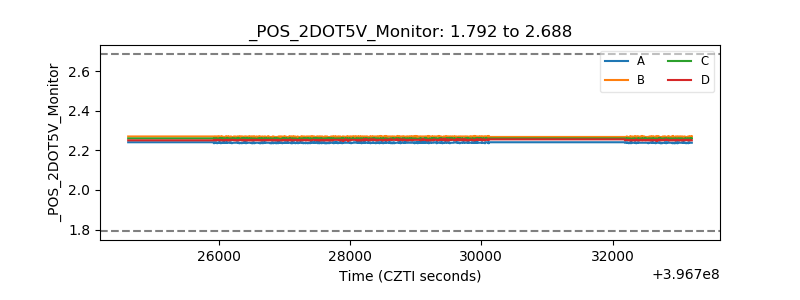 |
| +5 Volts monitor | 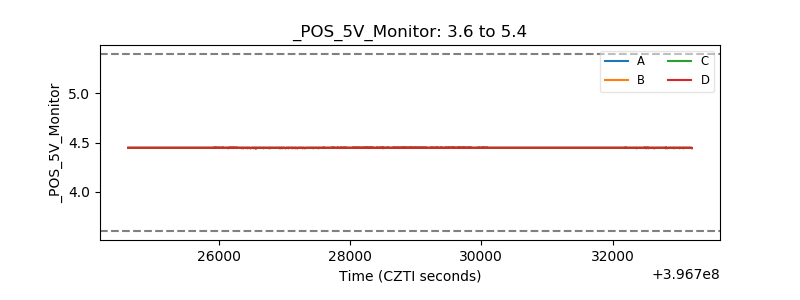 |
| _ROLL_ROT | 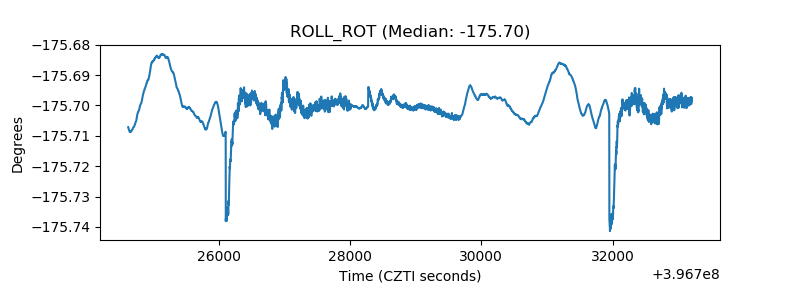 |
| _Roll_DEC | 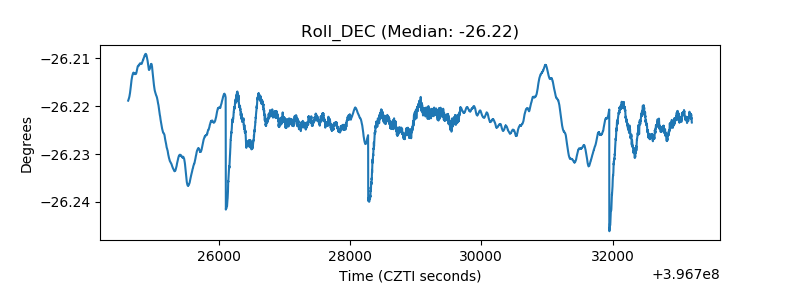 |
| _Roll_RA | 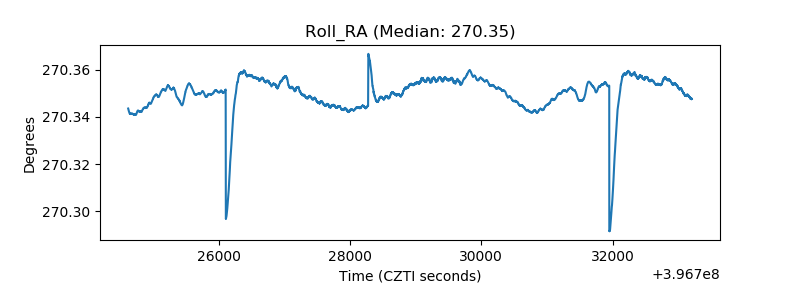 |
| Veto Counter | 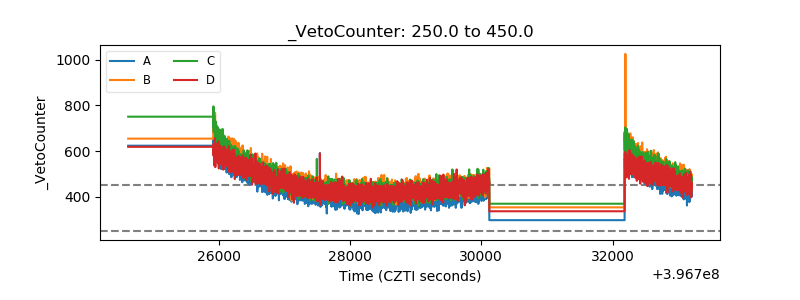 |