| Param | Original file | Final file |
|---|---|---|
| Filename | modeM0/AS1A11_024T01_9000005250_36943cztM0_level2.evt | modeM0/AS1A11_024T01_9000005250_36943cztM0_level2_quad_clean.evt |
| Size (bytes) | 417,378,240 | 57,193,920 |
| Size | 398.0 MB | 54.5 MB |
| Events in quadrant A | 2,389,823 | 356,272 |
| Events in quadrant B | 3,246,411 | 353,078 |
| Events in quadrant C | 2,562,319 | 354,801 |
| Events in quadrant D | 4,114,354 | 329,266 |
| Mode M9 | |||
|---|---|---|---|
| Quadrant | BADHDUFLAG | Total packets | Discarded packets |
| A | 0 | 36 | 0 |
| B | 0 | 36 | 0 |
| C | 0 | 36 | 0 |
| D | 0 | 37 | 0 |
| Mode SS | |||
|---|---|---|---|
| Quadrant | BADHDUFLAG | Total packets | Discarded packets |
| A | 0 | 96 | 0 |
| B | 0 | 96 | 0 |
| C | 0 | 96 | 0 |
| D | 0 | 96 | 0 |
| Mode M0 | |||
|---|---|---|---|
| Quadrant | BADHDUFLAG | Total packets | Discarded packets |
| A | 0 | 10182 | 3 |
| B | 0 | 12735 | 2 |
| C | 0 | 10510 | 2 |
| D | 0 | 15496 | 2 |
| Quadrant | Total seconds | Saturated seconds | Saturation percentage |
|---|---|---|---|
| A | 4826 | 9 | 0.186490% |
| B | 4826 | 200 | 4.144219% |
| C | 4826 | 64 | 1.326150% |
| D | 4826 | 463 | 9.593867% |
Noise dominated data is calculated using 1-second bins in cleaned event files. If a bin has >2000 counts, and if more than 50% of those come from <1% of pixels, then it is considered to be noise-dominated and hence unusable.
| Quadrant | # 1 sec bins | Bins with >0 counts | Bins with >2000 counts | High rate bins dominated by noise | Noise dominated (total time) | Noise dominated (detector-on time) | Marked lightcurve |
|---|---|---|---|---|---|---|---|
| A | 6949 | 4827 | 5 | 5 | 0.07% | 0.10% | 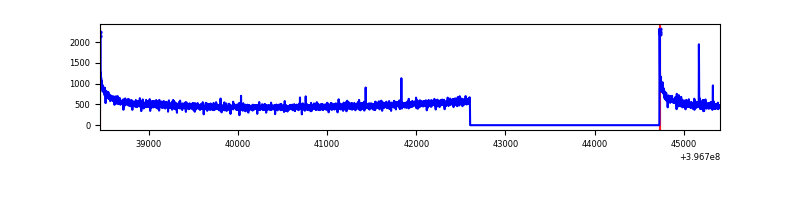 |
| B | 6949 | 4827 | 166 | 166 | 2.39% | 3.44% |  |
| C | 6949 | 4827 | 53 | 53 | 0.76% | 1.10% | 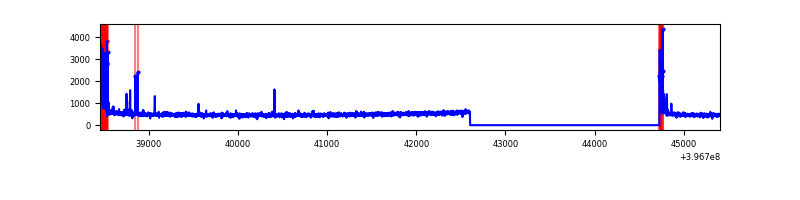 |
| D | 6949 | 4827 | 437 | 437 | 6.29% | 9.05% | 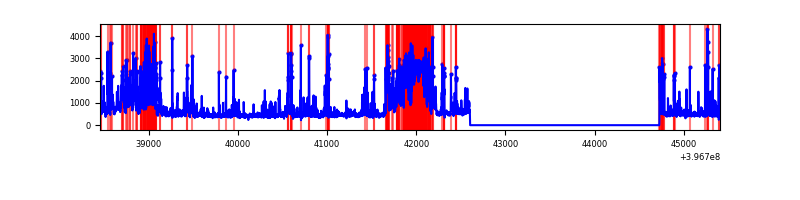 |
Top three noisy pixels from each quadrant. If the there are fewer than three noisy pixels in the level2.evt file, extra rows are filled as -1
| Pixel properties | Quadrant properties | ||||||
|---|---|---|---|---|---|---|---|
| Quadrant | DetID | PixID | Counts | Sigma | Mean | Median | Sigma |
| A | 10 | 83 | 222799 | 1981.41 | 555 | 545 | 112.2 |
| A | 13 | 254 | 8814 | 73.72 | 555 | 545 | 112.2 |
| A | 13 | 6 | 8171 | 67.99 | 555 | 545 | 112.2 |
| B | 0 | 229 | 264242 | 2513.0 | 548 | 536 | 104.9 |
| B | 5 | 172 | 206025 | 1958.22 | 548 | 536 | 104.9 |
| B | 5 | 184 | 137998 | 1309.95 | 548 | 536 | 104.9 |
| C | 0 | 10 | 242601 | 1917.5 | 538 | 543 | 126.2 |
| C | 15 | 214 | 207771 | 1641.59 | 538 | 543 | 126.2 |
| C | 10 | 49 | 10316 | 77.42 | 538 | 543 | 126.2 |
| D | 12 | 17 | 1064402 | 8446.73 | 512 | 498 | 126.0 |
| D | 10 | 253 | 436044 | 3457.96 | 512 | 498 | 126.0 |
| D | 13 | 171 | 120896 | 955.88 | 512 | 498 | 126.0 |
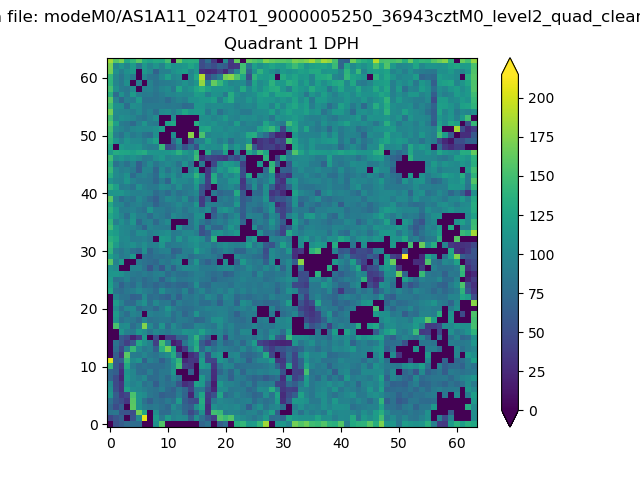
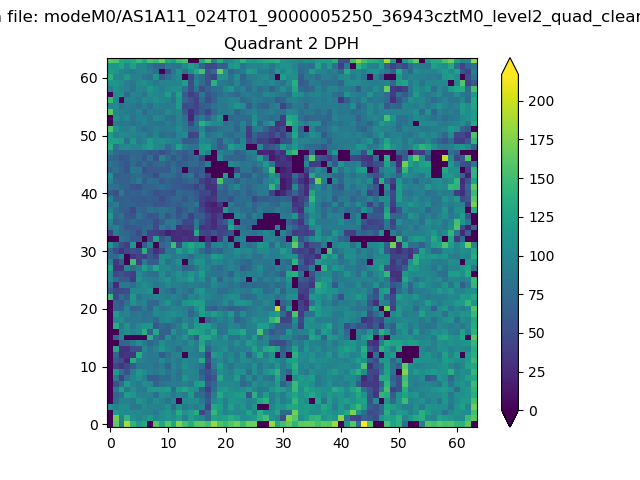
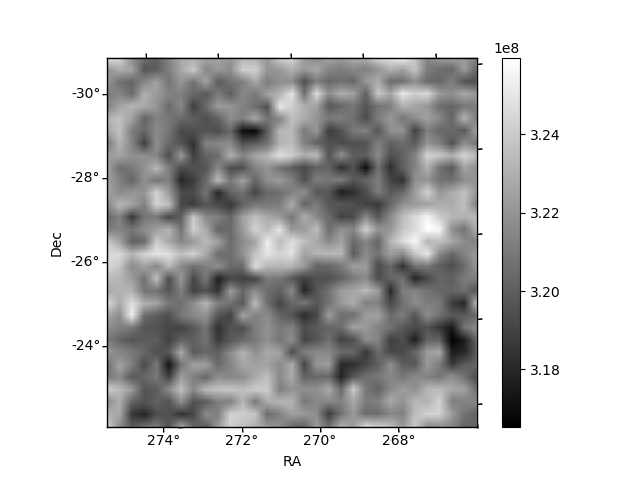
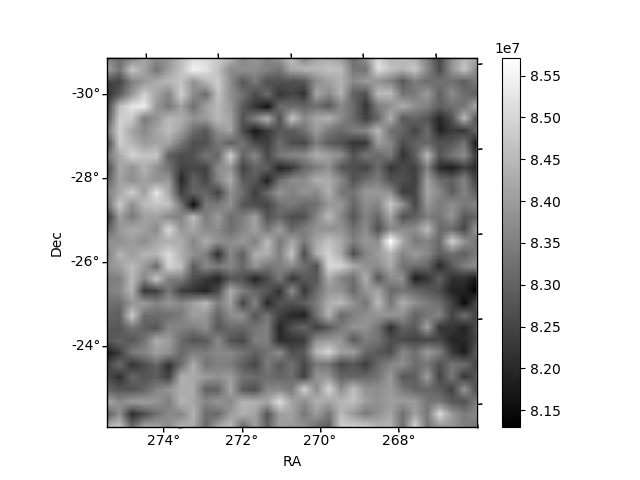
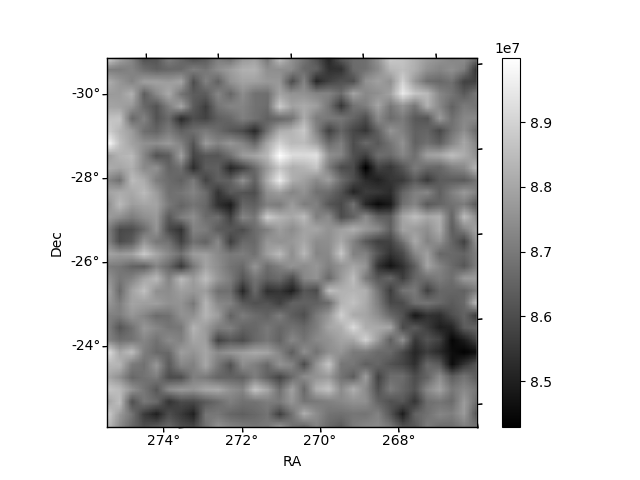
Histogram calculated using DETX and DETY for each event in the final _common_clean file
| Quadrant A | 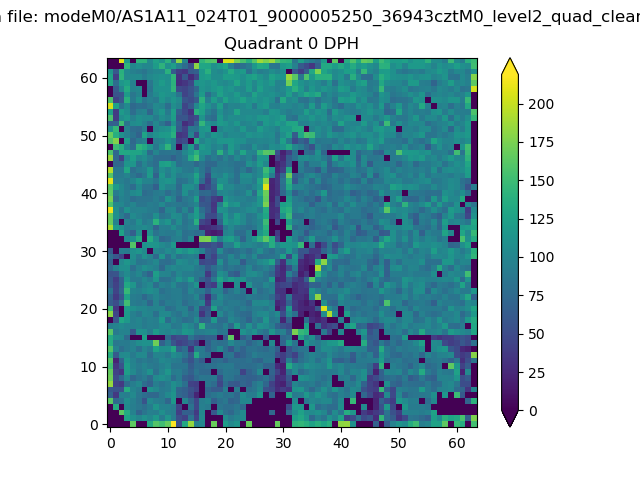 |
 |
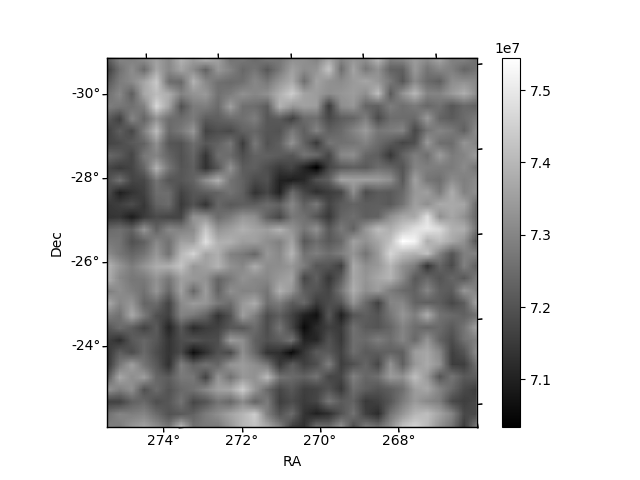
Quadrant B |
|---|---|---|---|
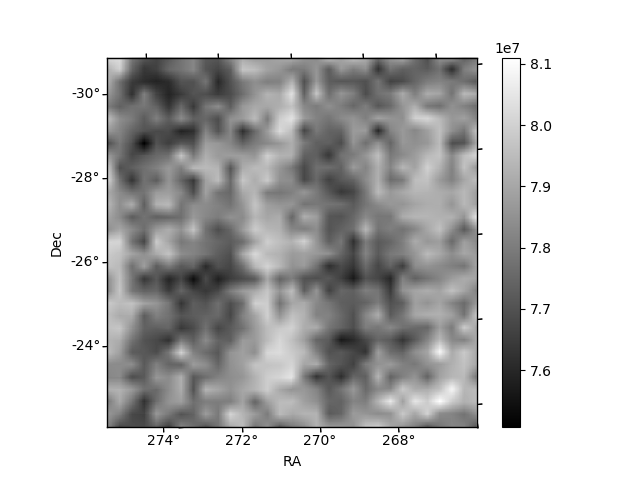
| Quadrant D | 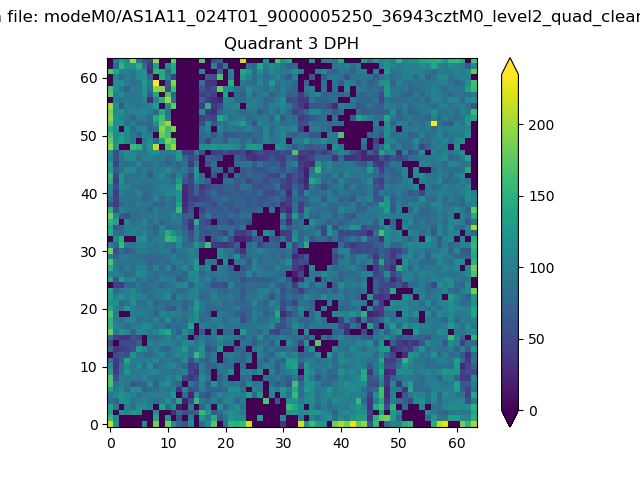 |
 |
Quadrant C |
| Plot type | Count rate plots | Images |
|---|---|---|
| Comparison with Poisson distribution Blue bars denote a histogram of data divided into 1 sec bins. Red curve is a Poisson curve with rate = median count rate of data. |
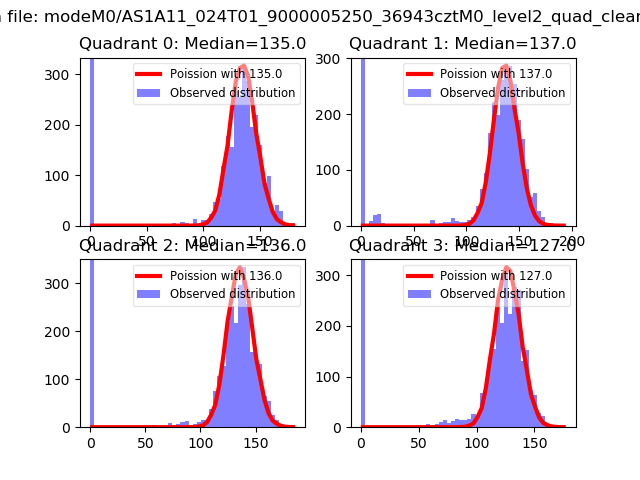 |
 |
| Quadrant-wise count rates Data is divided into 100 sec bins |
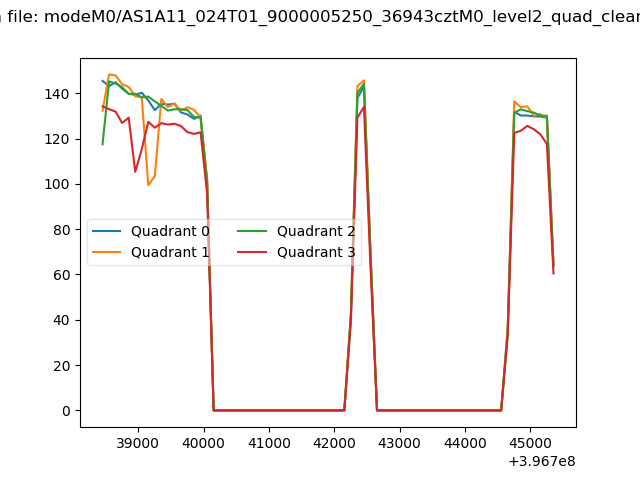 |
|
| Module-wise count rates for Quadrant A Data is divided into 100 sec bins |
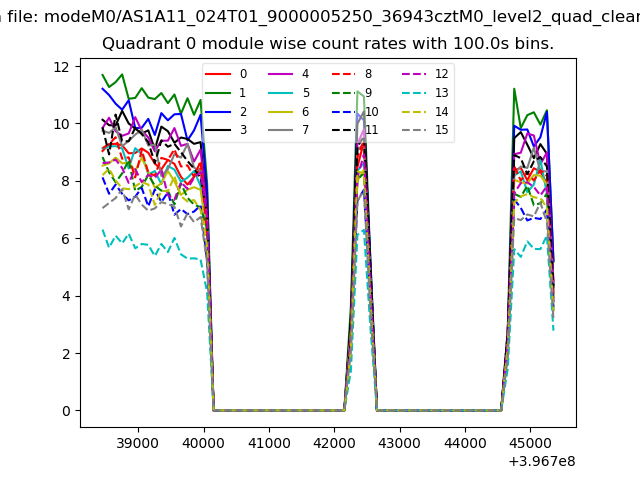 |
 |
| Module-wise count rates for Quadrant B Data is divided into 100 sec bins |
 |
 |
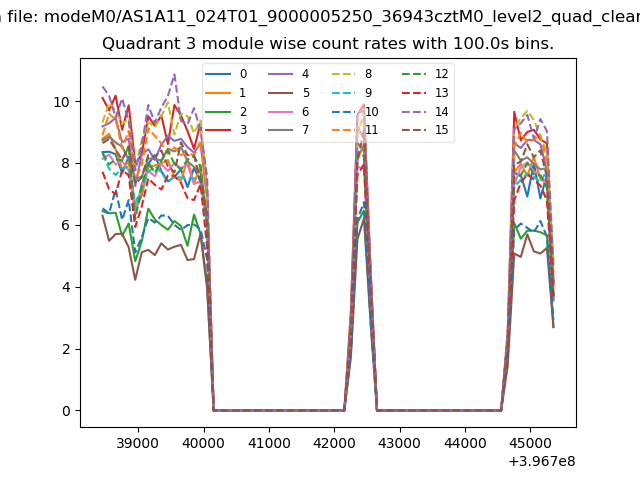
| Module-wise count rates for Quadrant C Data is divided into 100 sec bins |
 |
 |
| Module-wise count rates for Quadrant D Data is divided into 100 sec bins |
 |
 |
| Parameter | Plot |
|---|---|
| CZT HV Monitor | 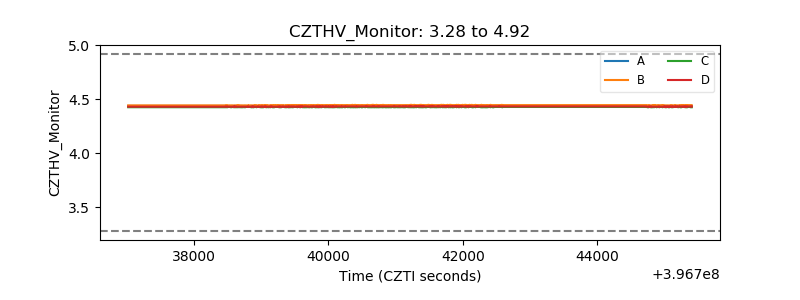 |
| D_VDD | 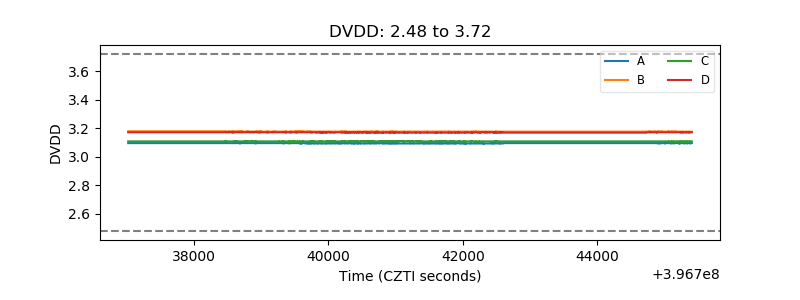 |
| Temperature 1 | 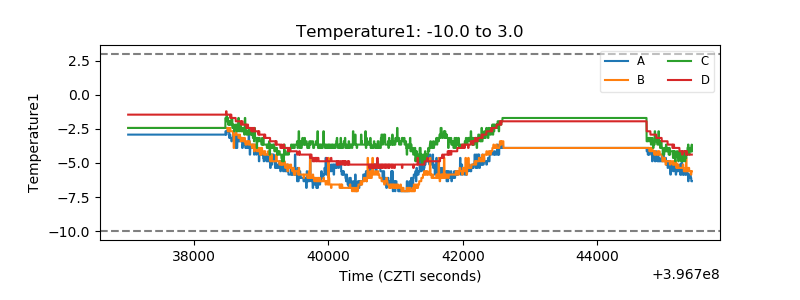 |
| Veto HV Monitor | 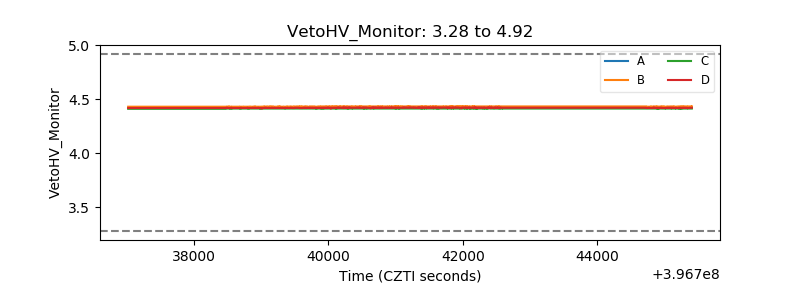 |
| Veto LLD | 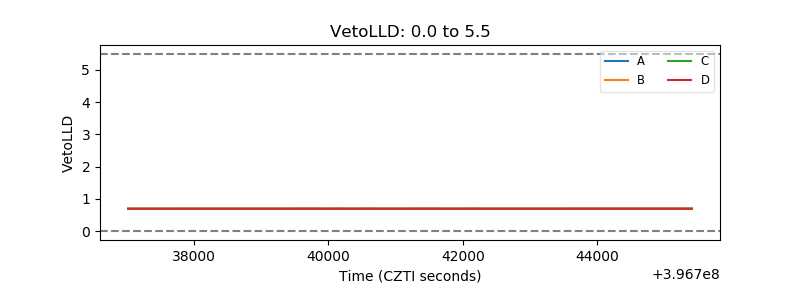 |
| Alpha Counter | 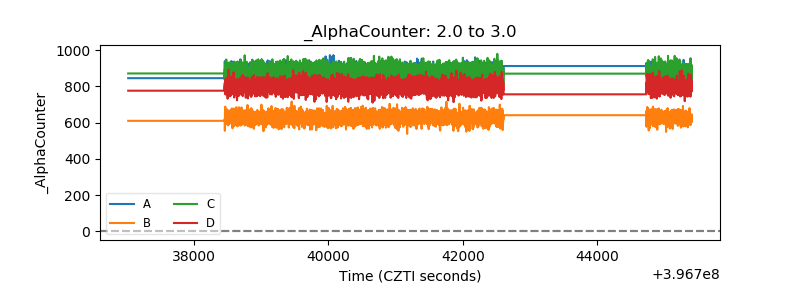 |
| _CPM_Rate | 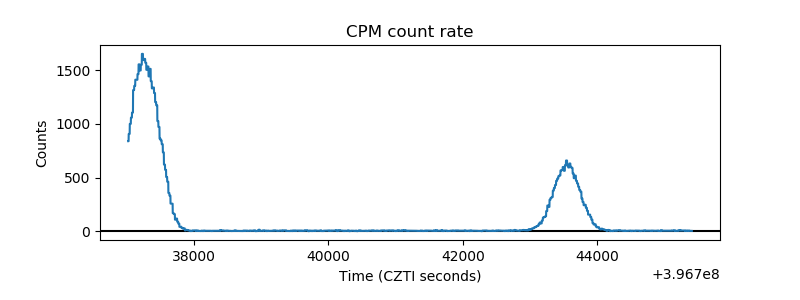 |
| CZT Counter | 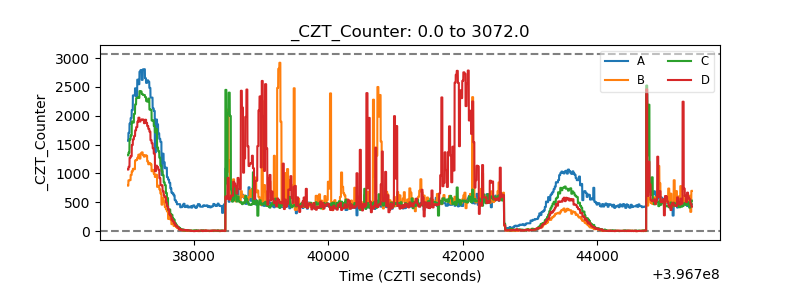 |
| +2.5 Volts monitor | 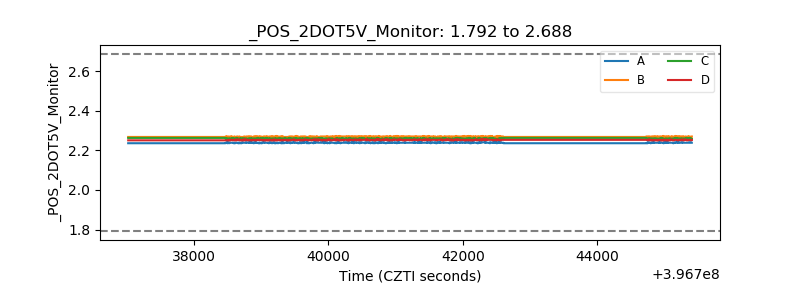 |
| +5 Volts monitor | 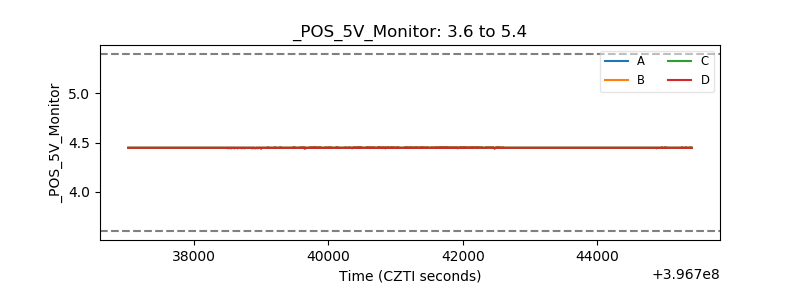 |
| _ROLL_ROT | 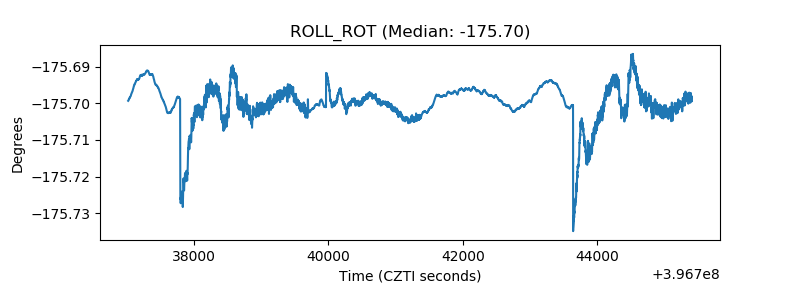 |
| _Roll_DEC | 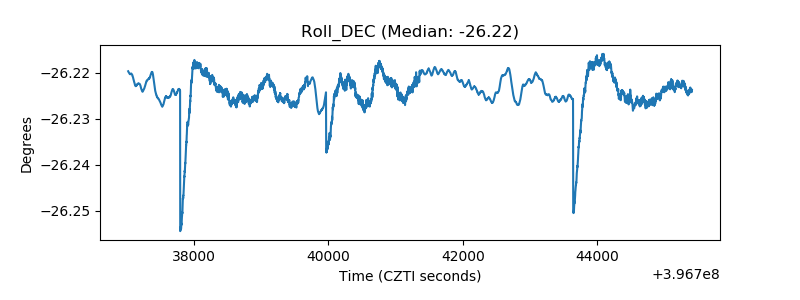 |
| _Roll_RA | 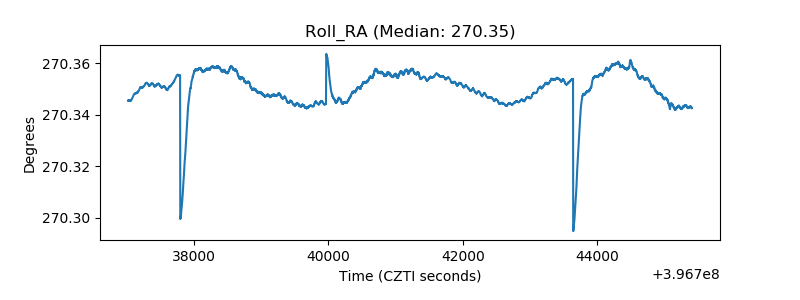 |
| Veto Counter | 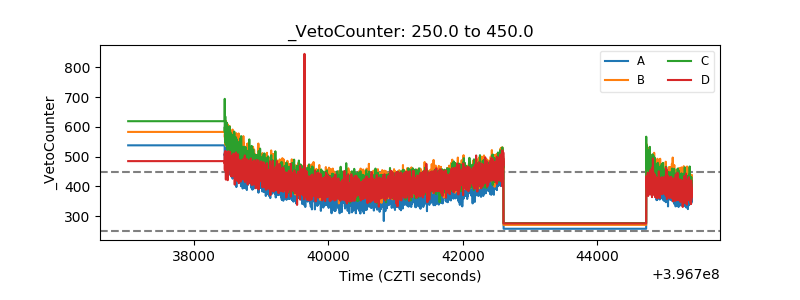 |