| Param | Original file | Final file |
|---|---|---|
| Filename | modeM0/AS1A11_024T01_9000005250_36945cztM0_level2.evt | modeM0/AS1A11_024T01_9000005250_36945cztM0_level2_quad_clean.evt |
| Size (bytes) | 1,027,653,120 | 123,572,160 |
| Size | 980.0 MB | 117.8 MB |
| Events in quadrant A | 6,150,703 | 721,913 |
| Events in quadrant B | 7,853,189 | 727,533 |
| Events in quadrant C | 6,863,385 | 722,934 |
| Events in quadrant D | 9,389,480 | 683,581 |
| Mode M9 | |||
|---|---|---|---|
| Quadrant | BADHDUFLAG | Total packets | Discarded packets |
| A | 0 | 57 | 0 |
| B | 0 | 57 | 0 |
| C | 0 | 57 | 0 |
| D | 0 | 57 | 0 |
| Mode SS | |||
|---|---|---|---|
| Quadrant | BADHDUFLAG | Total packets | Discarded packets |
| A | 0 | 264 | 0 |
| B | 0 | 264 | 0 |
| C | 0 | 264 | 0 |
| D | 0 | 264 | 0 |
| Mode M0 | |||
|---|---|---|---|
| Quadrant | BADHDUFLAG | Total packets | Discarded packets |
| A | 0 | 26593 | 4 |
| B | 0 | 31823 | 5 |
| C | 0 | 28207 | 3 |
| D | 0 | 36796 | 3 |
| Quadrant | Total seconds | Saturated seconds | Saturation percentage |
|---|---|---|---|
| A | 12813 | 29 | 0.226333% |
| B | 12812 | 256 | 1.998127% |
| C | 12813 | 153 | 1.194100% |
| D | 12813 | 848 | 6.618278% |
Noise dominated data is calculated using 1-second bins in cleaned event files. If a bin has >2000 counts, and if more than 50% of those come from <1% of pixels, then it is considered to be noise-dominated and hence unusable.
| Quadrant | # 1 sec bins | Bins with >0 counts | Bins with >2000 counts | High rate bins dominated by noise | Noise dominated (total time) | Noise dominated (detector-on time) | Marked lightcurve |
|---|---|---|---|---|---|---|---|
| A | 18551 | 12816 | 17 | 17 | 0.09% | 0.13% | 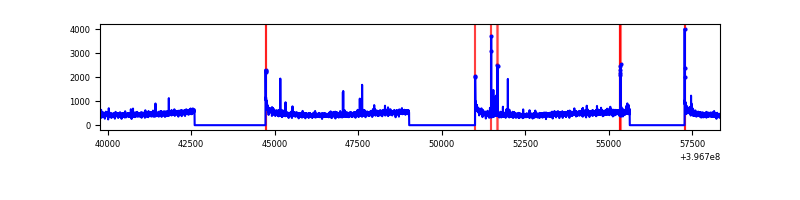 |
| B | 18551 | 12816 | 179 | 179 | 0.96% | 1.40% | 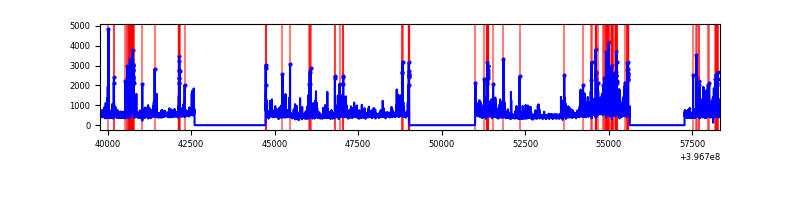 |
| C | 18551 | 12816 | 128 | 128 | 0.69% | 1.00% | 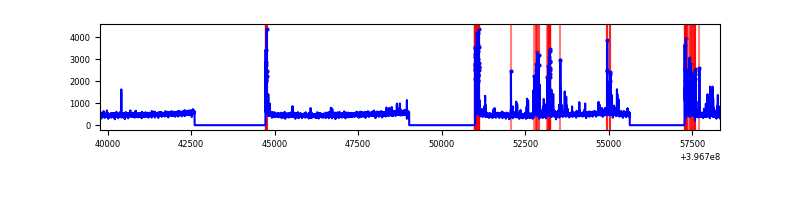 |
| D | 18551 | 12816 | 770 | 770 | 4.15% | 6.01% | 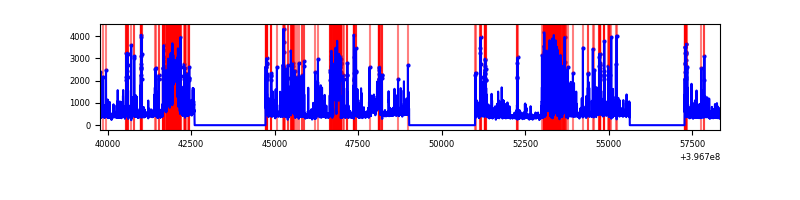 |
Top three noisy pixels from each quadrant. If the there are fewer than three noisy pixels in the level2.evt file, extra rows are filled as -1
| Pixel properties | Quadrant properties | ||||||
|---|---|---|---|---|---|---|---|
| Quadrant | DetID | PixID | Counts | Sigma | Mean | Median | Sigma |
| A | 10 | 83 | 441223 | 1510.68 | 1449 | 1424 | 291.1 |
| A | 15 | 237 | 39818 | 131.88 | 1449 | 1424 | 291.1 |
| A | 15 | 174 | 22582 | 72.68 | 1449 | 1424 | 291.1 |
| B | 5 | 184 | 743932 | 2711.98 | 1440 | 1403 | 273.8 |
| B | 5 | 172 | 400522 | 1457.72 | 1440 | 1403 | 273.8 |
| B | 0 | 213 | 321172 | 1167.91 | 1440 | 1403 | 273.8 |
| C | 15 | 214 | 532416 | 1611.45 | 1413 | 1422 | 329.5 |
| C | 14 | 254 | 404546 | 1223.39 | 1413 | 1422 | 329.5 |
| C | 0 | 10 | 376392 | 1137.95 | 1413 | 1422 | 329.5 |
| D | 12 | 17 | 1434815 | 4326.95 | 1369 | 1334 | 331.3 |
| D | 2 | 250 | 1100323 | 3317.29 | 1369 | 1334 | 331.3 |
| D | 2 | 153 | 483092 | 1454.18 | 1369 | 1334 | 331.3 |
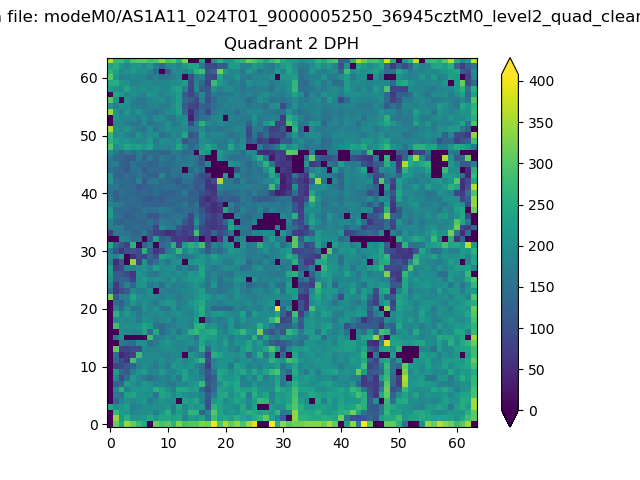
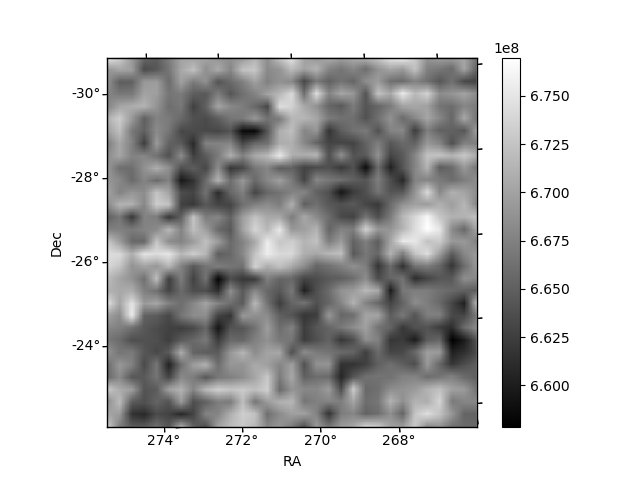
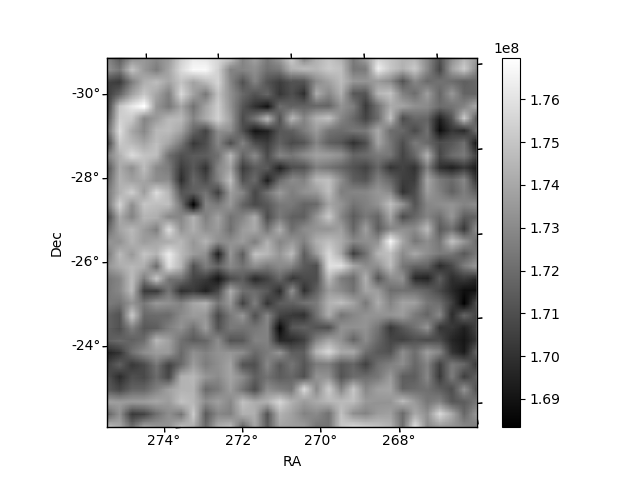
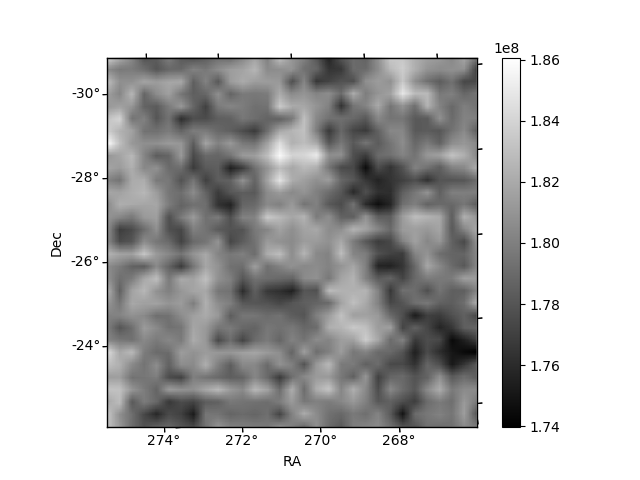
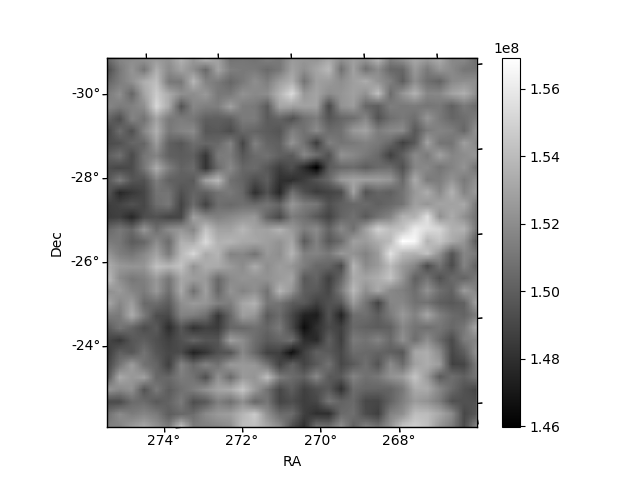
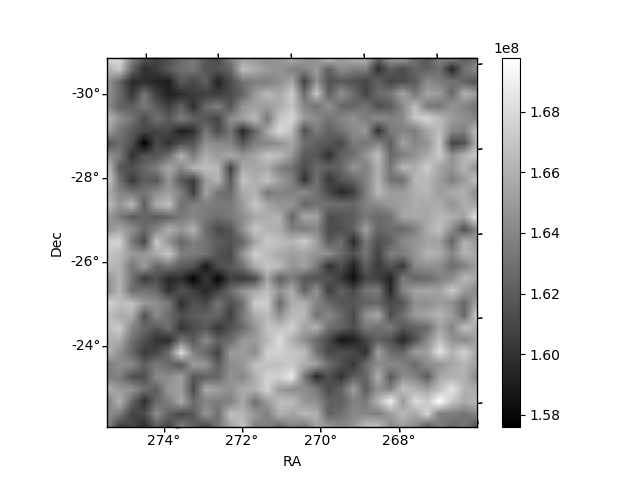
Histogram calculated using DETX and DETY for each event in the final _common_clean file
| Quadrant A | 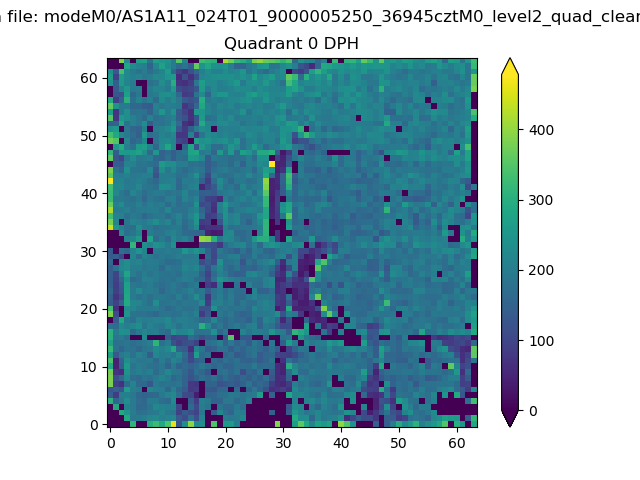 |
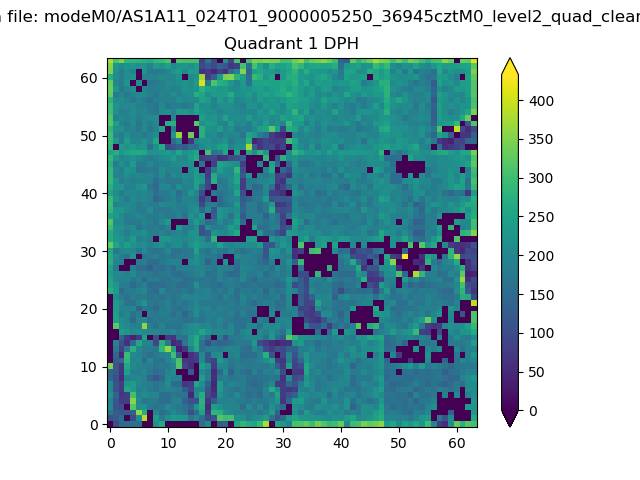 |
Quadrant B |
|---|---|---|---|
| Quadrant D | 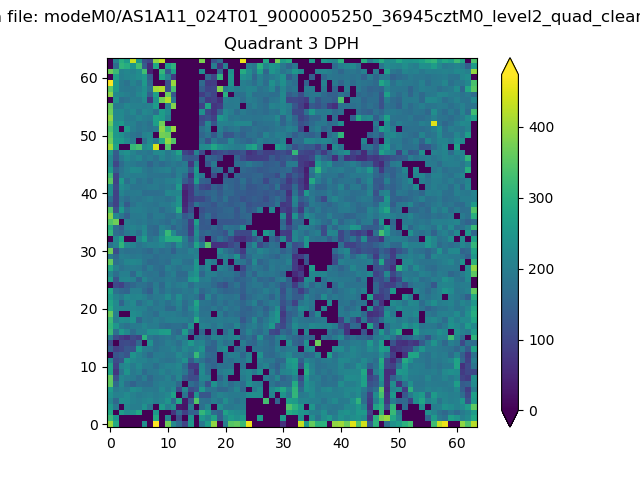 |
 |
Quadrant C |
| Plot type | Count rate plots | Images |
|---|---|---|
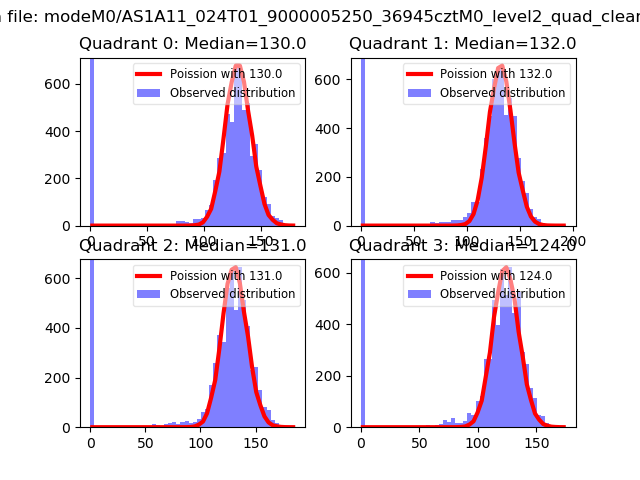
| Comparison with Poisson distribution Blue bars denote a histogram of data divided into 1 sec bins. Red curve is a Poisson curve with rate = median count rate of data. |
 |
 |
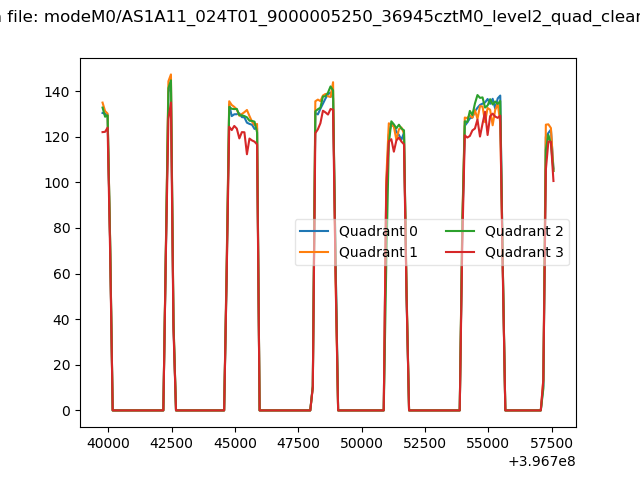
| Quadrant-wise count rates Data is divided into 100 sec bins |
 |
|
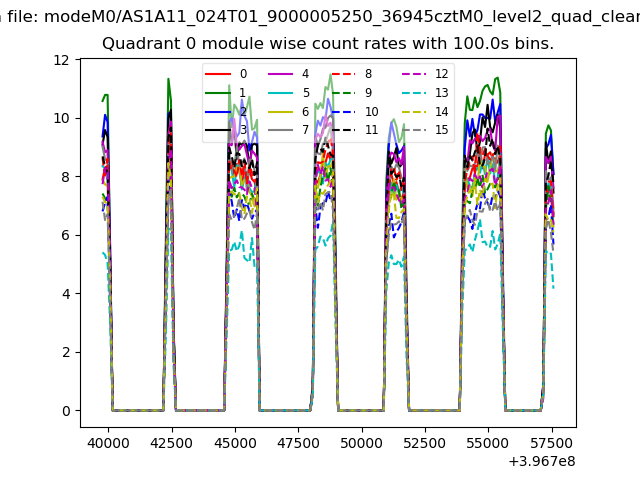
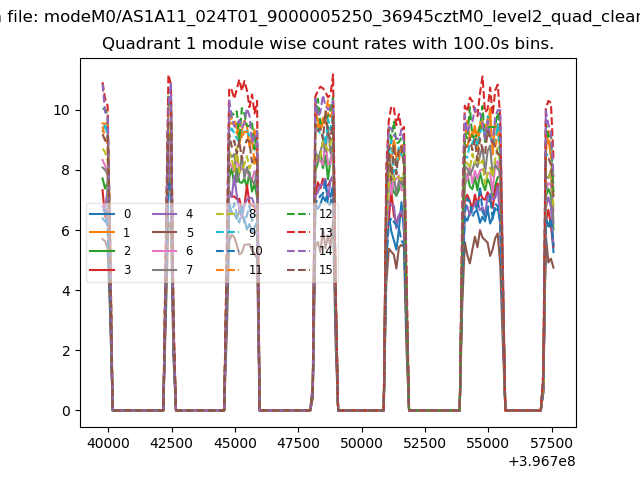
| Module-wise count rates for Quadrant A Data is divided into 100 sec bins |
 |
 |
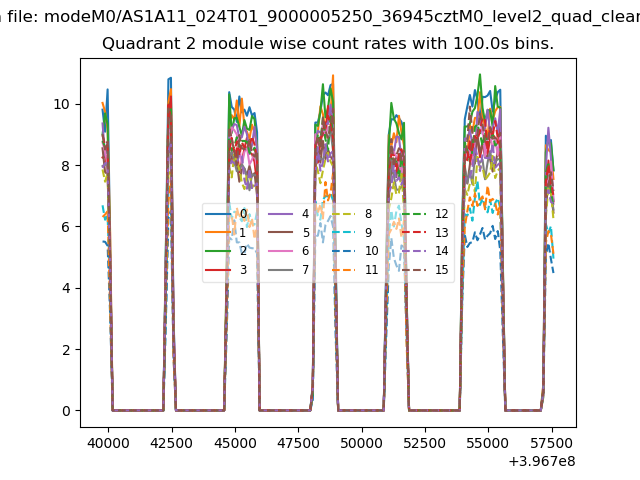
| Module-wise count rates for Quadrant B Data is divided into 100 sec bins |
 |
 |
| Module-wise count rates for Quadrant C Data is divided into 100 sec bins |
 |
 |
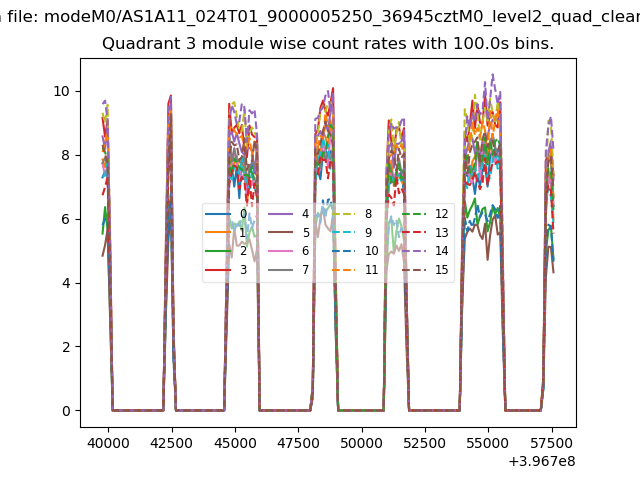
| Module-wise count rates for Quadrant D Data is divided into 100 sec bins |
 |
 |
| Parameter | Plot |
|---|---|
| CZT HV Monitor |  |
| D_VDD | 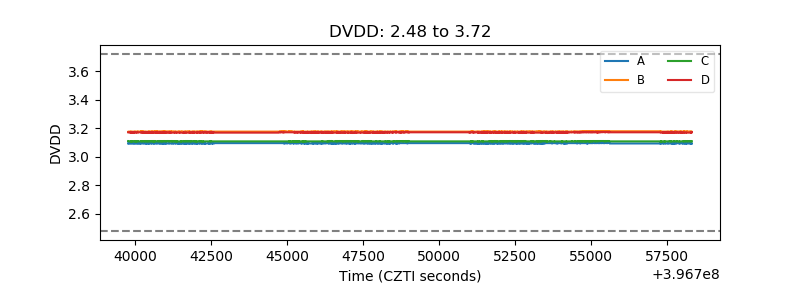 |
| Temperature 1 | 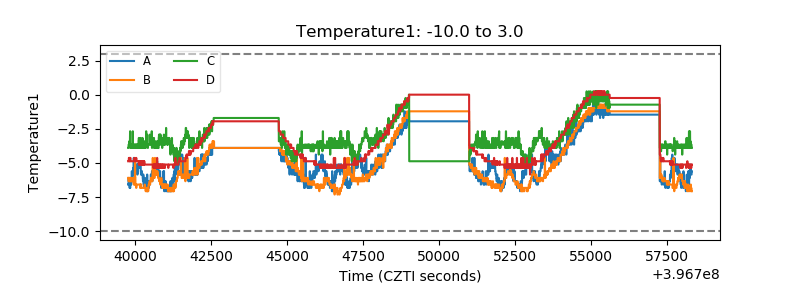 |
| Veto HV Monitor | 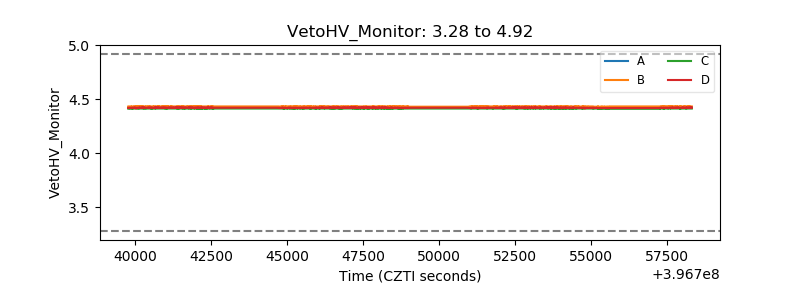 |
| Veto LLD | 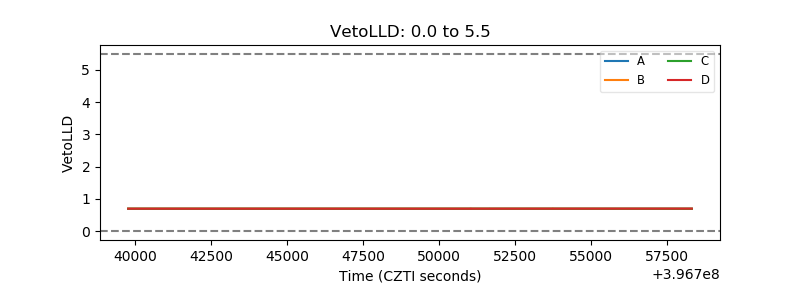 |
| Alpha Counter | 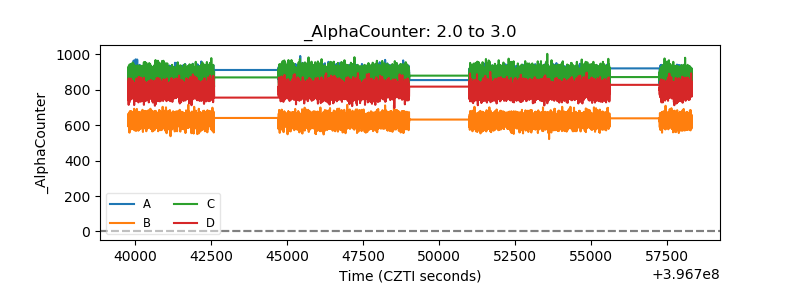 |
| _CPM_Rate | 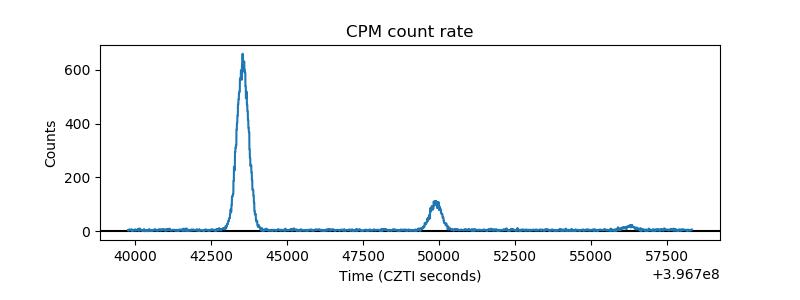 |
| CZT Counter | 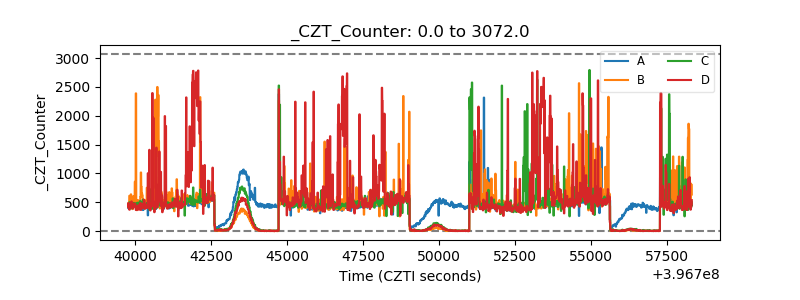 |
| +2.5 Volts monitor |  |
| +5 Volts monitor |  |
| _ROLL_ROT | 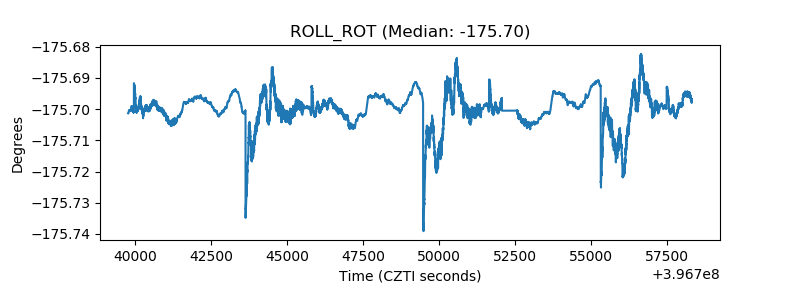 |
| _Roll_DEC | 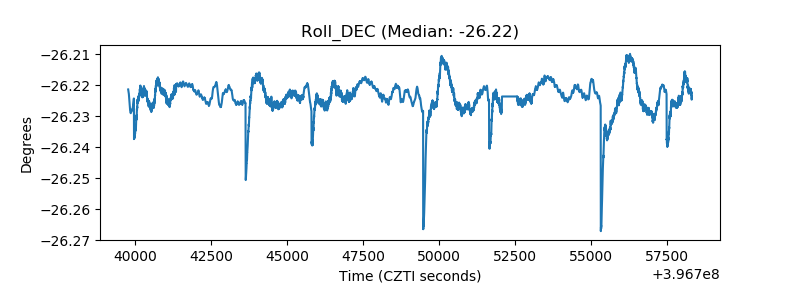 |
| _Roll_RA | 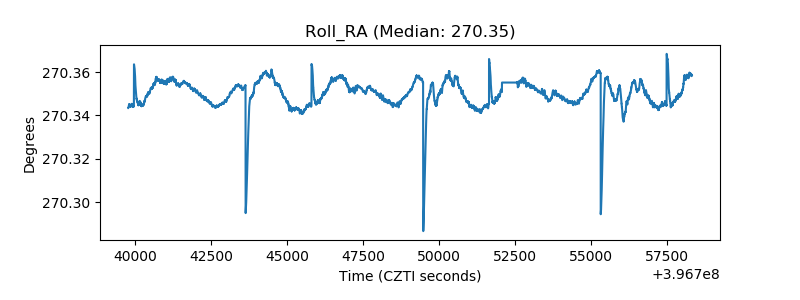 |
| Veto Counter | 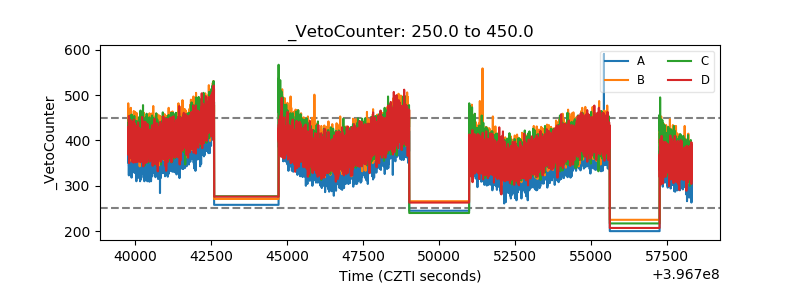 |