| Param | Original file | Final file |
|---|---|---|
| Filename | modeM0/AS1A11_024T01_9000005250_36946cztM0_level2.evt | modeM0/AS1A11_024T01_9000005250_36946cztM0_level2_quad_clean.evt |
| Size (bytes) | 1,138,622,400 | 144,264,960 |
| Size | 1.1 GB | 137.6 MB |
| Events in quadrant A | 6,747,552 | 861,871 |
| Events in quadrant B | 9,849,762 | 856,913 |
| Events in quadrant C | 7,765,796 | 861,970 |
| Events in quadrant D | 9,171,258 | 817,229 |
| Mode M9 | |||
|---|---|---|---|
| Quadrant | BADHDUFLAG | Total packets | Discarded packets |
| A | 0 | 48 | 0 |
| B | 0 | 48 | 0 |
| C | 0 | 48 | 0 |
| D | 0 | 48 | 0 |
| Mode SS | |||
|---|---|---|---|
| Quadrant | BADHDUFLAG | Total packets | Discarded packets |
| A | 0 | 290 | 0 |
| B | 0 | 290 | 0 |
| C | 0 | 290 | 0 |
| D | 0 | 290 | 0 |
| Mode M0 | |||
|---|---|---|---|
| Quadrant | BADHDUFLAG | Total packets | Discarded packets |
| A | 0 | 29070 | 4 |
| B | 0 | 38742 | 3 |
| C | 0 | 31699 | 3 |
| D | 0 | 37047 | 3 |
| Quadrant | Total seconds | Saturated seconds | Saturation percentage |
|---|---|---|---|
| A | 14047 | 31 | 0.220688% |
| B | 14047 | 647 | 4.605966% |
| C | 14047 | 186 | 1.324126% |
| D | 14047 | 569 | 4.050687% |
Noise dominated data is calculated using 1-second bins in cleaned event files. If a bin has >2000 counts, and if more than 50% of those come from <1% of pixels, then it is considered to be noise-dominated and hence unusable.
| Quadrant | # 1 sec bins | Bins with >0 counts | Bins with >2000 counts | High rate bins dominated by noise | Noise dominated (total time) | Noise dominated (detector-on time) | Marked lightcurve |
|---|---|---|---|---|---|---|---|
| A | 19035 | 14050 | 18 | 18 | 0.09% | 0.13% | 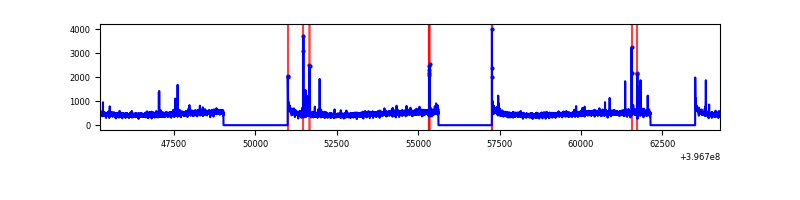 |
| B | 19035 | 14050 | 437 | 437 | 2.30% | 3.11% | 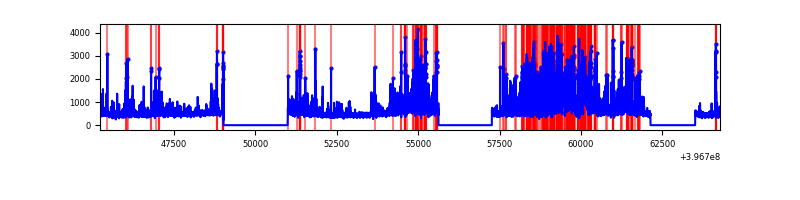 |
| C | 19035 | 14050 | 149 | 149 | 0.78% | 1.06% | 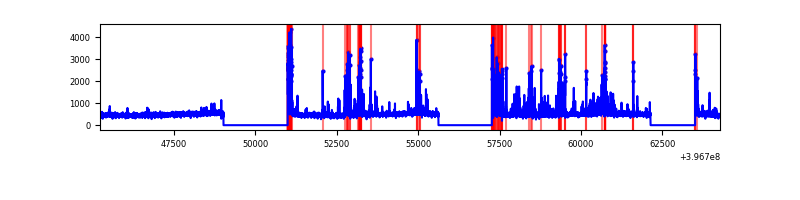 |
| D | 19035 | 14050 | 507 | 507 | 2.66% | 3.61% | 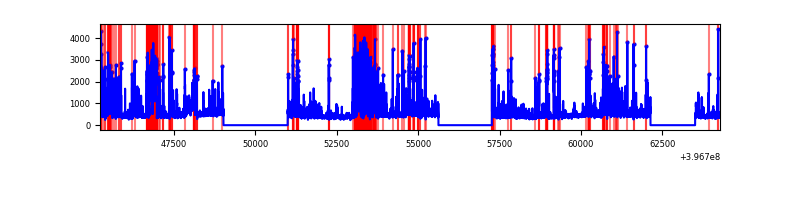 |
Top three noisy pixels from each quadrant. If the there are fewer than three noisy pixels in the level2.evt file, extra rows are filled as -1
| Pixel properties | Quadrant properties | ||||||
|---|---|---|---|---|---|---|---|
| Quadrant | DetID | PixID | Counts | Sigma | Mean | Median | Sigma |
| A | 10 | 83 | 481203 | 1502.73 | 1583 | 1554 | 319.2 |
| A | 15 | 237 | 53397 | 162.42 | 1583 | 1554 | 319.2 |
| A | 9 | 143 | 31025 | 92.33 | 1583 | 1554 | 319.2 |
| B | 5 | 184 | 2214530 | 7419.56 | 1558 | 1517 | 298.3 |
| B | 5 | 172 | 409091 | 1366.47 | 1558 | 1517 | 298.3 |
| B | 0 | 213 | 303822 | 1013.54 | 1558 | 1517 | 298.3 |
| C | 14 | 254 | 748157 | 2067.91 | 1540 | 1548 | 361.0 |
| C | 15 | 214 | 586085 | 1619.01 | 1540 | 1548 | 361.0 |
| C | 0 | 10 | 389582 | 1074.75 | 1540 | 1548 | 361.0 |
| D | 2 | 250 | 1279037 | 3486.42 | 1515 | 1473 | 366.4 |
| D | 2 | 153 | 589771 | 1605.44 | 1515 | 1473 | 366.4 |
| D | 13 | 249 | 499225 | 1358.34 | 1515 | 1473 | 366.4 |
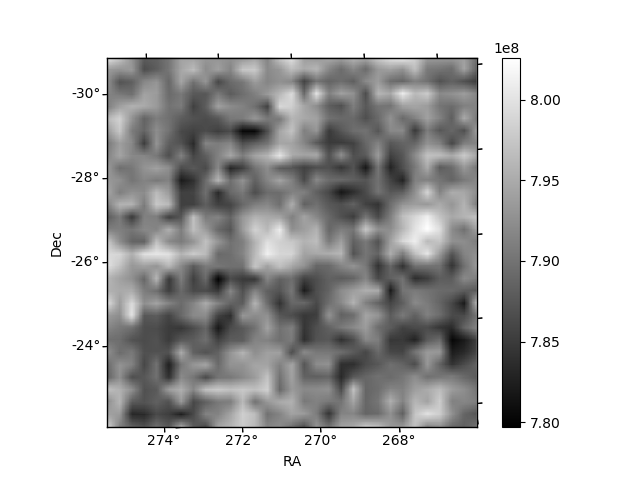
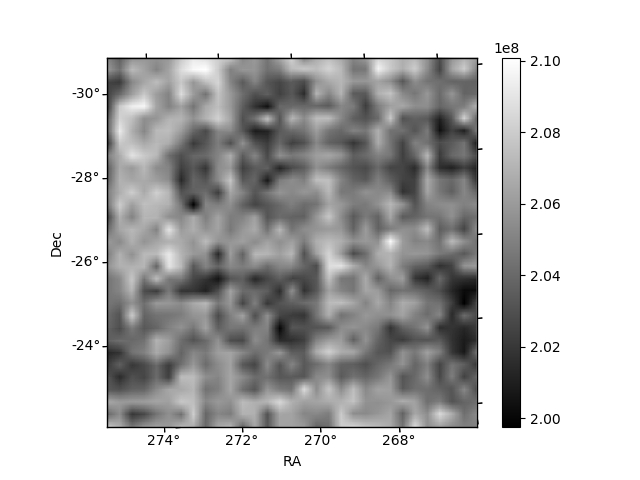
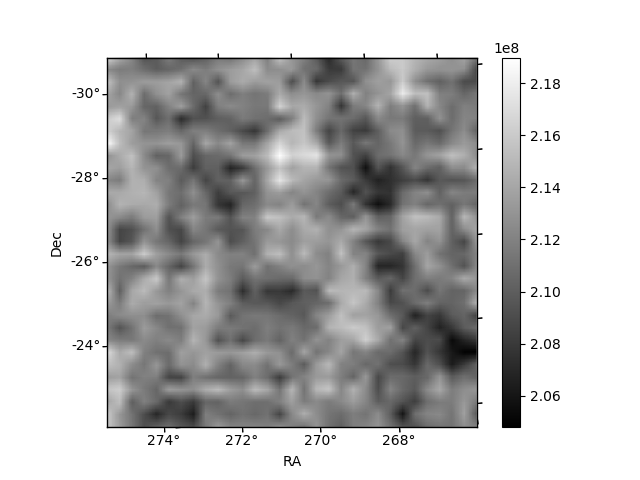
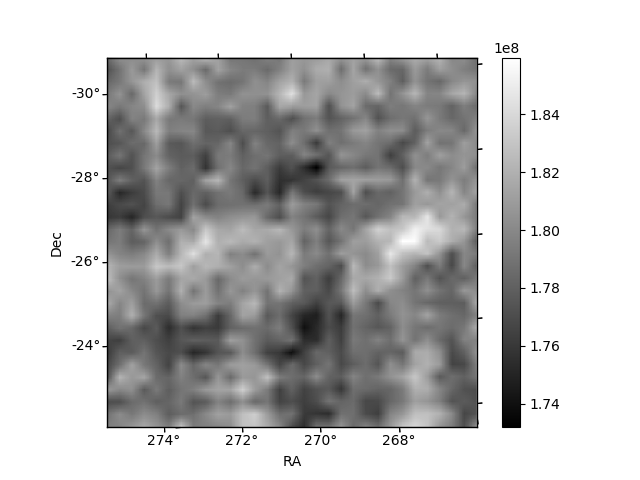
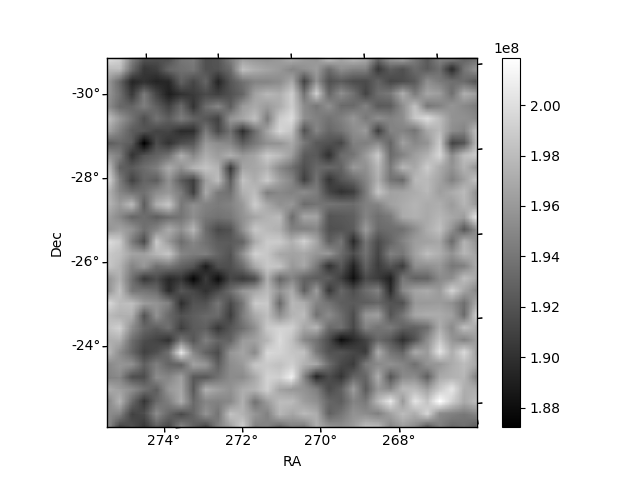
Histogram calculated using DETX and DETY for each event in the final _common_clean file
| Quadrant A | 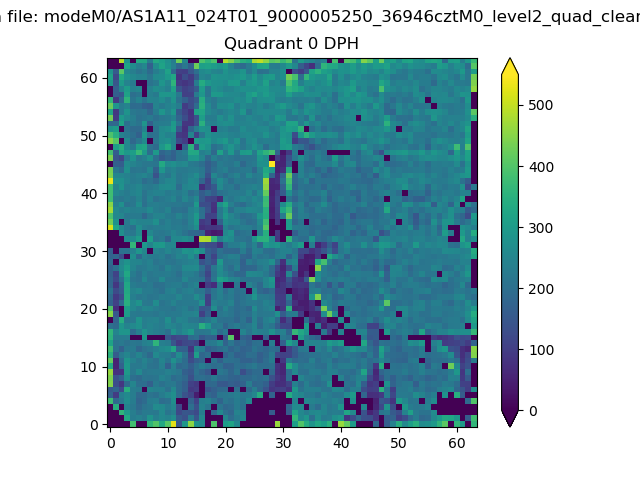 |
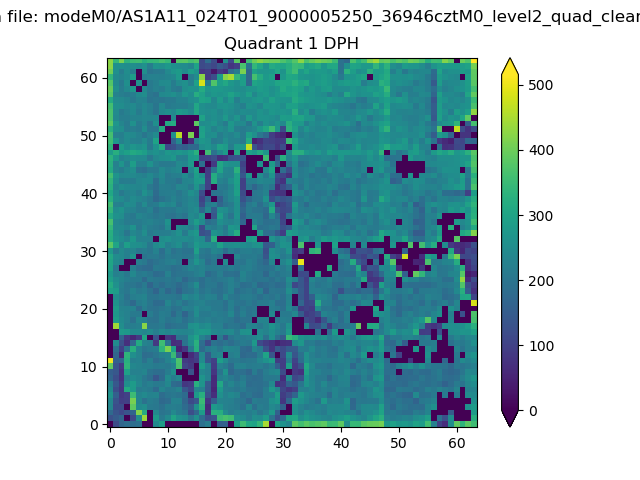 |
Quadrant B |
|---|---|---|---|
| Quadrant D | 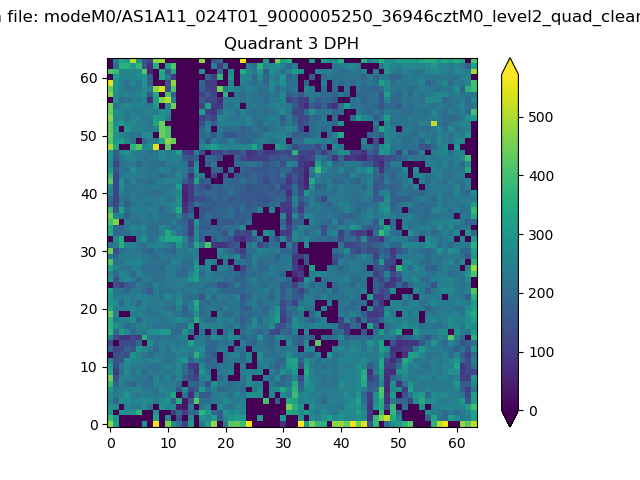 |
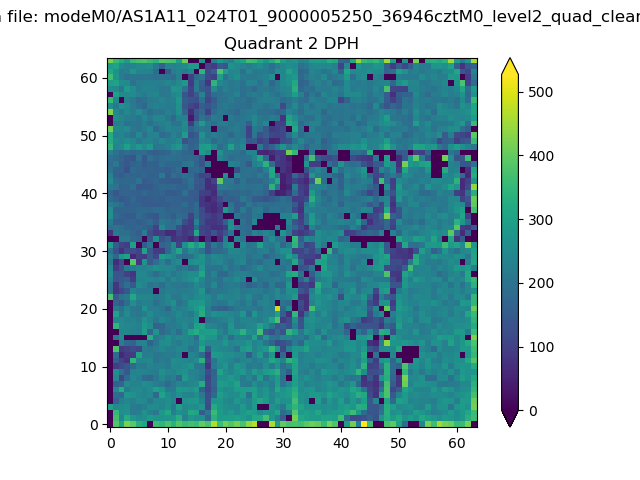 |
Quadrant C |
| Plot type | Count rate plots | Images |
|---|---|---|
| Comparison with Poisson distribution Blue bars denote a histogram of data divided into 1 sec bins. Red curve is a Poisson curve with rate = median count rate of data. |
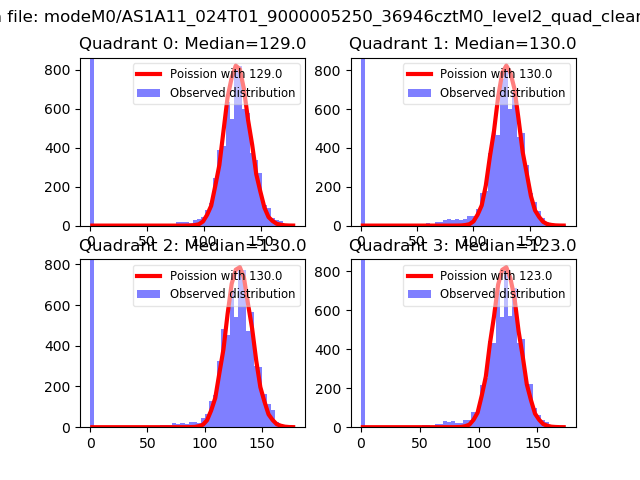 |
 |
| Quadrant-wise count rates Data is divided into 100 sec bins |
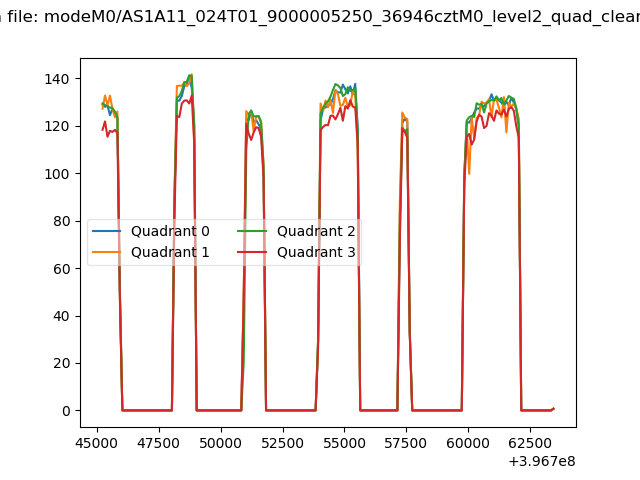 |
|
| Module-wise count rates for Quadrant A Data is divided into 100 sec bins |
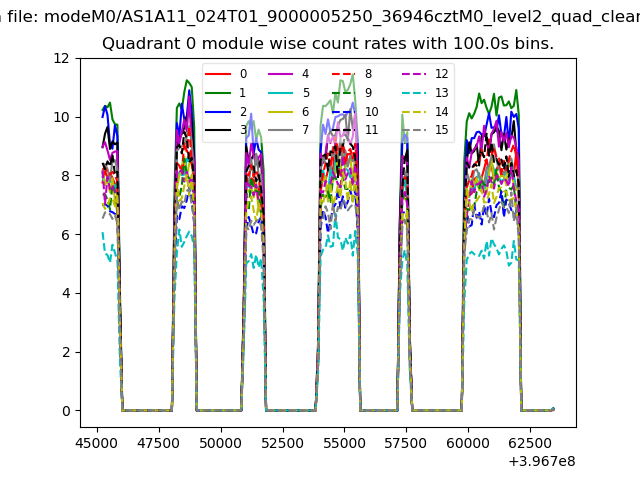 |
 |
| Module-wise count rates for Quadrant B Data is divided into 100 sec bins |
 |
 |
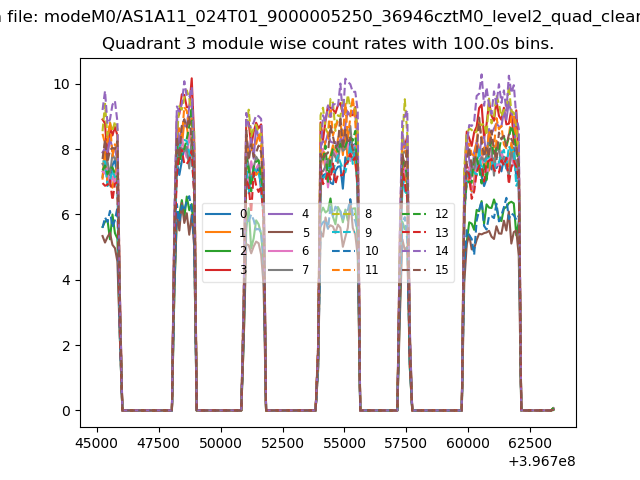
| Module-wise count rates for Quadrant C Data is divided into 100 sec bins |
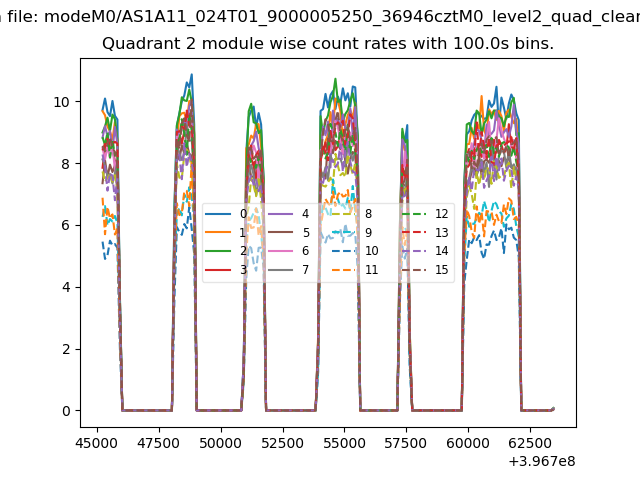 |
 |
| Module-wise count rates for Quadrant D Data is divided into 100 sec bins |
 |
 |
| Parameter | Plot |
|---|---|
| CZT HV Monitor | 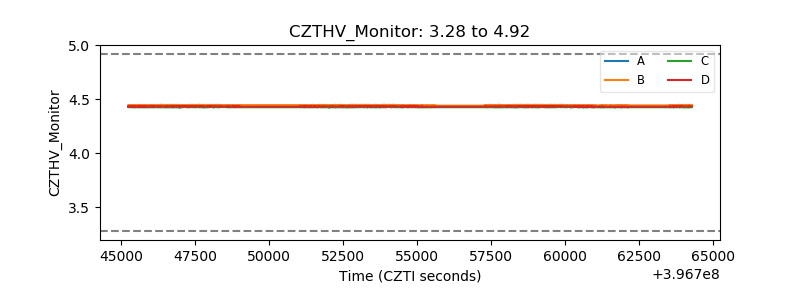 |
| D_VDD | 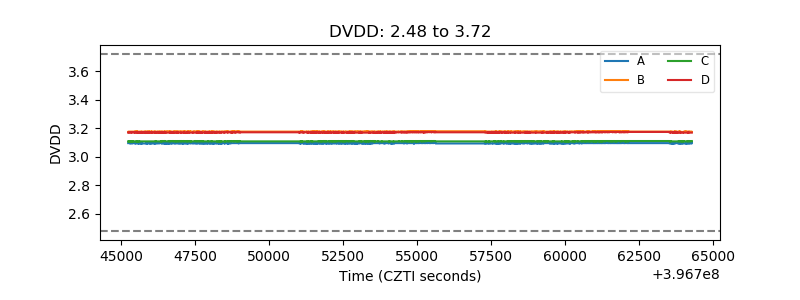 |
| Temperature 1 | 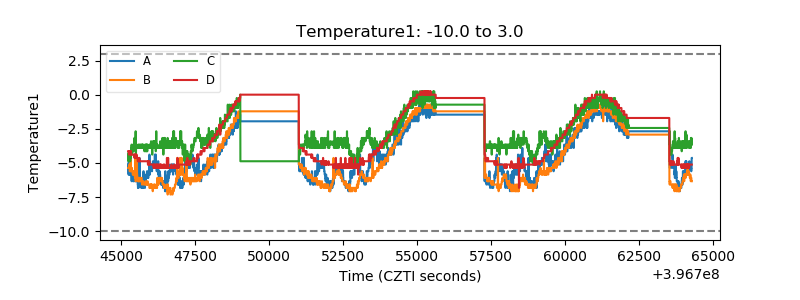 |
| Veto HV Monitor | 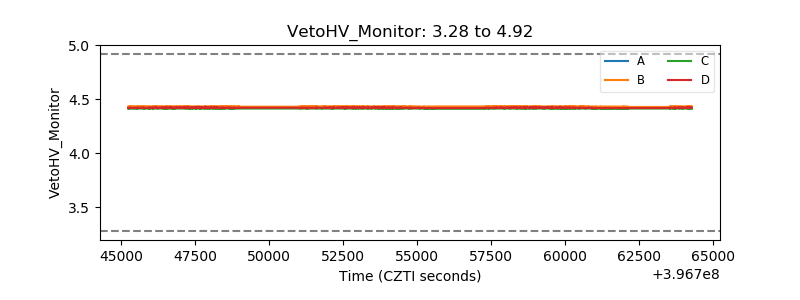 |
| Veto LLD | 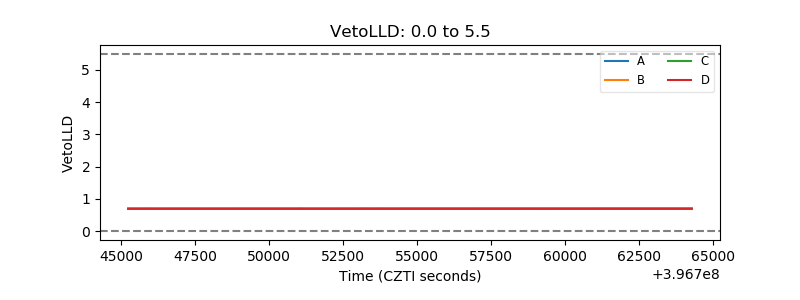 |
| Alpha Counter | 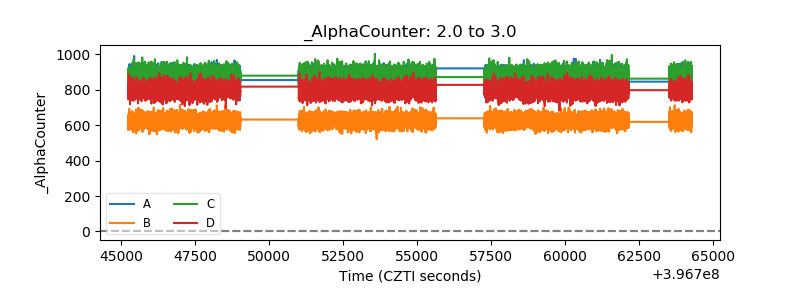 |
| _CPM_Rate | 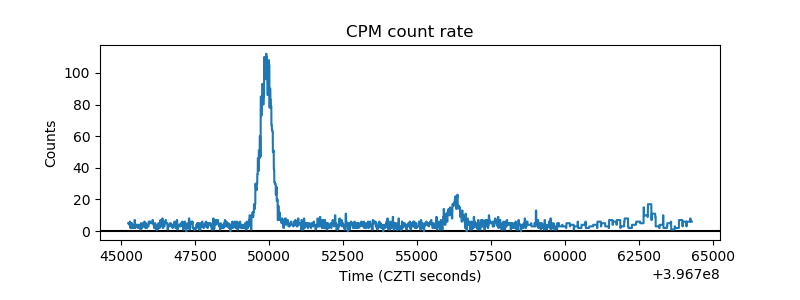 |
| CZT Counter | 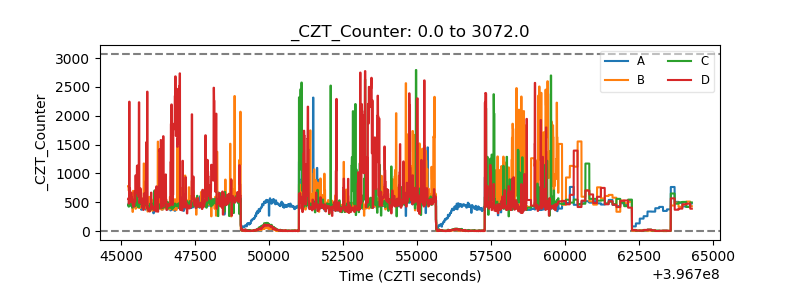 |
| +2.5 Volts monitor | 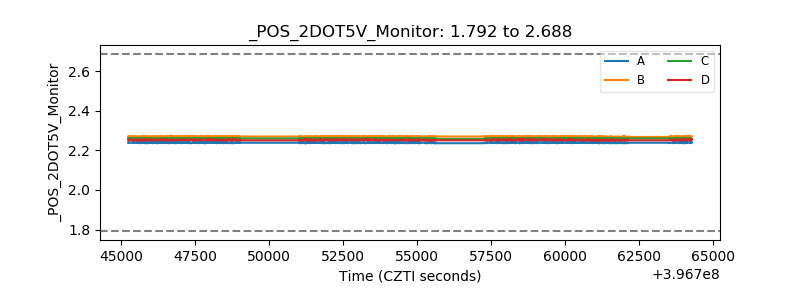 |
| +5 Volts monitor | 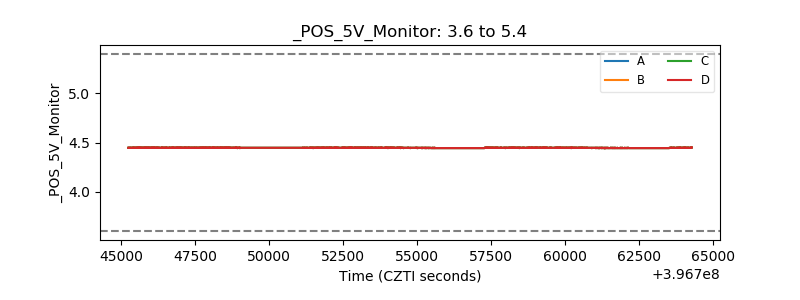 |
| _ROLL_ROT | 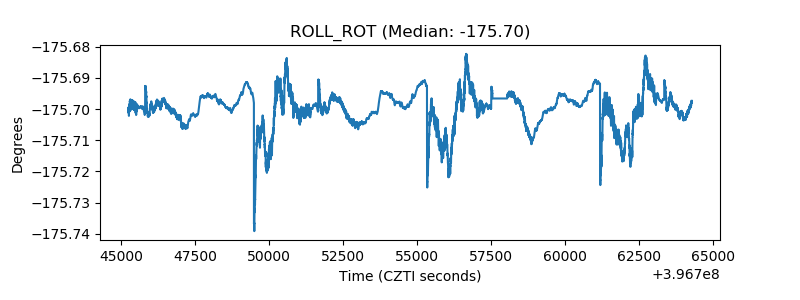 |
| _Roll_DEC | 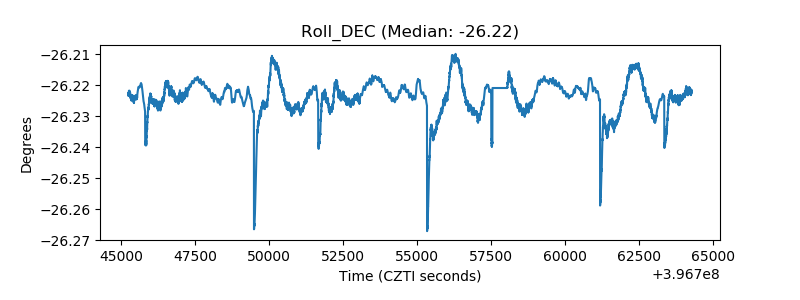 |
| _Roll_RA | 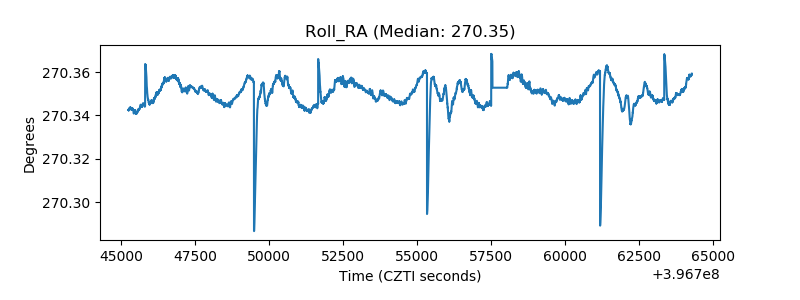 |
| Veto Counter | 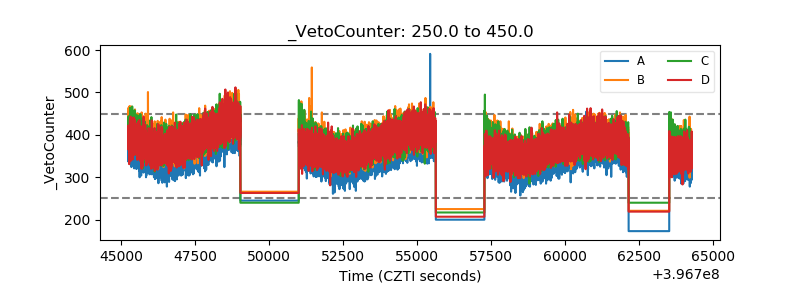 |