| Param | Original file | Final file |
|---|---|---|
| Filename | modeM0/AS1A11_024T01_9000005250_36947cztM0_level2.evt | modeM0/AS1A11_024T01_9000005250_36947cztM0_level2_quad_clean.evt |
| Size (bytes) | 1,531,998,720 | 201,957,120 |
| Size | 1.4 GB | 192.6 MB |
| Events in quadrant A | 9,217,570 | 1,214,183 |
| Events in quadrant B | 12,617,210 | 1,210,545 |
| Events in quadrant C | 10,813,111 | 1,210,486 |
| Events in quadrant D | 12,446,937 | 1,151,415 |
| Mode M9 | |||
|---|---|---|---|
| Quadrant | BADHDUFLAG | Total packets | Discarded packets |
| A | 0 | 61 | 0 |
| B | 0 | 61 | 0 |
| C | 0 | 61 | 0 |
| D | 0 | 61 | 0 |
| Mode SS | |||
|---|---|---|---|
| Quadrant | BADHDUFLAG | Total packets | Discarded packets |
| A | 0 | 396 | 0 |
| B | 0 | 396 | 0 |
| C | 0 | 396 | 0 |
| D | 0 | 396 | 0 |
| Mode M0 | |||
|---|---|---|---|
| Quadrant | BADHDUFLAG | Total packets | Discarded packets |
| A | 0 | 39719 | 5 |
| B | 0 | 50368 | 4 |
| C | 0 | 43978 | 4 |
| D | 0 | 50441 | 4 |
| Quadrant | Total seconds | Saturated seconds | Saturation percentage |
|---|---|---|---|
| A | 19292 | 32 | 0.165872% |
| B | 19292 | 690 | 3.576612% |
| C | 19292 | 299 | 1.549865% |
| D | 19292 | 702 | 3.638814% |
Noise dominated data is calculated using 1-second bins in cleaned event files. If a bin has >2000 counts, and if more than 50% of those come from <1% of pixels, then it is considered to be noise-dominated and hence unusable.
| Quadrant | # 1 sec bins | Bins with >0 counts | Bins with >2000 counts | High rate bins dominated by noise | Noise dominated (total time) | Noise dominated (detector-on time) | Marked lightcurve |
|---|---|---|---|---|---|---|---|
| A | 25563 | 19296 | 18 | 18 | 0.07% | 0.09% | 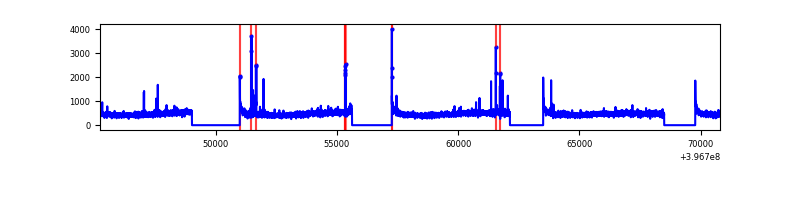 |
| B | 25563 | 19296 | 462 | 462 | 1.81% | 2.39% | 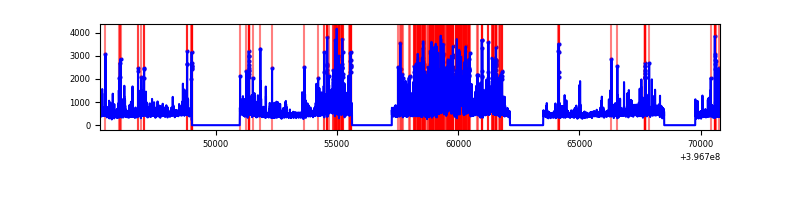 |
| C | 25563 | 19296 | 265 | 265 | 1.04% | 1.37% | 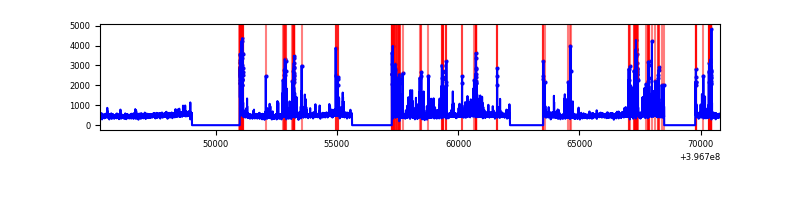 |
| D | 25563 | 19296 | 646 | 646 | 2.53% | 3.35% |  |
Top three noisy pixels from each quadrant. If the there are fewer than three noisy pixels in the level2.evt file, extra rows are filled as -1
| Pixel properties | Quadrant properties | ||||||
|---|---|---|---|---|---|---|---|
| Quadrant | DetID | PixID | Counts | Sigma | Mean | Median | Sigma |
| A | 10 | 83 | 658510 | 1507.27 | 2170 | 2127 | 435.5 |
| A | 15 | 237 | 54241 | 119.67 | 2170 | 2127 | 435.5 |
| A | 13 | 6 | 33603 | 72.28 | 2170 | 2127 | 435.5 |
| B | 5 | 184 | 2220640 | 5435.36 | 2143 | 2083 | 408.2 |
| B | 5 | 172 | 545419 | 1331.15 | 2143 | 2083 | 408.2 |
| B | 0 | 213 | 332157 | 808.67 | 2143 | 2083 | 408.2 |
| C | 14 | 254 | 1271928 | 2587.62 | 2105 | 2117 | 490.7 |
| C | 15 | 214 | 806611 | 1639.4 | 2105 | 2117 | 490.7 |
| C | 0 | 10 | 468221 | 949.83 | 2105 | 2117 | 490.7 |
| D | 2 | 250 | 1401907 | 2770.53 | 2083 | 2029 | 505.3 |
| D | 12 | 17 | 1050761 | 2075.57 | 2083 | 2029 | 505.3 |
| D | 2 | 153 | 654727 | 1291.77 | 2083 | 2029 | 505.3 |
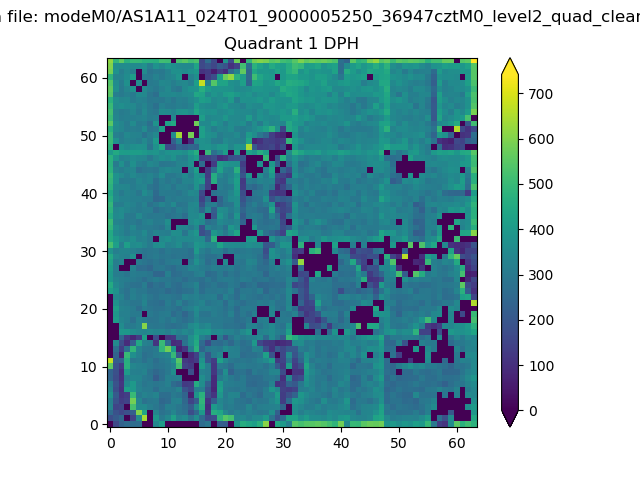
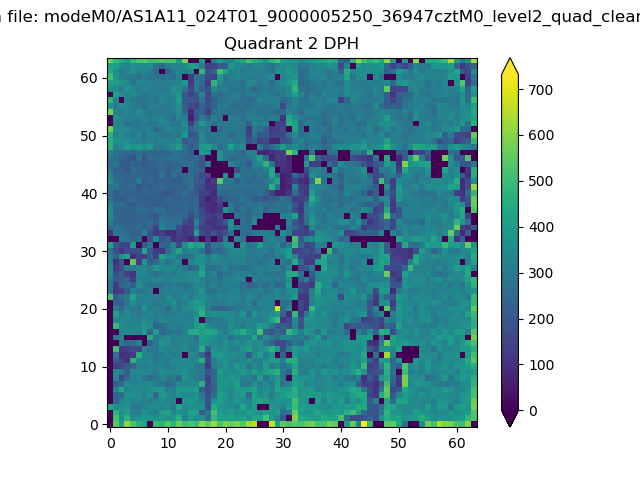
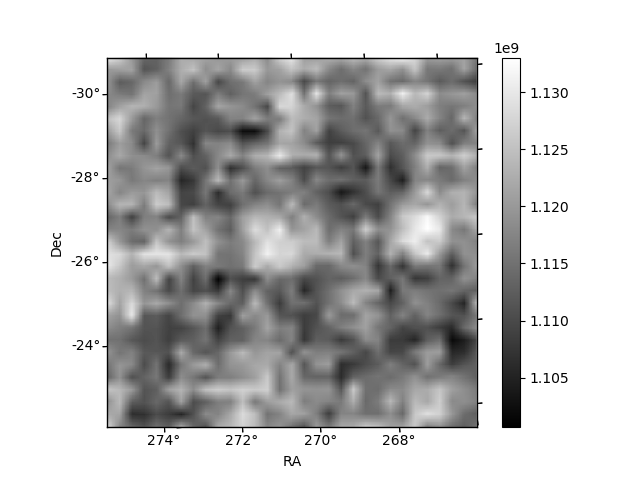
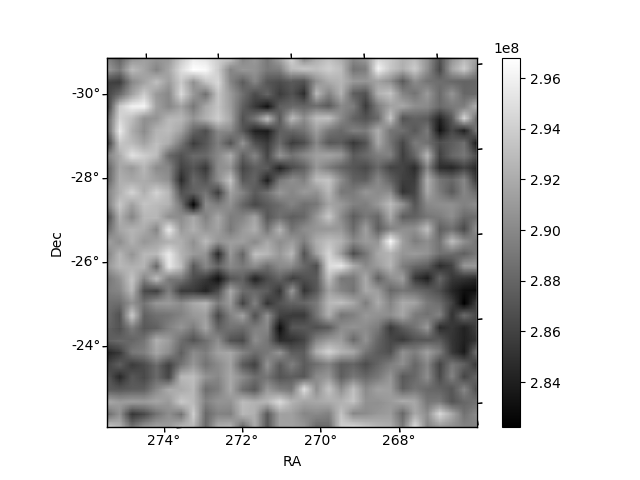
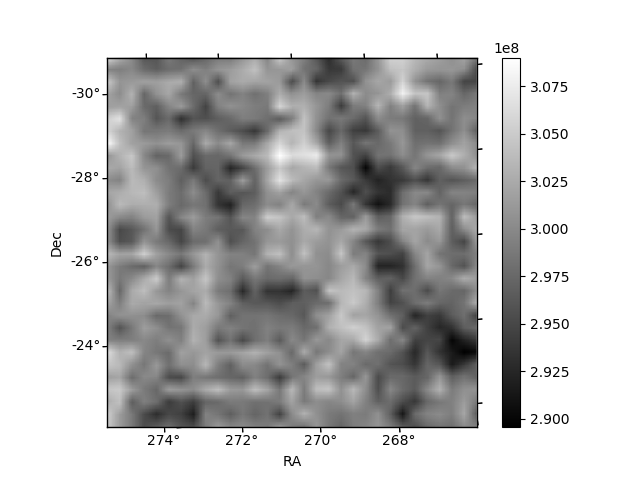
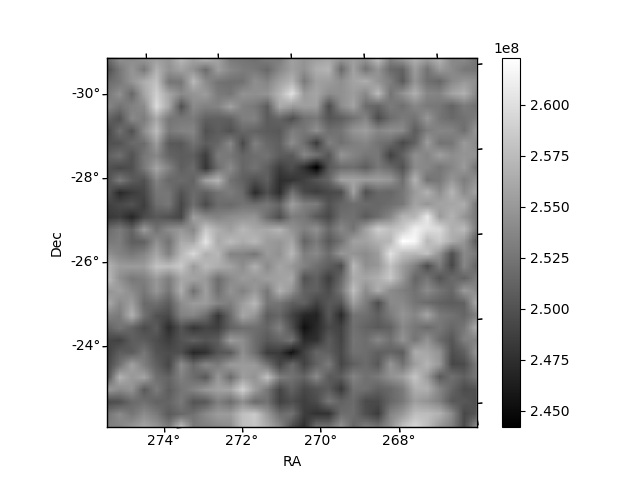
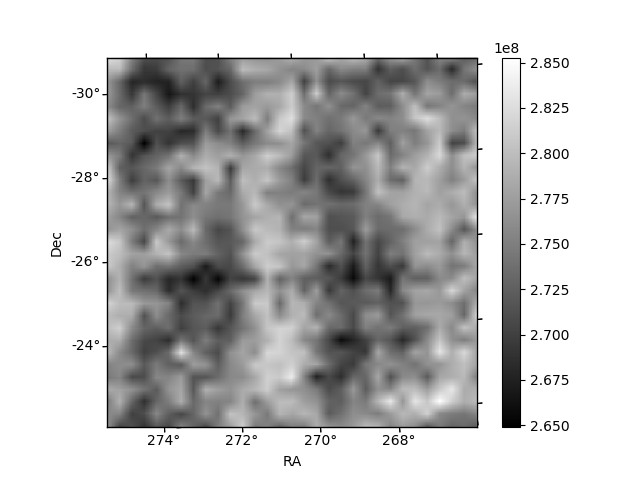
Histogram calculated using DETX and DETY for each event in the final _common_clean file
| Quadrant A | 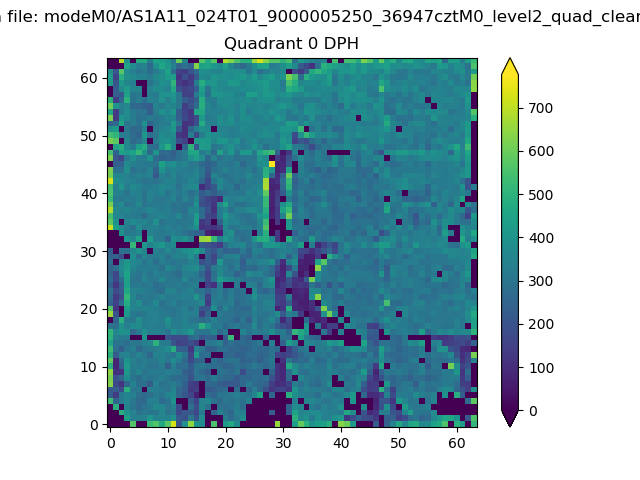 |
 |
Quadrant B |
|---|---|---|---|
| Quadrant D | 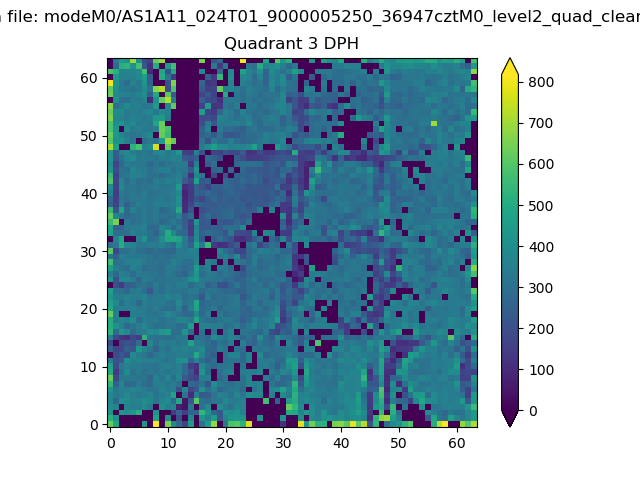 |
 |
Quadrant C |
| Plot type | Count rate plots | Images |
|---|---|---|
| Comparison with Poisson distribution Blue bars denote a histogram of data divided into 1 sec bins. Red curve is a Poisson curve with rate = median count rate of data. |
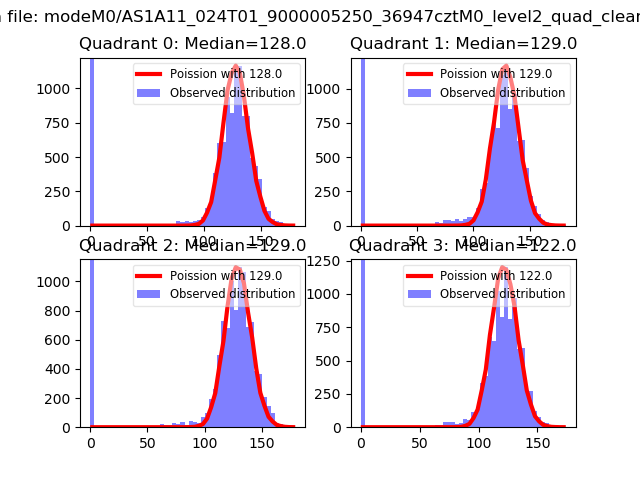 |
 |
| Quadrant-wise count rates Data is divided into 100 sec bins |
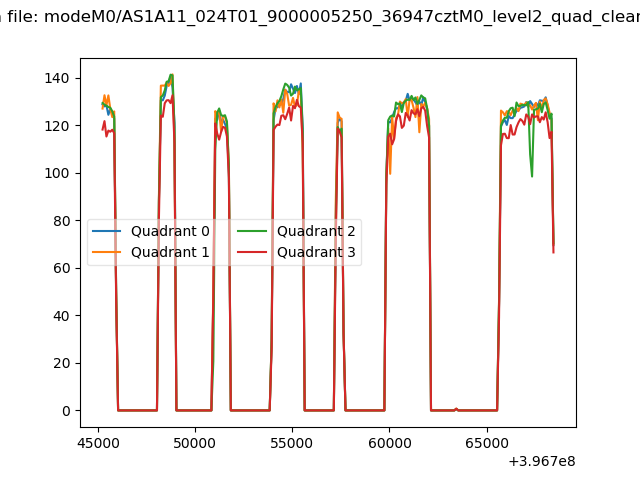 |
|
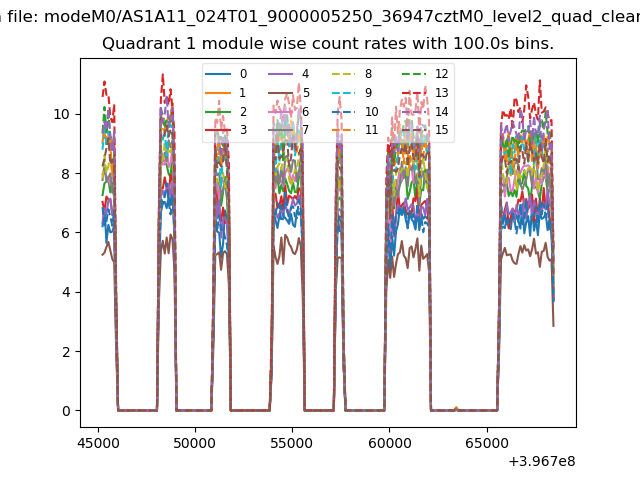
| Module-wise count rates for Quadrant A Data is divided into 100 sec bins |
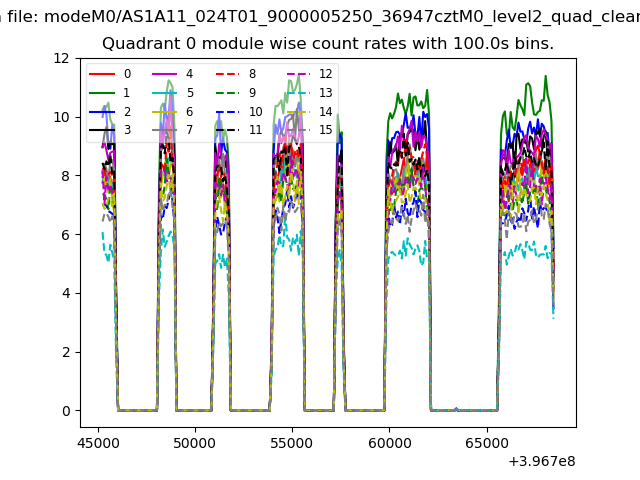 |
 |
| Module-wise count rates for Quadrant B Data is divided into 100 sec bins |
 |
 |
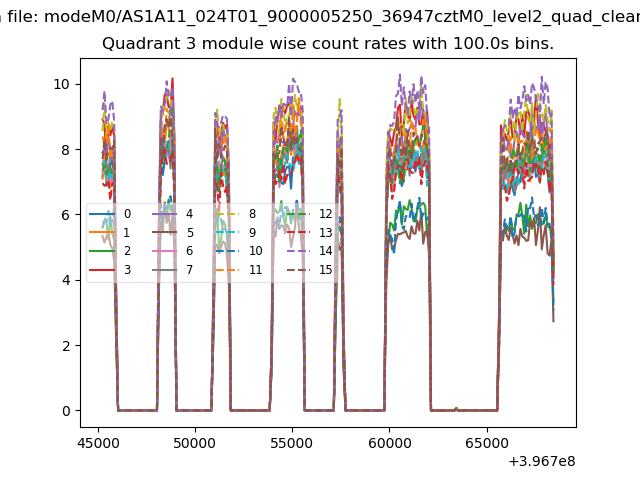
| Module-wise count rates for Quadrant C Data is divided into 100 sec bins |
 |
 |
| Module-wise count rates for Quadrant D Data is divided into 100 sec bins |
 |
 |
| Parameter | Plot |
|---|---|
| CZT HV Monitor | 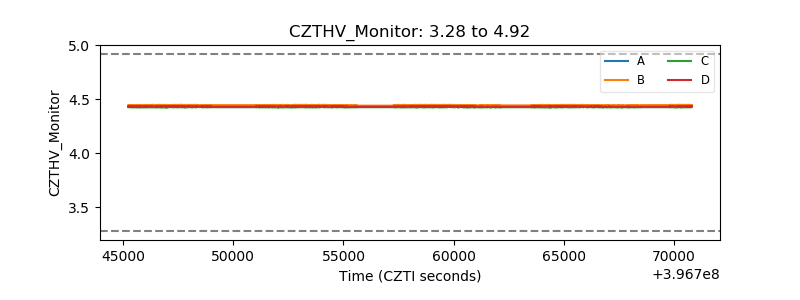 |
| D_VDD | 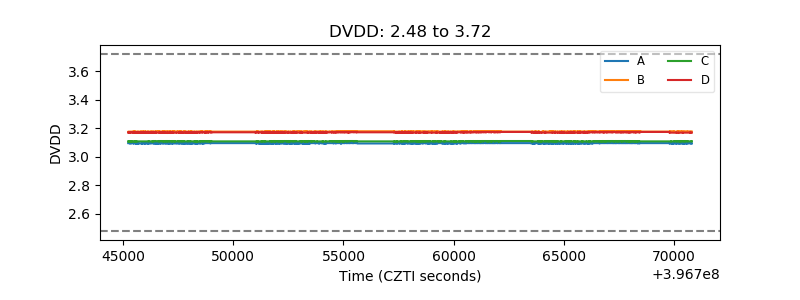 |
| Temperature 1 | 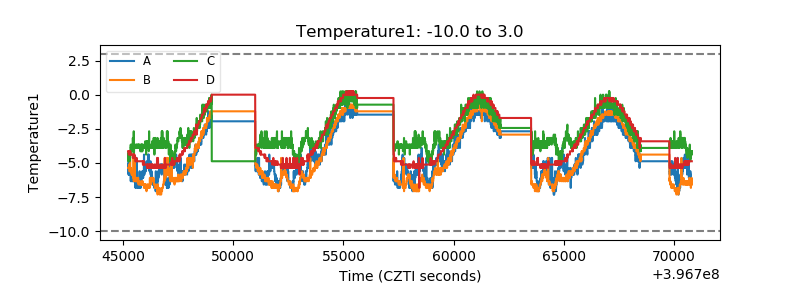 |
| Veto HV Monitor | 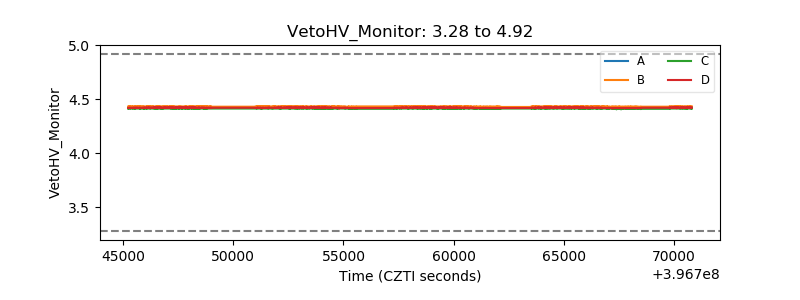 |
| Veto LLD | 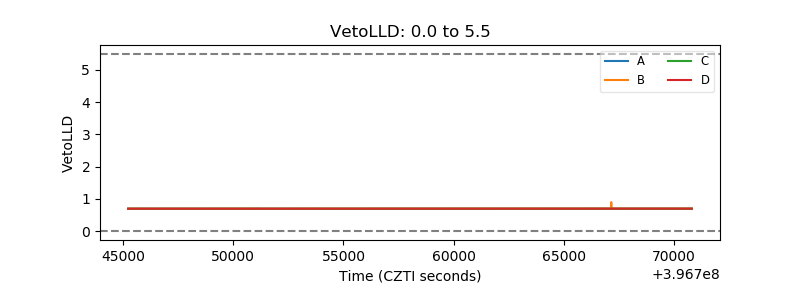 |
| Alpha Counter | 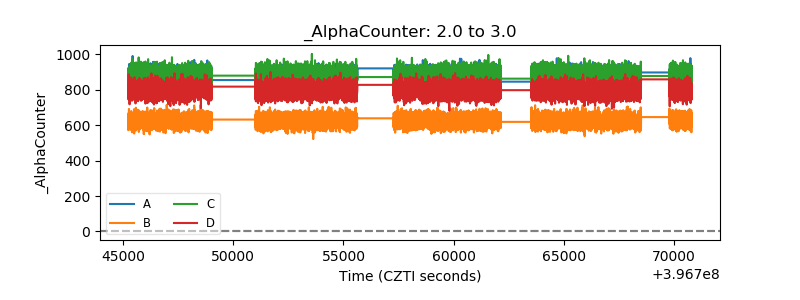 |
| _CPM_Rate | 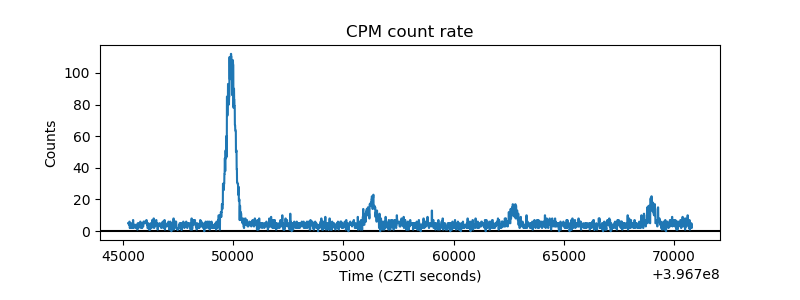 |
| CZT Counter | 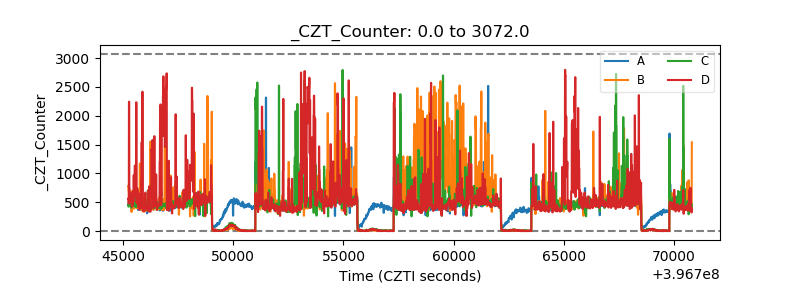 |
| +2.5 Volts monitor | 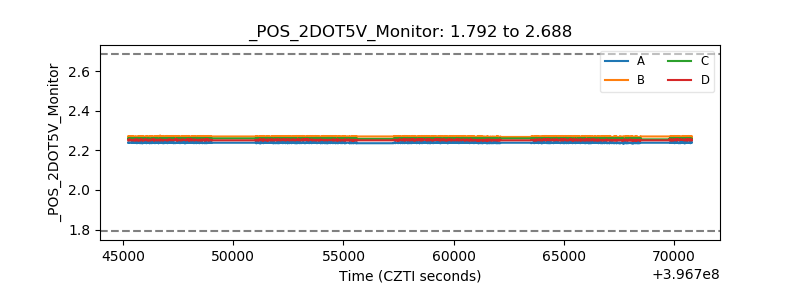 |
| +5 Volts monitor | 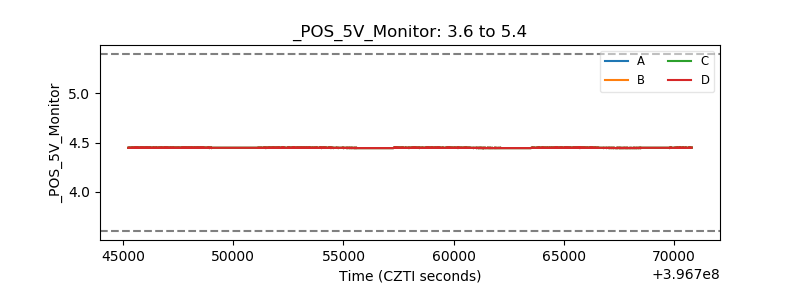 |
| _ROLL_ROT | 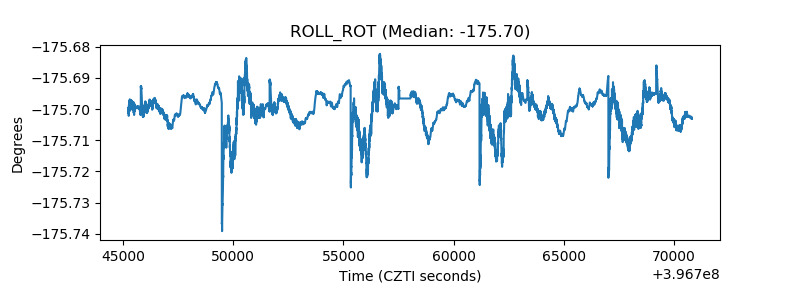 |
| _Roll_DEC | 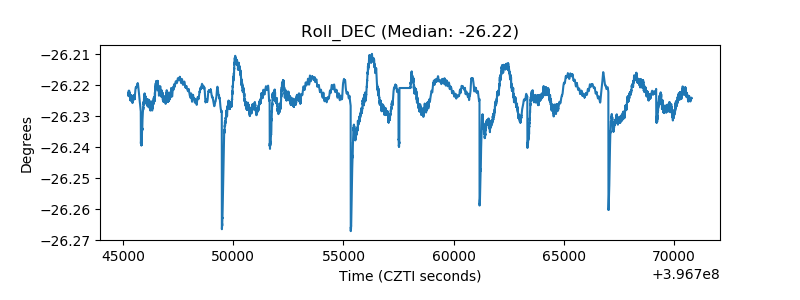 |
| _Roll_RA | 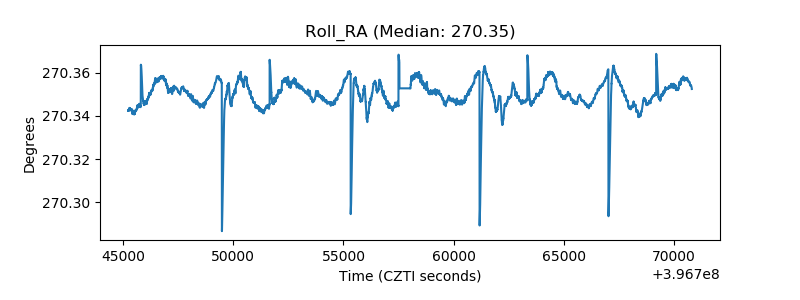 |
| Veto Counter | 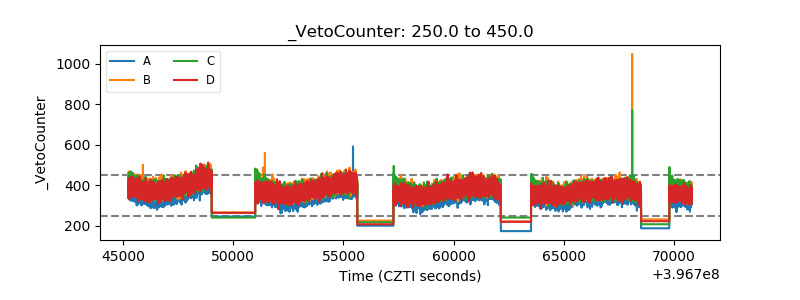 |