| Param | Original file | Final file |
|---|---|---|
| Filename | modeM0/AS1A11_024T01_9000005250_36950cztM0_level2.evt | modeM0/AS1A11_024T01_9000005250_36950cztM0_level2_quad_clean.evt |
| Size (bytes) | 1,377,034,560 | 224,386,560 |
| Size | 1.3 GB | 214.0 MB |
| Events in quadrant A | 7,980,847 | 1,451,479 |
| Events in quadrant B | 10,079,494 | 1,429,234 |
| Events in quadrant C | 12,259,977 | 1,421,468 |
| Events in quadrant D | 10,276,554 | 1,361,825 |
| Mode M9 | |||
|---|---|---|---|
| Quadrant | BADHDUFLAG | Total packets | Discarded packets |
| A | 0 | 55 | 0 |
| B | 0 | 55 | 0 |
| C | 0 | 55 | 0 |
| D | 0 | 55 | 0 |
| Mode SS | |||
|---|---|---|---|
| Quadrant | BADHDUFLAG | Total packets | Discarded packets |
| A | 0 | 336 | 0 |
| B | 0 | 336 | 0 |
| C | 0 | 336 | 0 |
| D | 0 | 336 | 0 |
| Mode M0 | |||
|---|---|---|---|
| Quadrant | BADHDUFLAG | Total packets | Discarded packets |
| A | 0 | 33992 | 5 |
| B | 0 | 40617 | 4 |
| C | 0 | 46696 | 4 |
| D | 0 | 41930 | 4 |
| Quadrant | Total seconds | Saturated seconds | Saturation percentage |
|---|---|---|---|
| A | 16410 | 27 | 0.164534% |
| B | 16410 | 514 | 3.132236% |
| C | 16410 | 952 | 5.801341% |
| D | 16410 | 529 | 3.223644% |
Noise dominated data is calculated using 1-second bins in cleaned event files. If a bin has >2000 counts, and if more than 50% of those come from <1% of pixels, then it is considered to be noise-dominated and hence unusable.
| Quadrant | # 1 sec bins | Bins with >0 counts | Bins with >2000 counts | High rate bins dominated by noise | Noise dominated (total time) | Noise dominated (detector-on time) | Marked lightcurve |
|---|---|---|---|---|---|---|---|
| A | 21931 | 16414 | 8 | 8 | 0.04% | 0.05% | 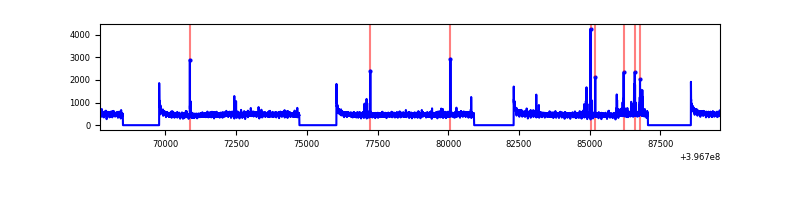 |
| B | 21931 | 16414 | 389 | 389 | 1.77% | 2.37% | 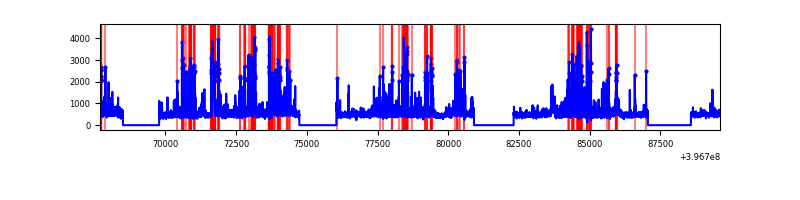 |
| C | 21931 | 16414 | 858 | 858 | 3.91% | 5.23% | 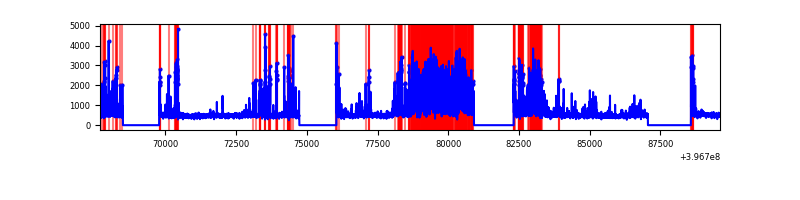 |
| D | 21931 | 16414 | 514 | 514 | 2.34% | 3.13% | 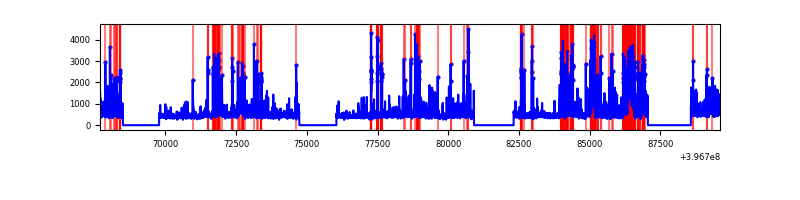 |
Top three noisy pixels from each quadrant. If the there are fewer than three noisy pixels in the level2.evt file, extra rows are filled as -1
| Pixel properties | Quadrant properties | ||||||
|---|---|---|---|---|---|---|---|
| Quadrant | DetID | PixID | Counts | Sigma | Mean | Median | Sigma |
| A | 10 | 83 | 599503 | 1589.94 | 1859 | 1823 | 375.9 |
| A | 0 | 247 | 97448 | 254.38 | 1859 | 1823 | 375.9 |
| A | 15 | 174 | 30645 | 76.67 | 1859 | 1823 | 375.9 |
| B | 0 | 229 | 674148 | 1934.74 | 1819 | 1771 | 347.5 |
| B | 5 | 172 | 651514 | 1869.61 | 1819 | 1771 | 347.5 |
| B | 4 | 171 | 621639 | 1783.65 | 1819 | 1771 | 347.5 |
| C | 14 | 254 | 4271160 | 10372.45 | 1774 | 1790 | 411.6 |
| C | 15 | 214 | 694004 | 1681.74 | 1774 | 1790 | 411.6 |
| C | 0 | 10 | 321133 | 775.84 | 1774 | 1790 | 411.6 |
| D | 12 | 17 | 981542 | 2246.04 | 1783 | 1728 | 436.2 |
| D | 12 | 233 | 561741 | 1283.73 | 1783 | 1728 | 436.2 |
| D | 2 | 250 | 391663 | 893.85 | 1783 | 1728 | 436.2 |
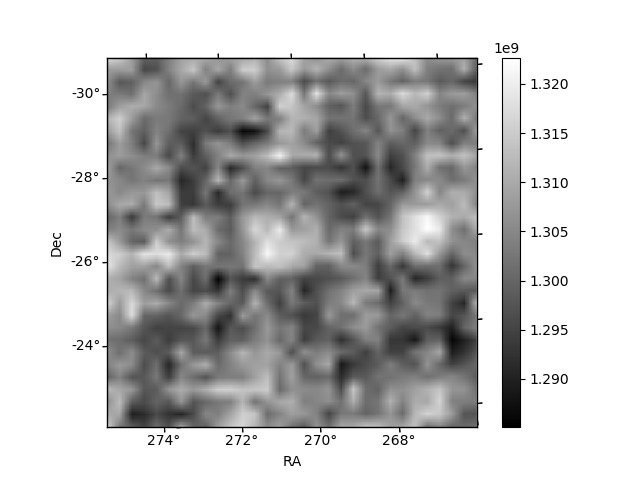
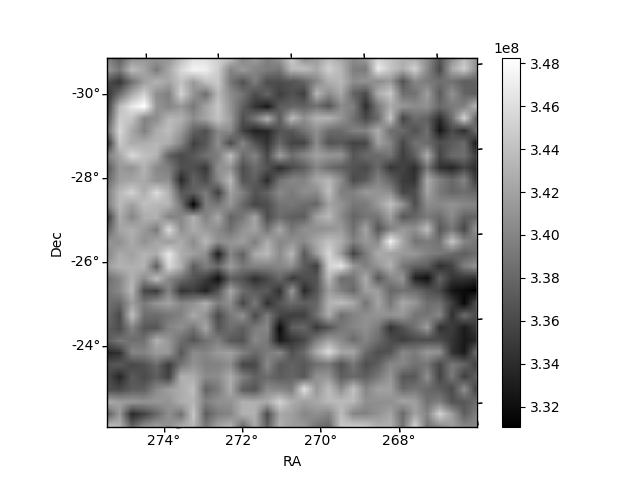
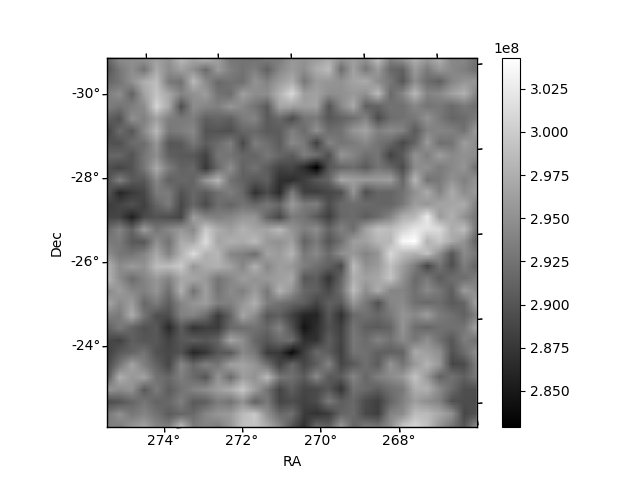
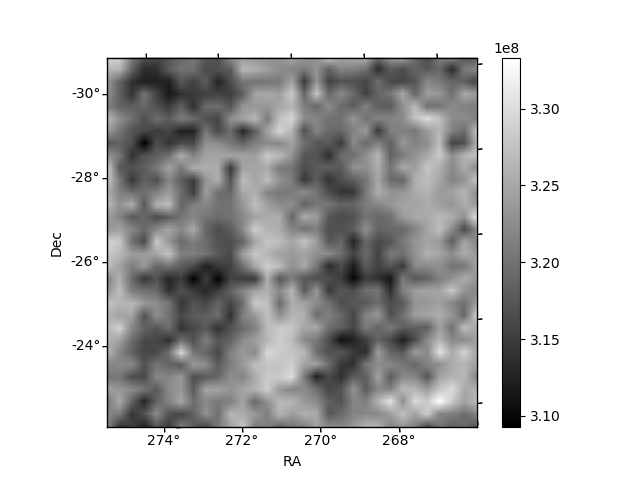
Histogram calculated using DETX and DETY for each event in the final _common_clean file
| Quadrant A | 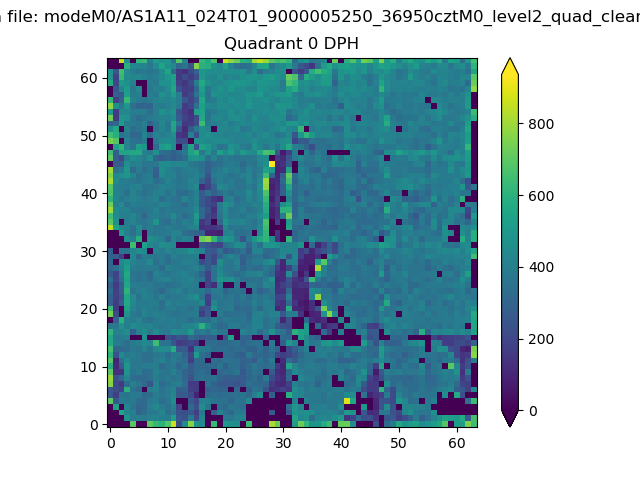 |
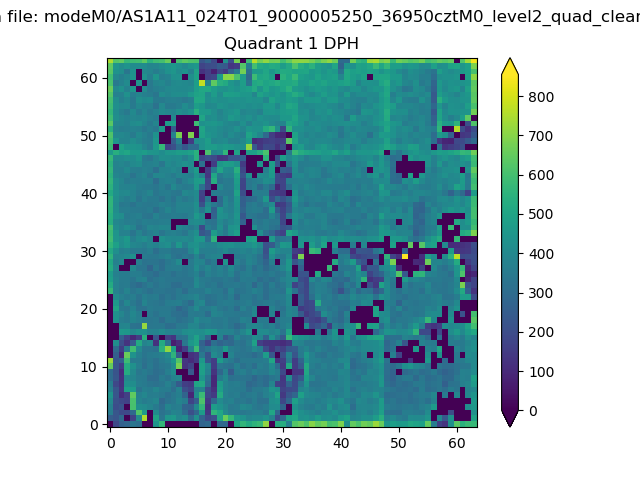 |
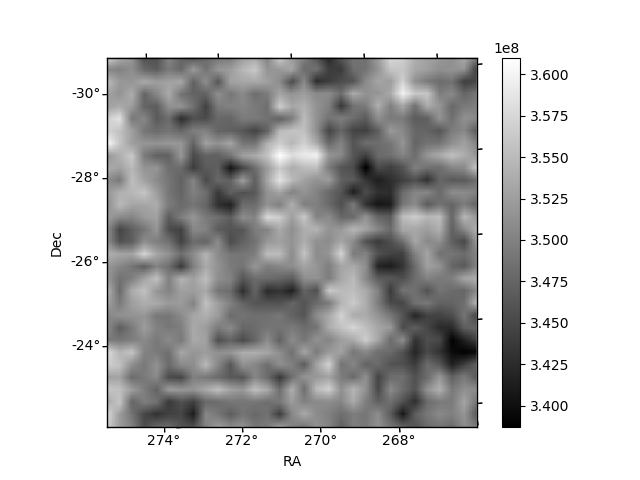
Quadrant B |
|---|---|---|---|
| Quadrant D | 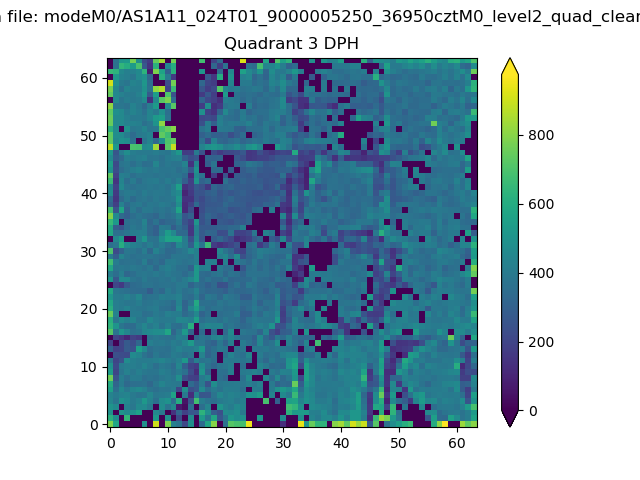 |
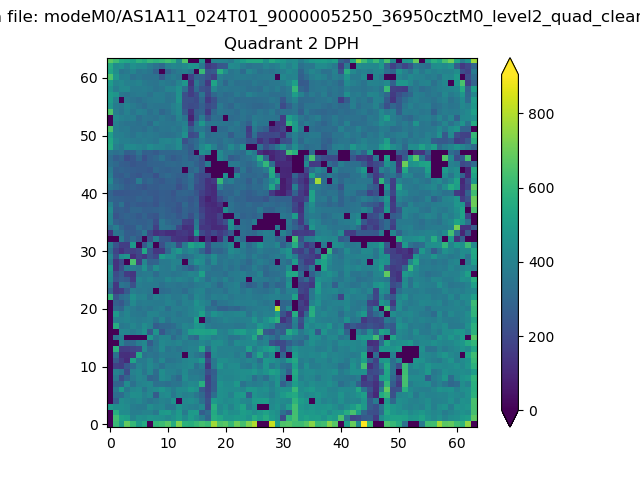 |
Quadrant C |
| Plot type | Count rate plots | Images |
|---|---|---|
| Comparison with Poisson distribution Blue bars denote a histogram of data divided into 1 sec bins. Red curve is a Poisson curve with rate = median count rate of data. |
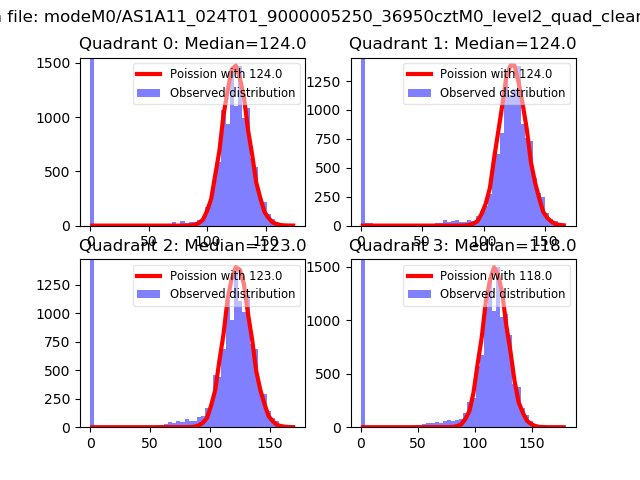 |
 |
| Quadrant-wise count rates Data is divided into 100 sec bins |
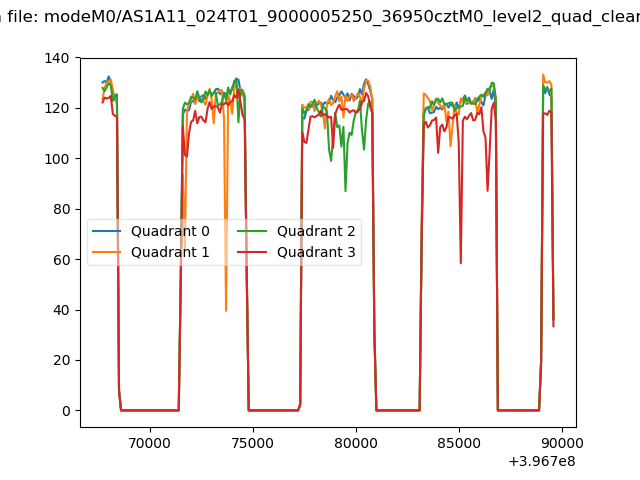 |
|
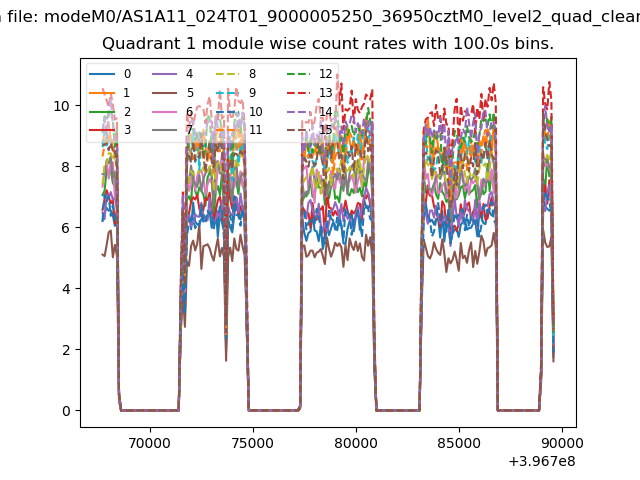
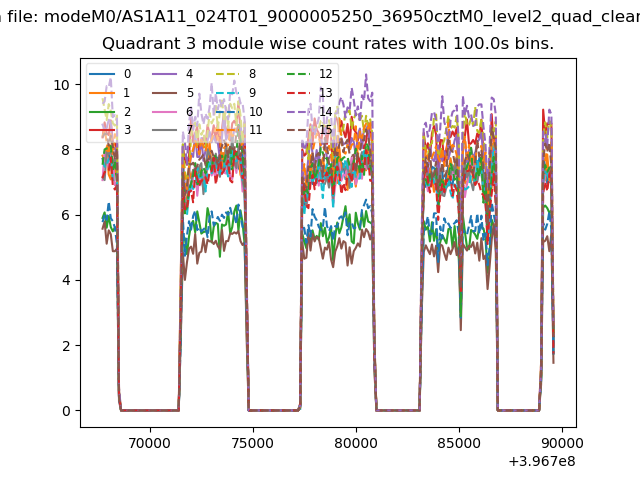
| Module-wise count rates for Quadrant A Data is divided into 100 sec bins |
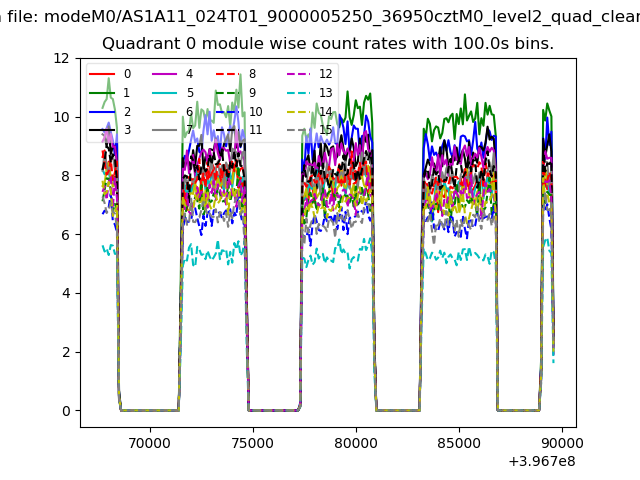 |
 |
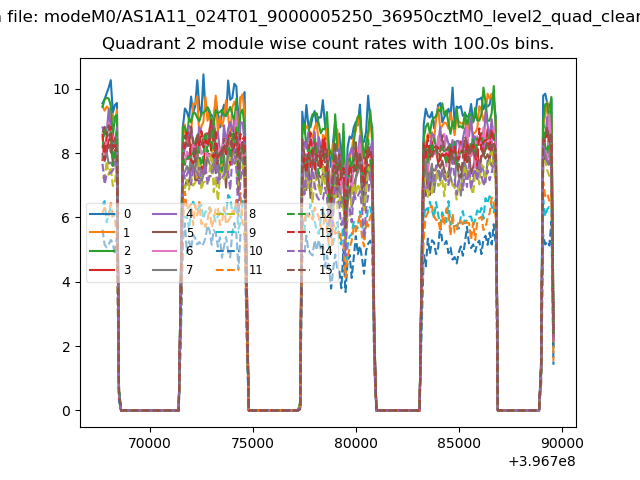
| Module-wise count rates for Quadrant B Data is divided into 100 sec bins |
 |
 |
| Module-wise count rates for Quadrant C Data is divided into 100 sec bins |
 |
 |
| Module-wise count rates for Quadrant D Data is divided into 100 sec bins |
 |
 |
| Parameter | Plot |
|---|---|
| CZT HV Monitor |  |
| D_VDD | 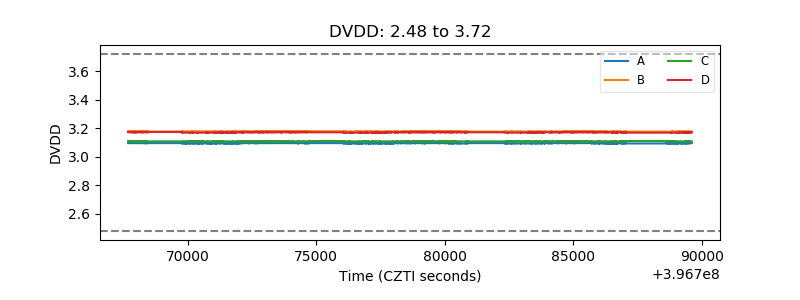 |
| Temperature 1 | 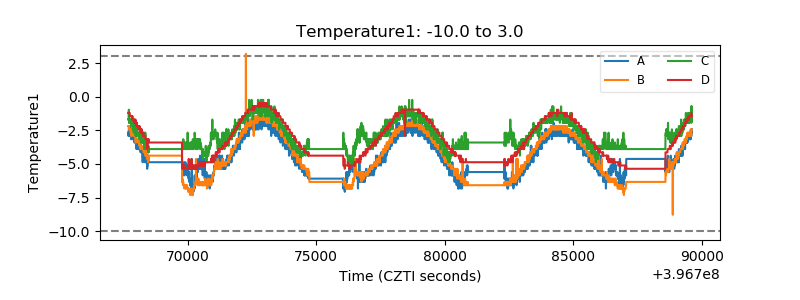 |
| Veto HV Monitor | 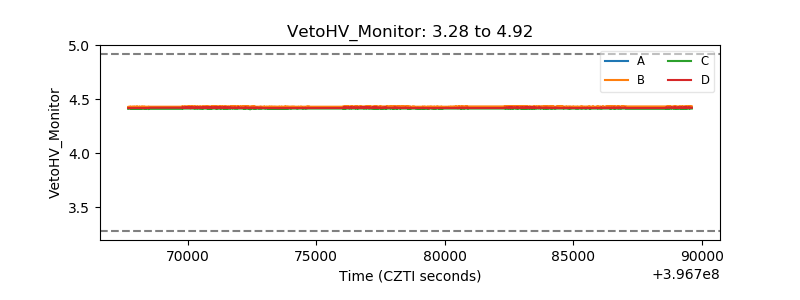 |
| Veto LLD | 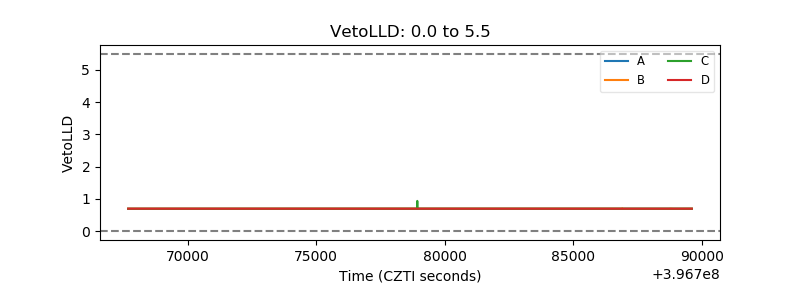 |
| Alpha Counter | 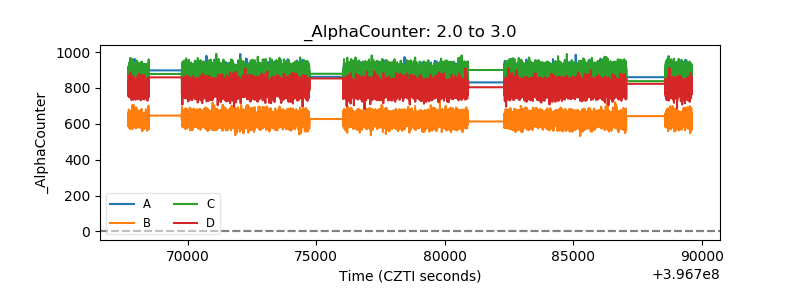 |
| _CPM_Rate | 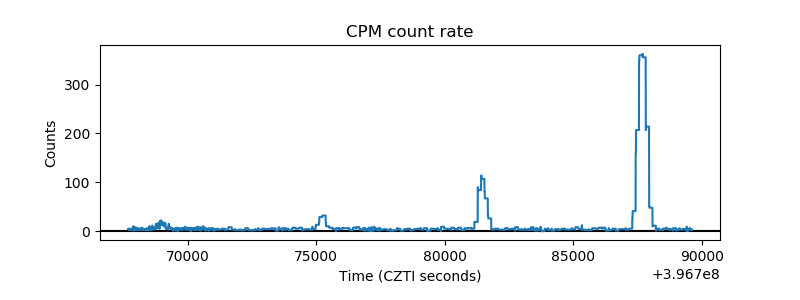 |
| CZT Counter | 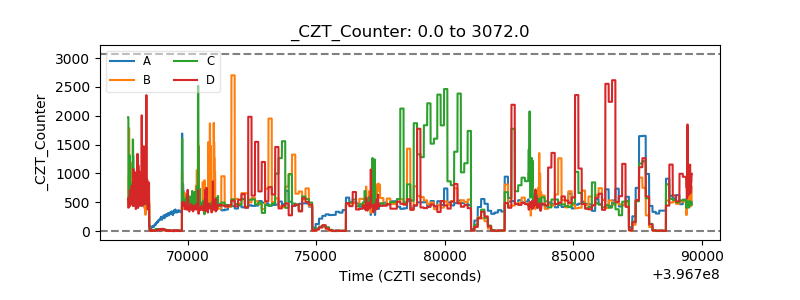 |
| +2.5 Volts monitor | 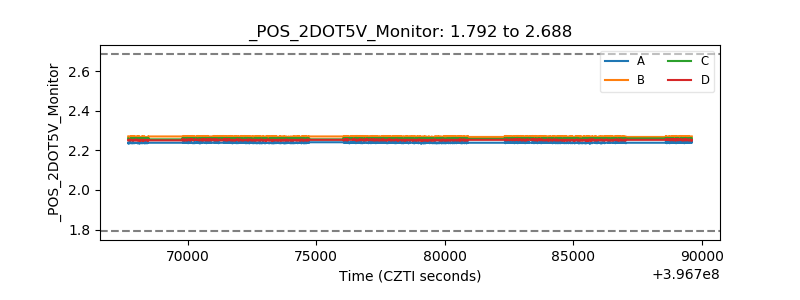 |
| +5 Volts monitor | 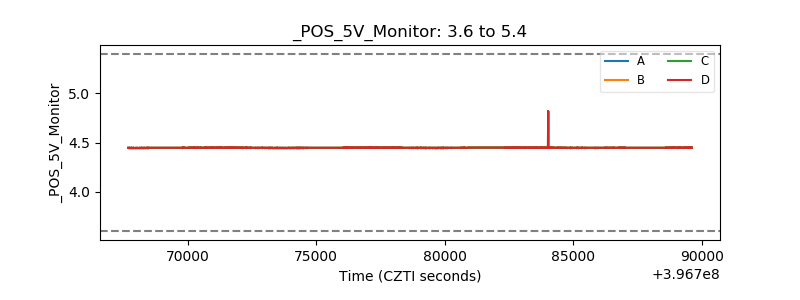 |
| _ROLL_ROT | 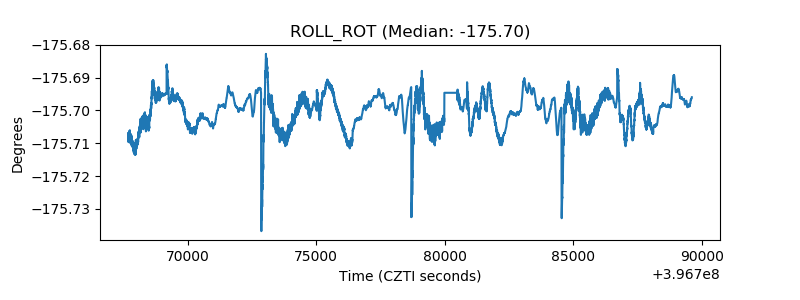 |
| _Roll_DEC | 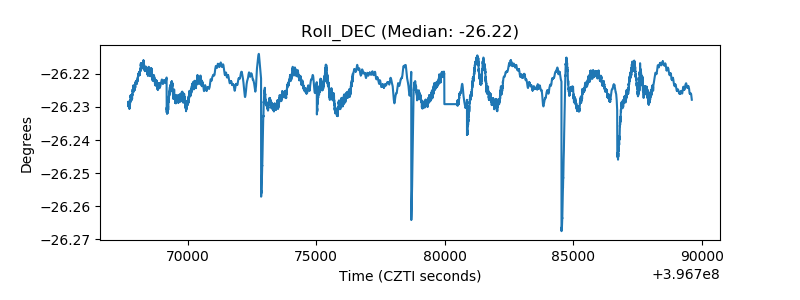 |
| _Roll_RA | 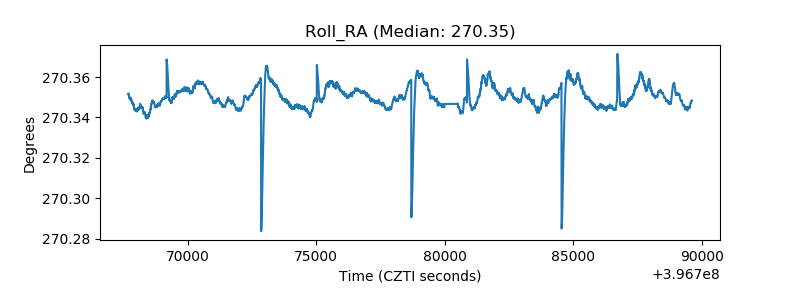 |
| Veto Counter | 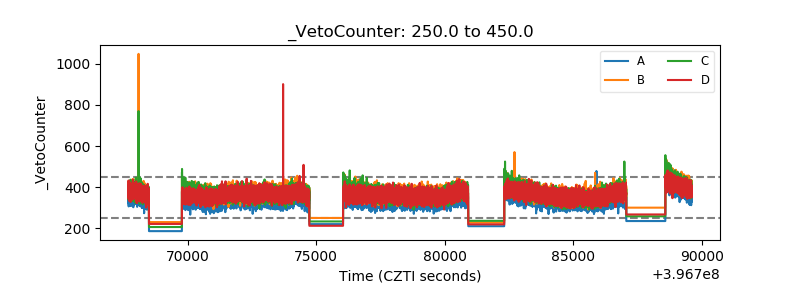 |