| Param | Original file | Final file |
|---|---|---|
| Filename | modeM0/AS1A11_024T01_9000005250_36951cztM0_level2.evt | modeM0/AS1A11_024T01_9000005250_36951cztM0_level2_quad_clean.evt |
| Size (bytes) | 414,573,120 | 88,056,000 |
| Size | 395.4 MB | 84.0 MB |
| Events in quadrant A | 2,796,824 | 575,474 |
| Events in quadrant B | 3,261,234 | 577,294 |
| Events in quadrant C | 2,860,100 | 579,240 |
| Events in quadrant D | 3,259,917 | 546,272 |
| Mode M9 | |||
|---|---|---|---|
| Quadrant | BADHDUFLAG | Total packets | Discarded packets |
| A | 0 | 30 | 0 |
| B | 0 | 30 | 0 |
| C | 0 | 30 | 0 |
| D | 0 | 31 | 0 |
| Mode SS | |||
|---|---|---|---|
| Quadrant | BADHDUFLAG | Total packets | Discarded packets |
| A | 0 | 112 | 0 |
| B | 0 | 112 | 0 |
| C | 0 | 112 | 0 |
| D | 0 | 112 | 0 |
| Mode M0 | |||
|---|---|---|---|
| Quadrant | BADHDUFLAG | Total packets | Discarded packets |
| A | 0 | 11859 | 3 |
| B | 0 | 13112 | 2 |
| C | 0 | 11916 | 2 |
| D | 0 | 13384 | 2 |
| Quadrant | Total seconds | Saturated seconds | Saturation percentage |
|---|---|---|---|
| A | 5555 | 17 | 0.306031% |
| B | 5555 | 79 | 1.422142% |
| C | 5555 | 37 | 0.666067% |
| D | 5555 | 45 | 0.810081% |
Noise dominated data is calculated using 1-second bins in cleaned event files. If a bin has >2000 counts, and if more than 50% of those come from <1% of pixels, then it is considered to be noise-dominated and hence unusable.
| Quadrant | # 1 sec bins | Bins with >0 counts | Bins with >2000 counts | High rate bins dominated by noise | Noise dominated (total time) | Noise dominated (detector-on time) | Marked lightcurve |
|---|---|---|---|---|---|---|---|
| A | 7198 | 5556 | 5 | 5 | 0.07% | 0.09% | 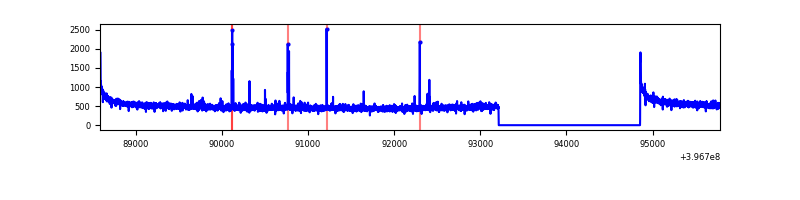 |
| B | 7198 | 5556 | 56 | 56 | 0.78% | 1.01% | 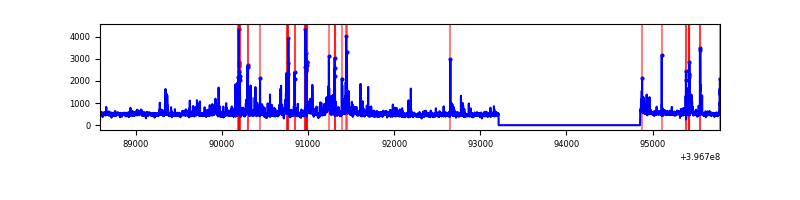 |
| C | 7198 | 5556 | 14 | 14 | 0.19% | 0.25% | 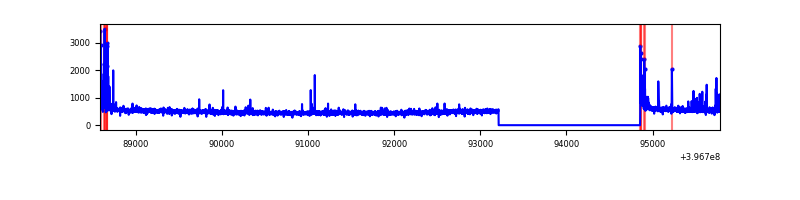 |
| D | 7198 | 5556 | 28 | 28 | 0.39% | 0.50% | 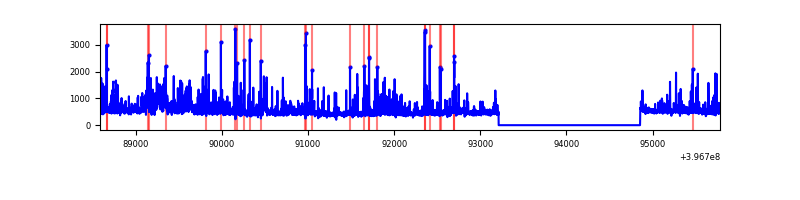 |
Top three noisy pixels from each quadrant. If the there are fewer than three noisy pixels in the level2.evt file, extra rows are filled as -1
| Pixel properties | Quadrant properties | ||||||
|---|---|---|---|---|---|---|---|
| Quadrant | DetID | PixID | Counts | Sigma | Mean | Median | Sigma |
| A | 10 | 83 | 239606 | 1818.08 | 649 | 636 | 131.4 |
| A | 15 | 174 | 31814 | 237.2 | 649 | 636 | 131.4 |
| A | 13 | 254 | 10607 | 75.86 | 649 | 636 | 131.4 |
| B | 0 | 229 | 177423 | 1427.97 | 639 | 623 | 123.8 |
| B | 5 | 172 | 137761 | 1107.63 | 639 | 623 | 123.8 |
| B | 0 | 190 | 121490 | 976.22 | 639 | 623 | 123.8 |
| C | 15 | 214 | 241644 | 1653.45 | 626 | 631 | 145.8 |
| C | 0 | 10 | 131511 | 897.89 | 626 | 631 | 145.8 |
| C | 14 | 254 | 42559 | 287.64 | 626 | 631 | 145.8 |
| D | 2 | 153 | 145680 | 945.21 | 627 | 609 | 153.5 |
| D | 2 | 250 | 144141 | 935.19 | 627 | 609 | 153.5 |
| D | 2 | 249 | 120941 | 784.03 | 627 | 609 | 153.5 |
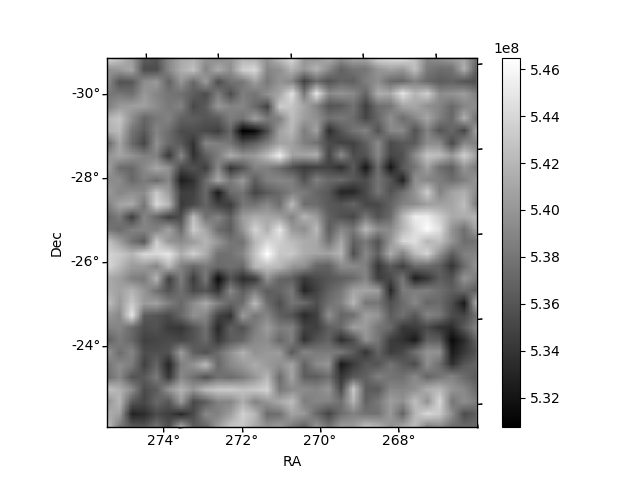
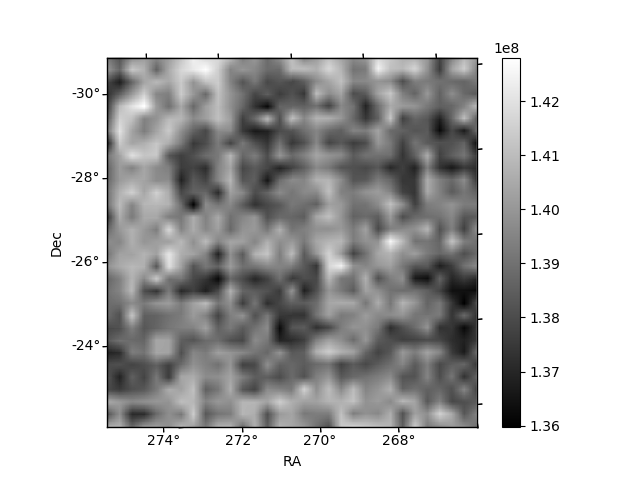
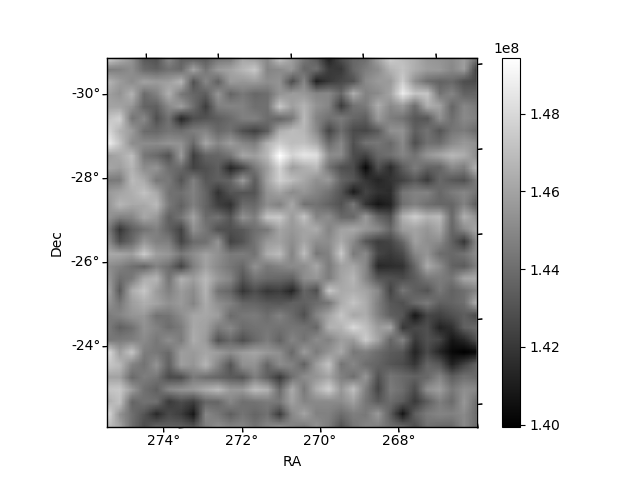
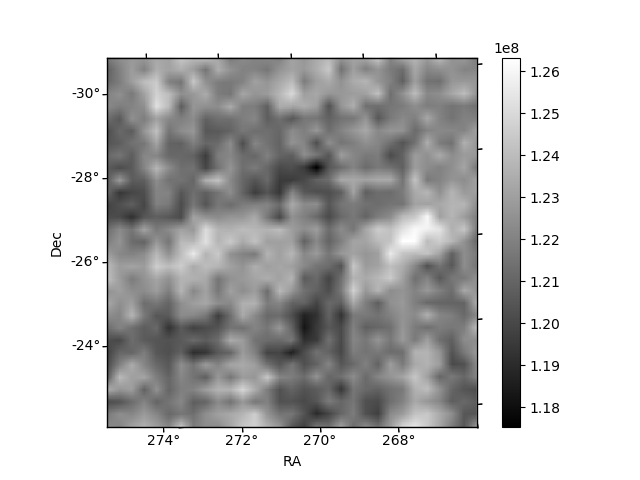
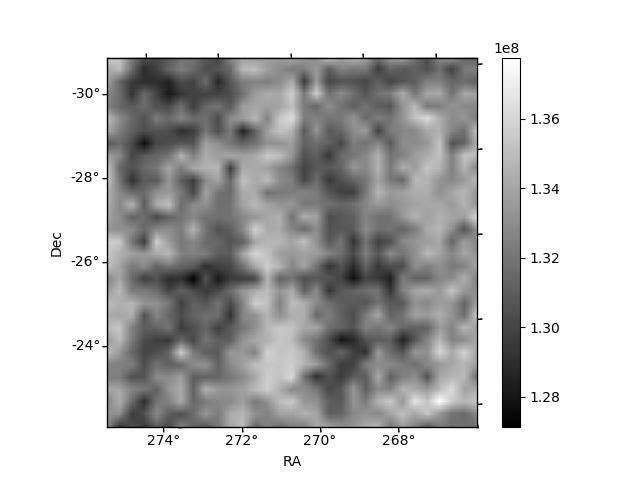
Histogram calculated using DETX and DETY for each event in the final _common_clean file
| Quadrant A | 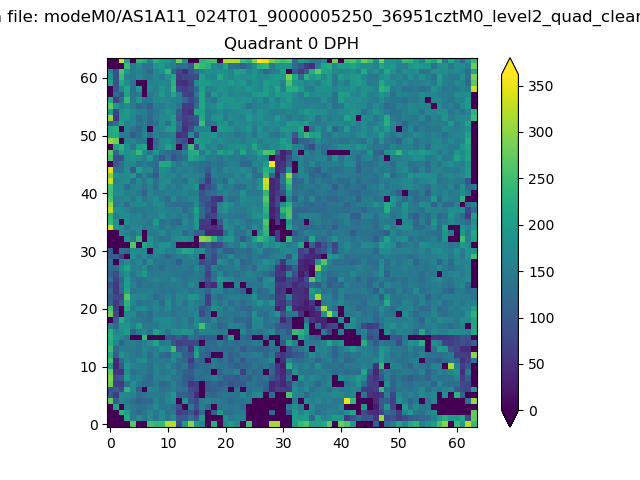 |
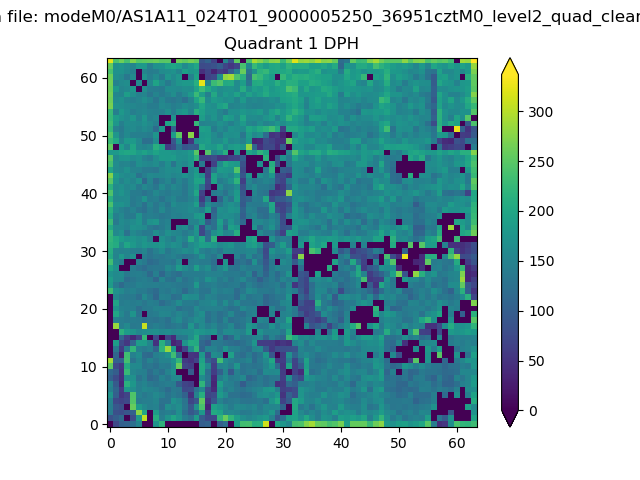 |
Quadrant B |
|---|---|---|---|
| Quadrant D | 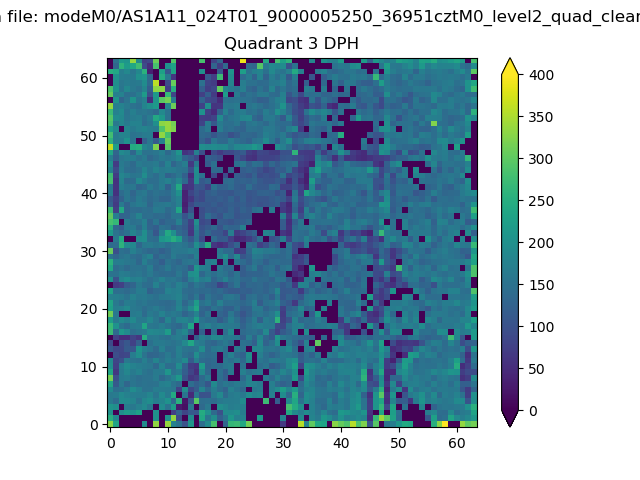 |
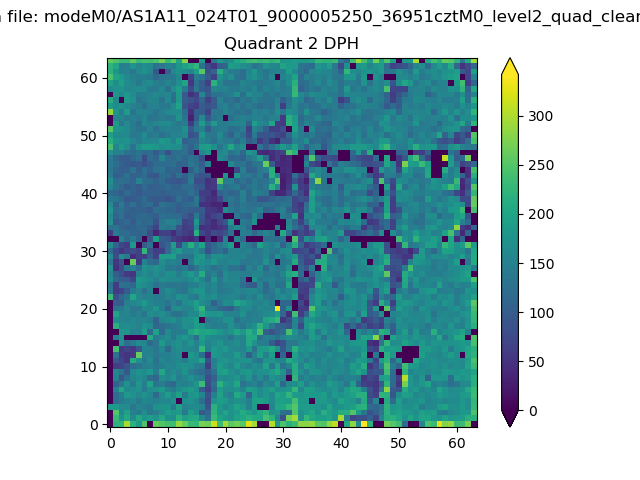 |
Quadrant C |
| Plot type | Count rate plots | Images |
|---|---|---|
| Comparison with Poisson distribution Blue bars denote a histogram of data divided into 1 sec bins. Red curve is a Poisson curve with rate = median count rate of data. |
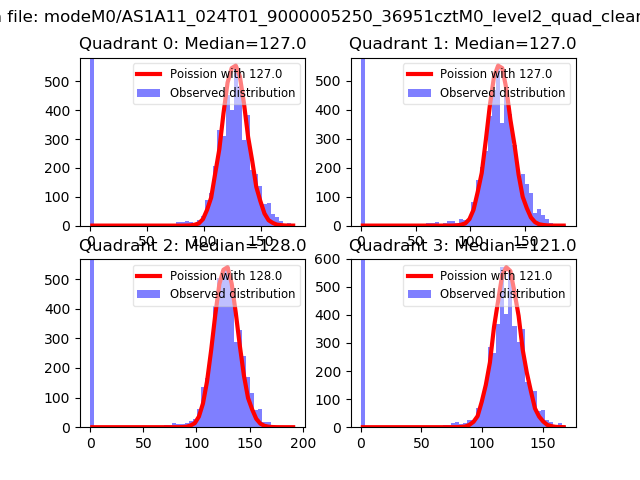 |
 |
| Quadrant-wise count rates Data is divided into 100 sec bins |
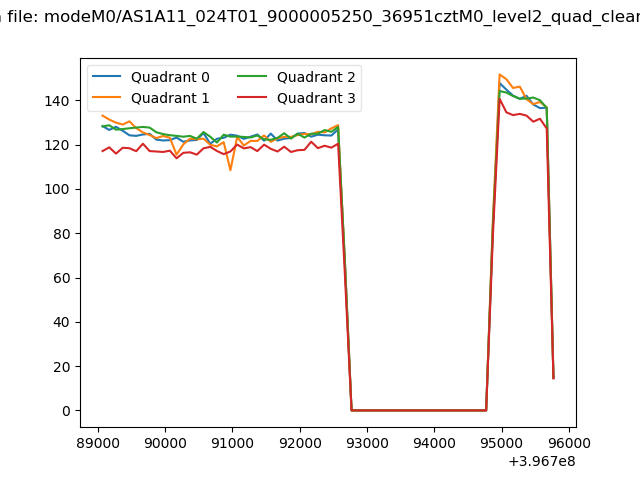 |
|
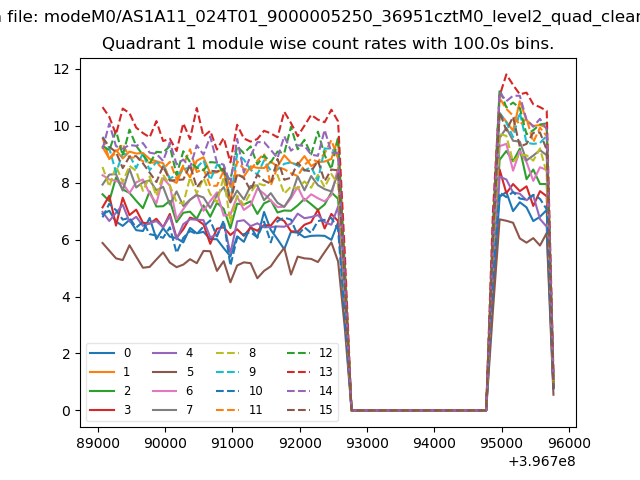
| Module-wise count rates for Quadrant A Data is divided into 100 sec bins |
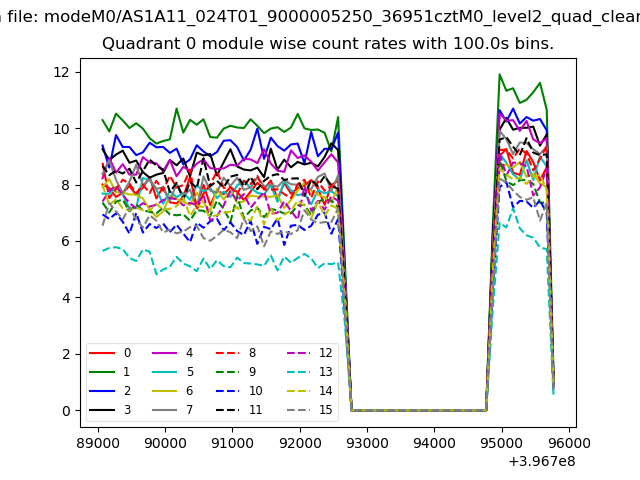 |
 |
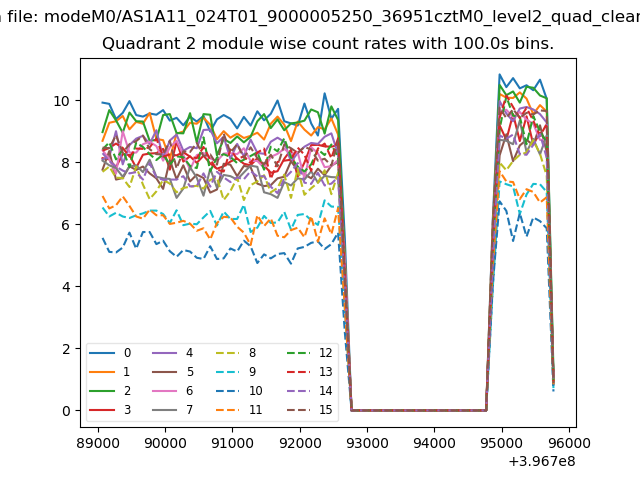
| Module-wise count rates for Quadrant B Data is divided into 100 sec bins |
 |
 |
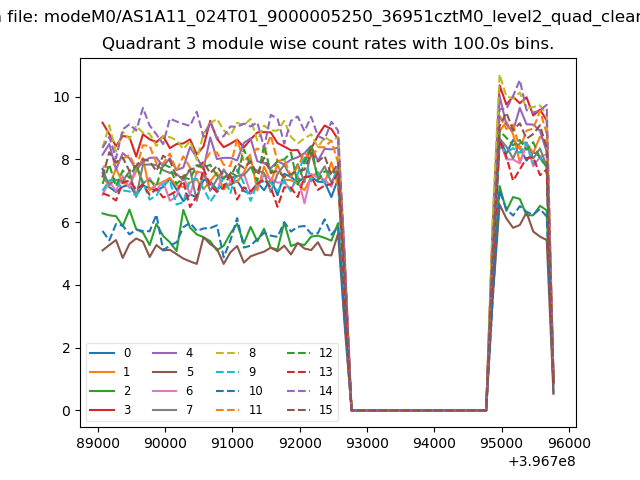
| Module-wise count rates for Quadrant C Data is divided into 100 sec bins |
 |
 |
| Module-wise count rates for Quadrant D Data is divided into 100 sec bins |
 |
 |
| Parameter | Plot |
|---|---|
| CZT HV Monitor | 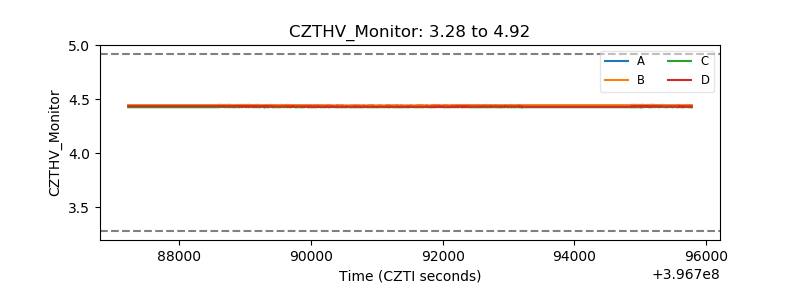 |
| D_VDD | 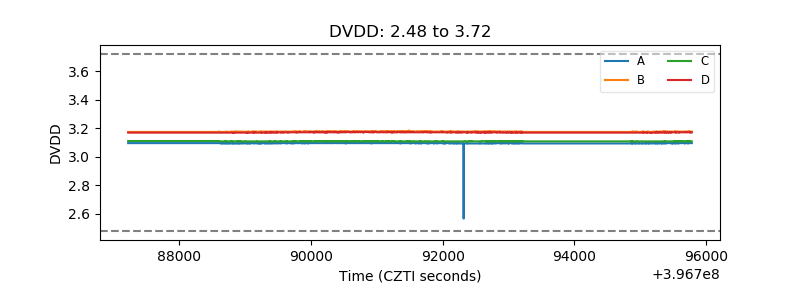 |
| Temperature 1 | 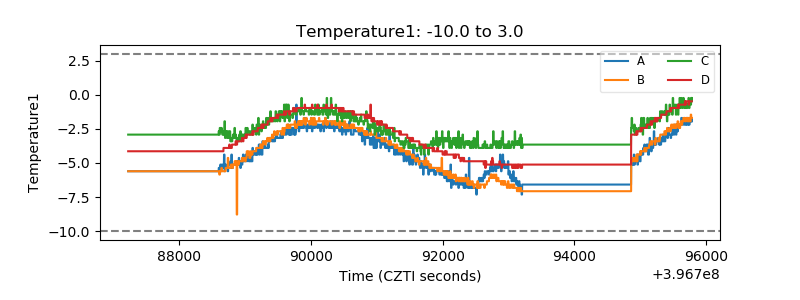 |
| Veto HV Monitor | 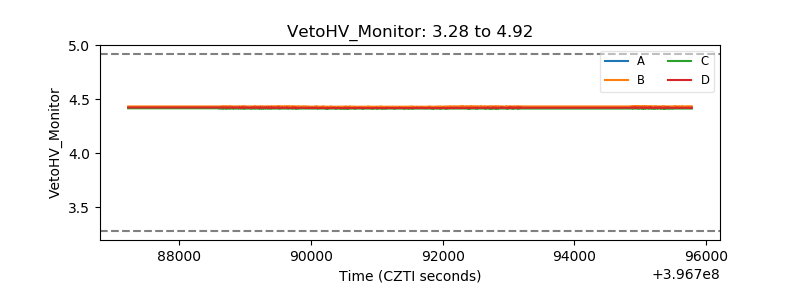 |
| Veto LLD | 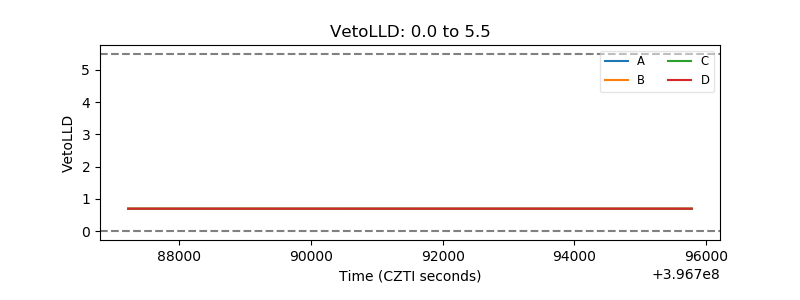 |
| Alpha Counter |  |
| _CPM_Rate | 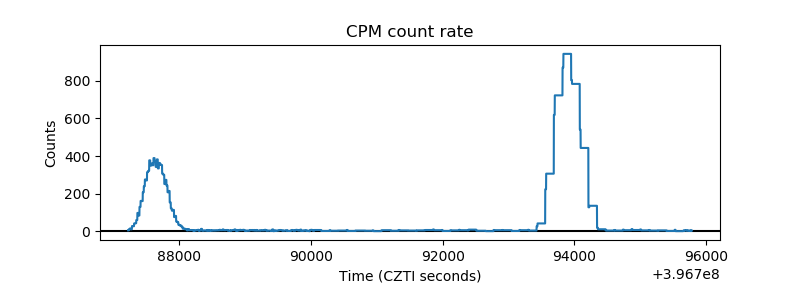 |
| CZT Counter | 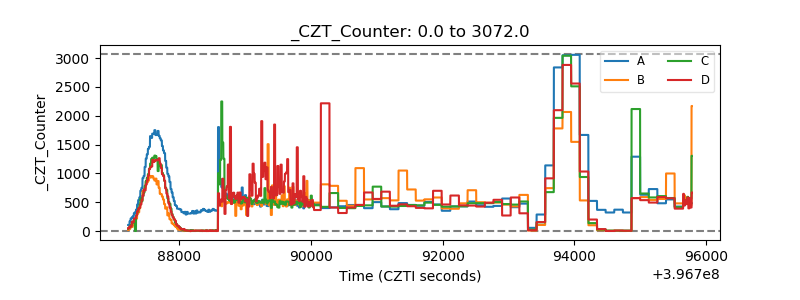 |
| +2.5 Volts monitor | 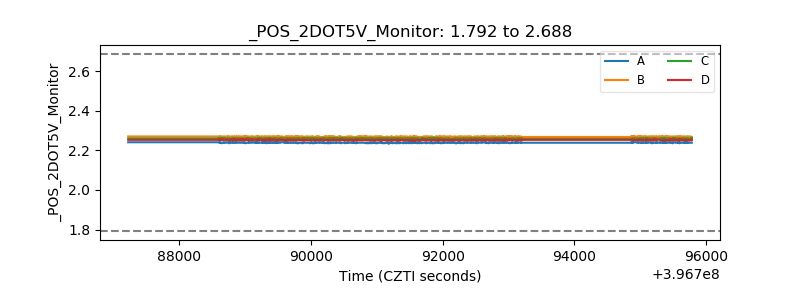 |
| +5 Volts monitor | 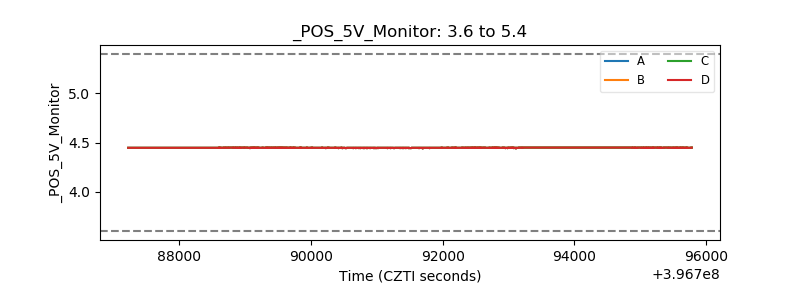 |
| _ROLL_ROT | 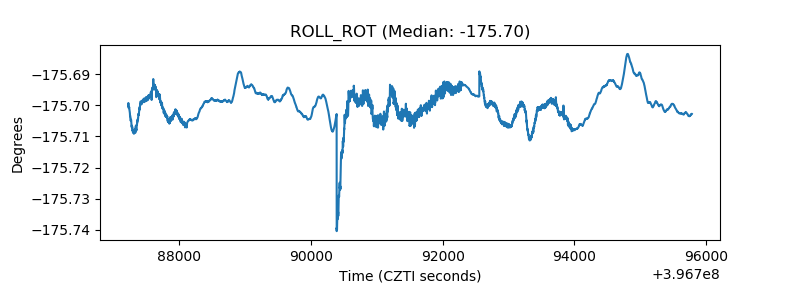 |
| _Roll_DEC | 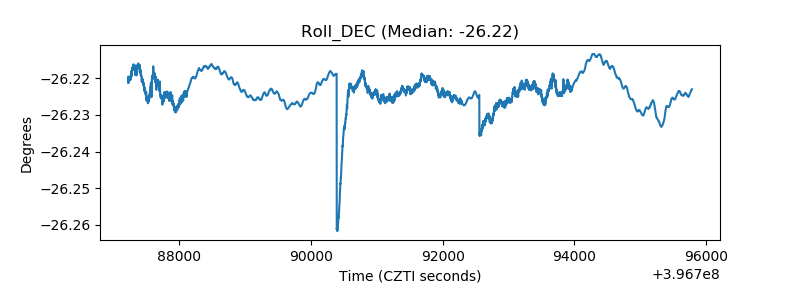 |
| _Roll_RA | 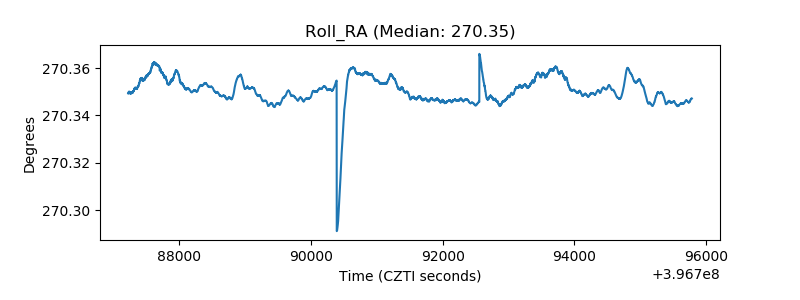 |
| Veto Counter | 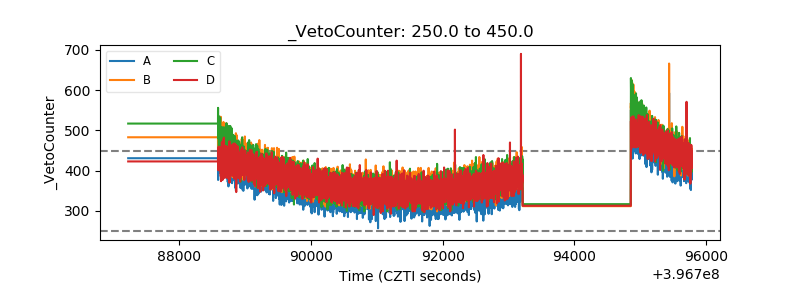 |