| Param | Original file | Final file |
|---|---|---|
| Filename | modeM0/AS1A11_024T01_9000005250_36955cztM0_level2.evt | modeM0/AS1A11_024T01_9000005250_36955cztM0_level2_quad_clean.evt |
| Size (bytes) | 303,096,960 | 64,212,480 |
| Size | 289.1 MB | 61.2 MB |
| Events in quadrant A | 1,949,869 | 425,289 |
| Events in quadrant B | 2,148,528 | 422,697 |
| Events in quadrant C | 2,180,087 | 421,335 |
| Events in quadrant D | 2,628,921 | 393,919 |
| Mode M9 | |||
|---|---|---|---|
| Quadrant | BADHDUFLAG | Total packets | Discarded packets |
| A | 0 | 18 | 0 |
| B | 0 | 18 | 0 |
| C | 0 | 18 | 0 |
| D | 0 | 18 | 0 |
| Mode SS | |||
|---|---|---|---|
| Quadrant | BADHDUFLAG | Total packets | Discarded packets |
| A | 0 | 82 | 0 |
| B | 0 | 82 | 0 |
| C | 0 | 82 | 0 |
| D | 0 | 82 | 0 |
| Mode M0 | |||
|---|---|---|---|
| Quadrant | BADHDUFLAG | Total packets | Discarded packets |
| A | 0 | 8424 | 1 |
| B | 0 | 8994 | 1 |
| C | 0 | 9012 | 1 |
| D | 0 | 10554 | 1 |
| Quadrant | Total seconds | Saturated seconds | Saturation percentage |
|---|---|---|---|
| A | 3982 | 11 | 0.276243% |
| B | 3982 | 49 | 1.230537% |
| C | 3982 | 33 | 0.828729% |
| D | 3982 | 170 | 4.269211% |
Noise dominated data is calculated using 1-second bins in cleaned event files. If a bin has >2000 counts, and if more than 50% of those come from <1% of pixels, then it is considered to be noise-dominated and hence unusable.
| Quadrant | # 1 sec bins | Bins with >0 counts | Bins with >2000 counts | High rate bins dominated by noise | Noise dominated (total time) | Noise dominated (detector-on time) | Marked lightcurve |
|---|---|---|---|---|---|---|---|
| A | 5775 | 3983 | 7 | 7 | 0.12% | 0.18% |  |
| B | 5775 | 3983 | 35 | 35 | 0.61% | 0.88% | 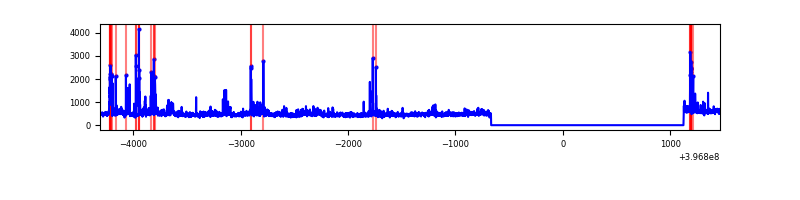 |
| C | 5775 | 3983 | 22 | 22 | 0.38% | 0.55% | 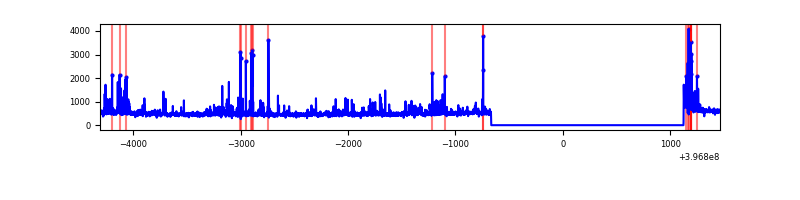 |
| D | 5775 | 3983 | 137 | 137 | 2.37% | 3.44% | 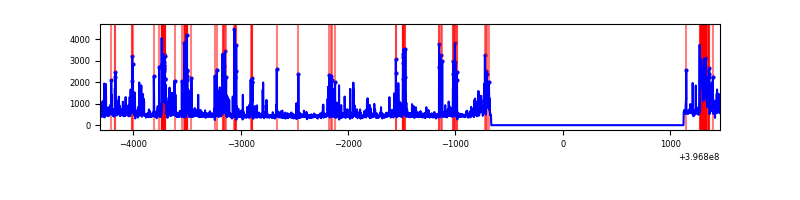 |
Top three noisy pixels from each quadrant. If the there are fewer than three noisy pixels in the level2.evt file, extra rows are filled as -1
| Pixel properties | Quadrant properties | ||||||
|---|---|---|---|---|---|---|---|
| Quadrant | DetID | PixID | Counts | Sigma | Mean | Median | Sigma |
| A | 10 | 83 | 143336 | 1515.69 | 458 | 450 | 94.3 |
| A | 15 | 174 | 24196 | 251.89 | 458 | 450 | 94.3 |
| A | 13 | 6 | 11033 | 112.26 | 458 | 450 | 94.3 |
| B | 0 | 229 | 101793 | 1163.23 | 451 | 440 | 87.1 |
| B | 5 | 255 | 73150 | 834.5 | 451 | 440 | 87.1 |
| B | 5 | 172 | 61319 | 698.71 | 451 | 440 | 87.1 |
| C | 14 | 254 | 202101 | 1956.28 | 440 | 445 | 103.1 |
| C | 15 | 214 | 168742 | 1632.66 | 440 | 445 | 103.1 |
| C | 0 | 10 | 91750 | 885.76 | 440 | 445 | 103.1 |
| D | 12 | 233 | 221557 | 2035.08 | 436 | 423 | 108.7 |
| D | 2 | 153 | 152213 | 1396.91 | 436 | 423 | 108.7 |
| D | 2 | 249 | 102239 | 937.0 | 436 | 423 | 108.7 |
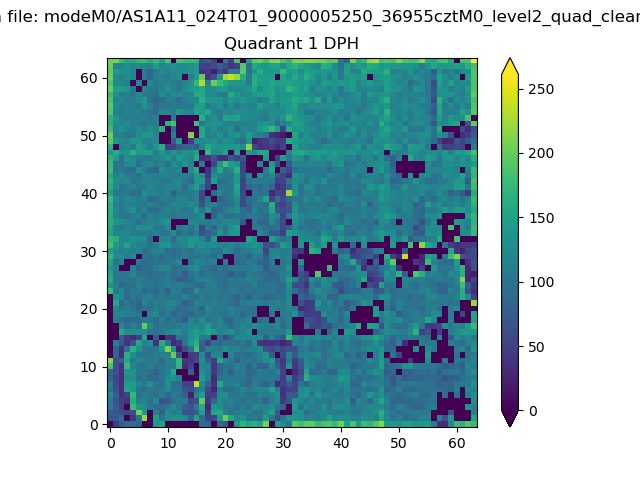
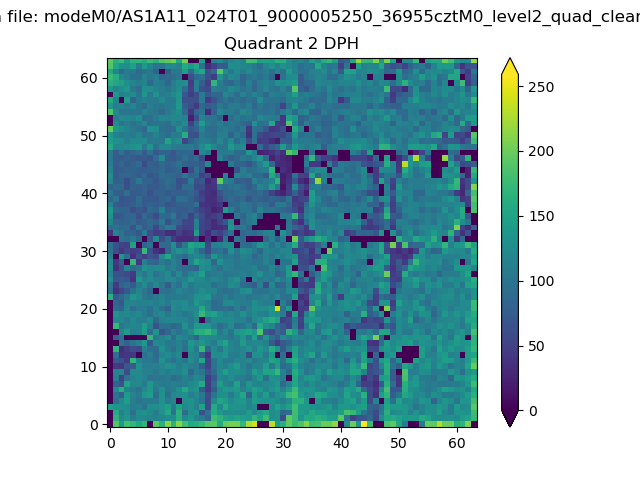
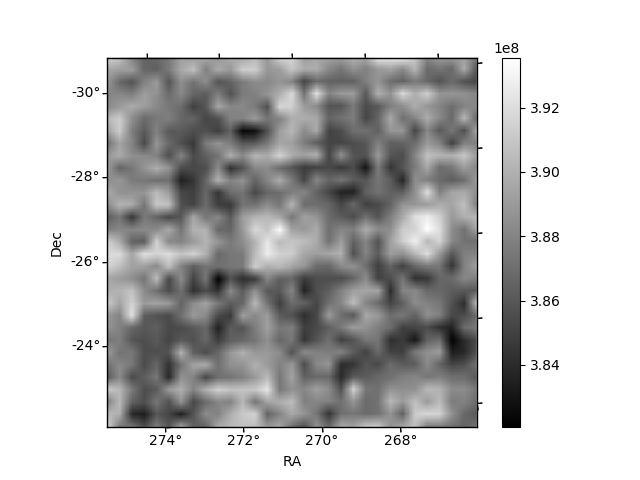
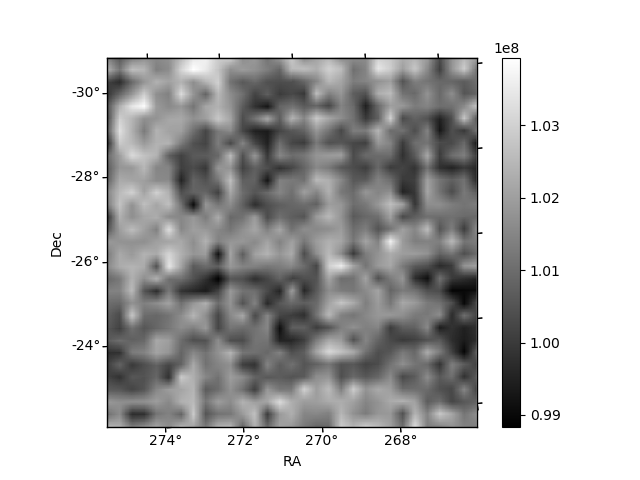
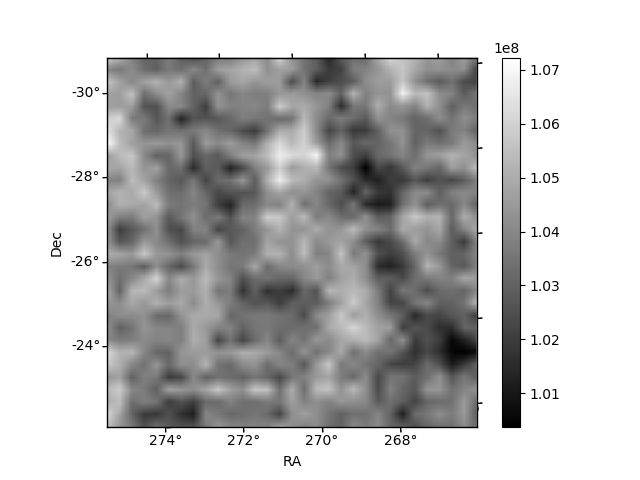
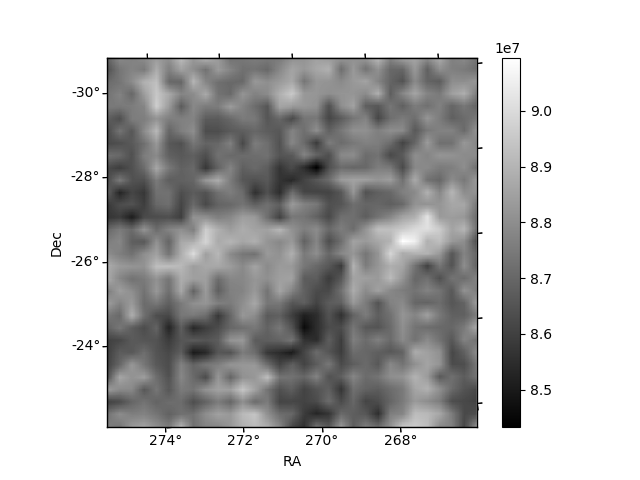
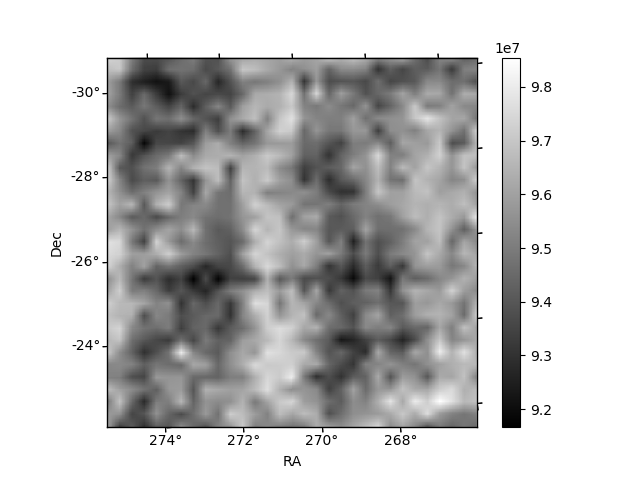
Histogram calculated using DETX and DETY for each event in the final _common_clean file
| Quadrant A | 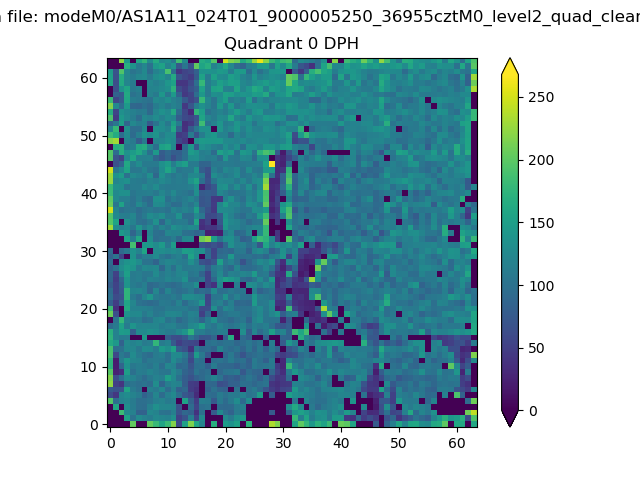 |
 |
Quadrant B |
|---|---|---|---|
| Quadrant D | 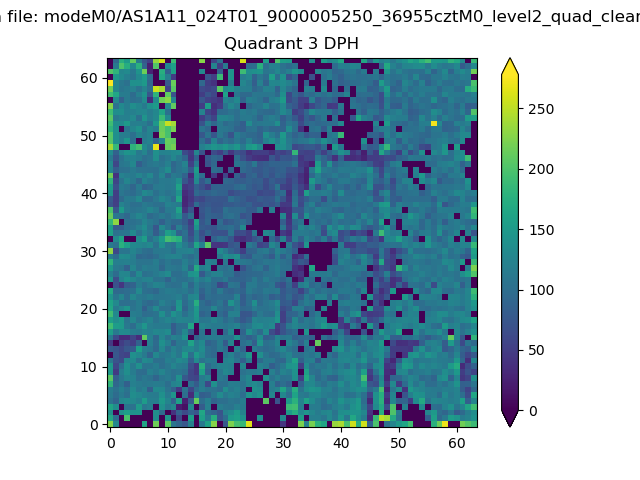 |
 |
Quadrant C |
| Plot type | Count rate plots | Images |
|---|---|---|
| Comparison with Poisson distribution Blue bars denote a histogram of data divided into 1 sec bins. Red curve is a Poisson curve with rate = median count rate of data. |
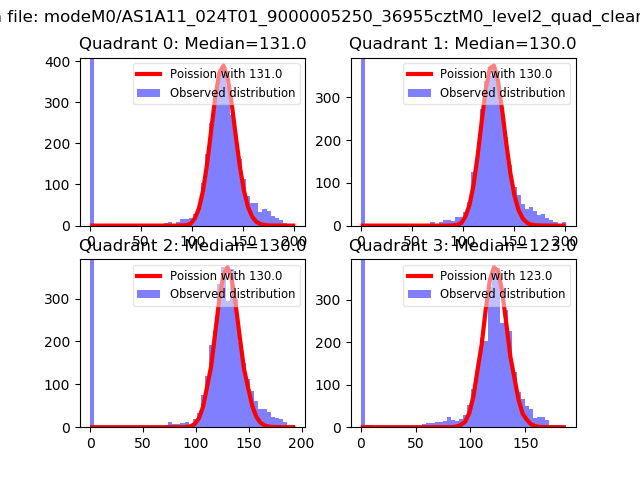 |
 |
| Quadrant-wise count rates Data is divided into 100 sec bins |
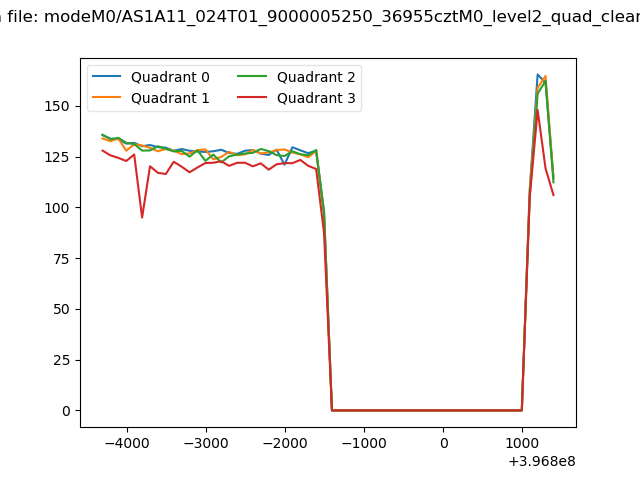 |
|
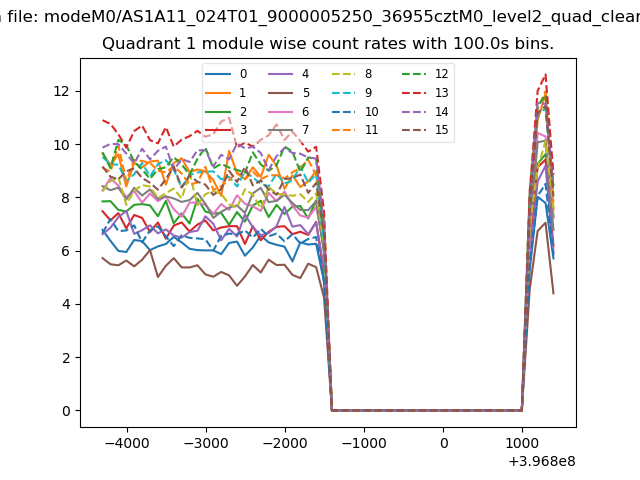
| Module-wise count rates for Quadrant A Data is divided into 100 sec bins |
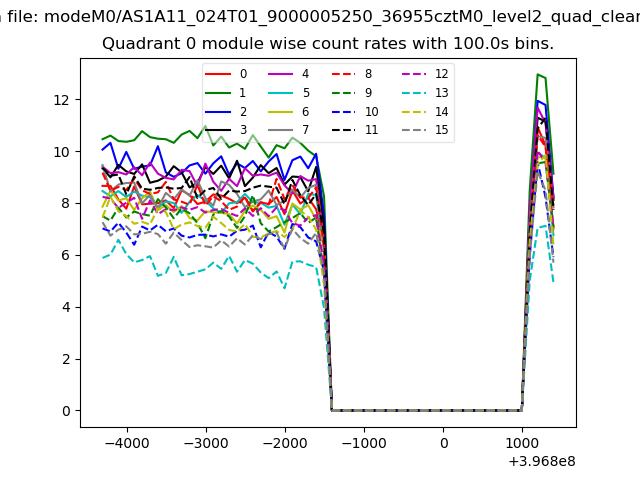 |
 |
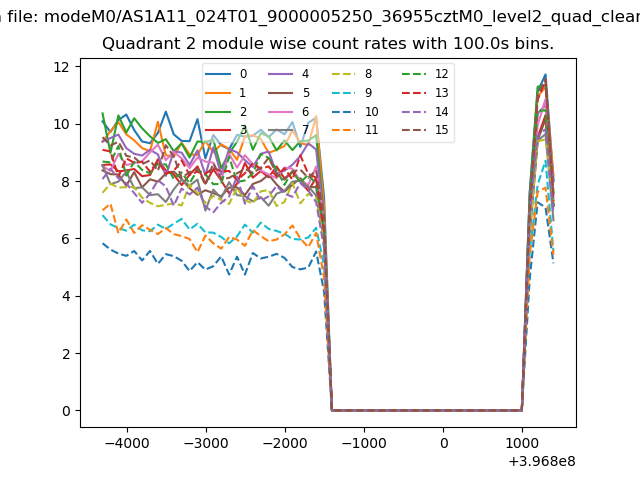
| Module-wise count rates for Quadrant B Data is divided into 100 sec bins |
 |
 |
| Module-wise count rates for Quadrant C Data is divided into 100 sec bins |
 |
 |
| Module-wise count rates for Quadrant D Data is divided into 100 sec bins |
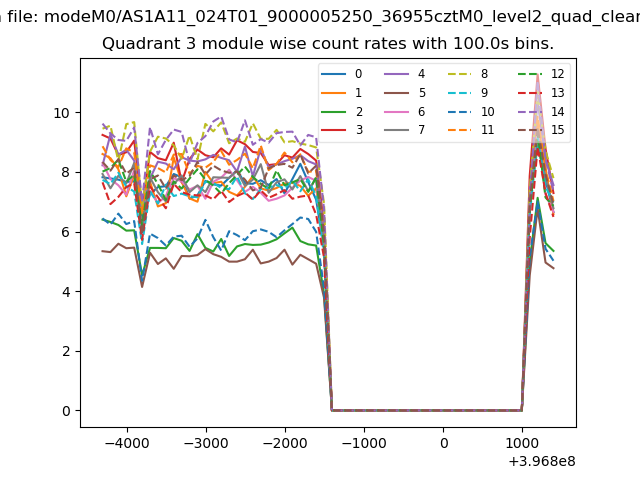 |
 |
| Parameter | Plot |
|---|---|
| CZT HV Monitor | 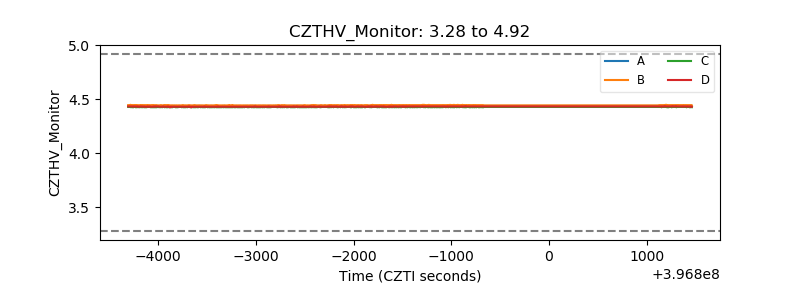 |
| D_VDD | 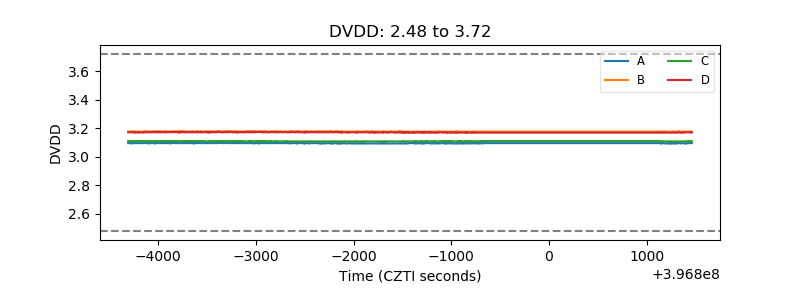 |
| Temperature 1 | 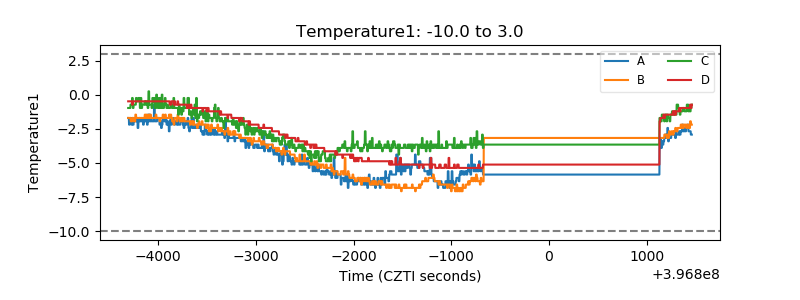 |
| Veto HV Monitor | 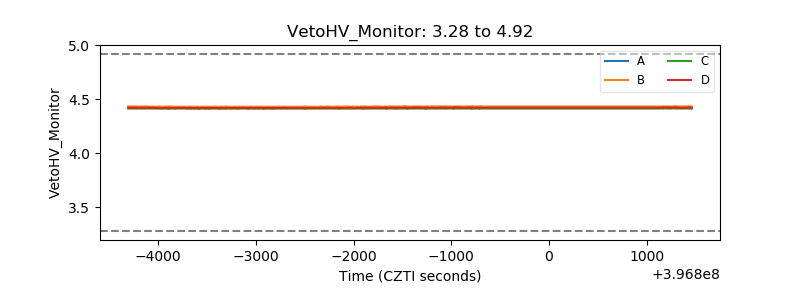 |
| Veto LLD | 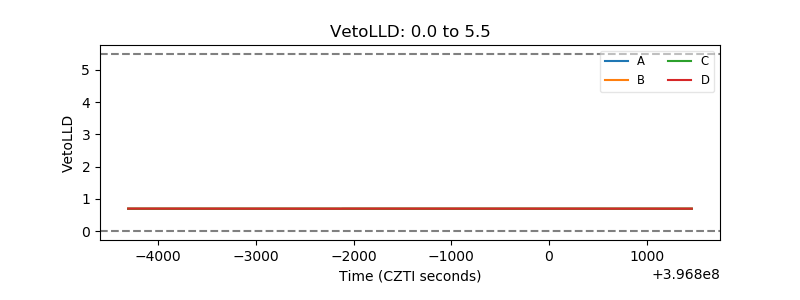 |
| Alpha Counter |  |
| _CPM_Rate | 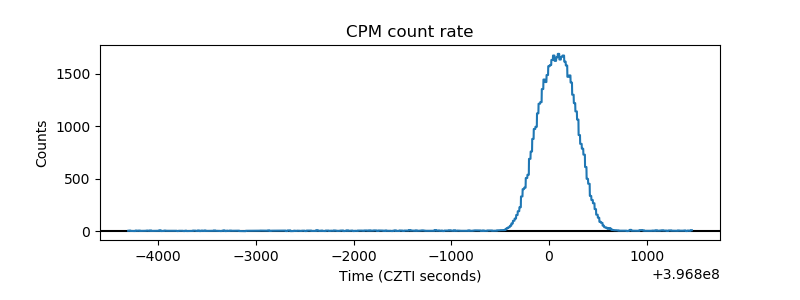 |
| CZT Counter | 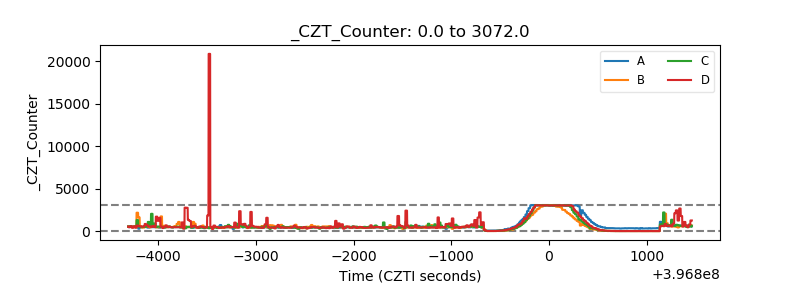 |
| +2.5 Volts monitor | 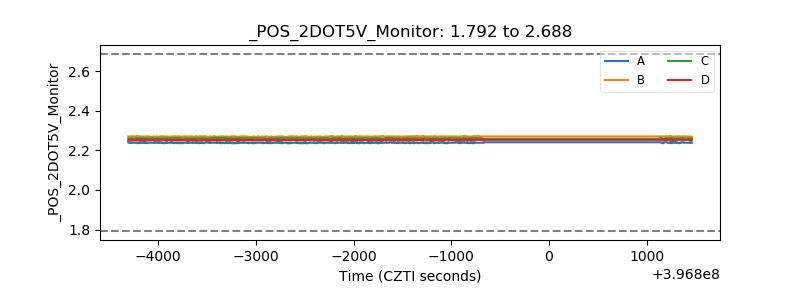 |
| +5 Volts monitor | 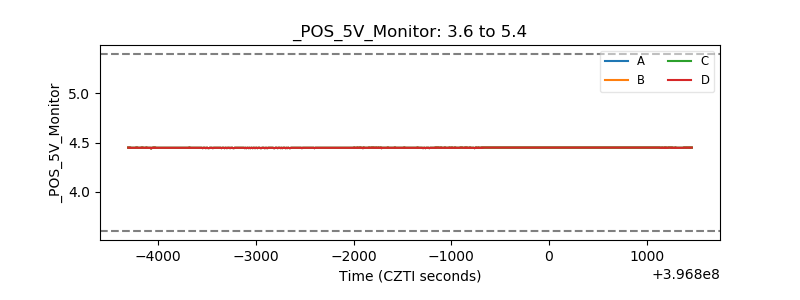 |
| _ROLL_ROT | 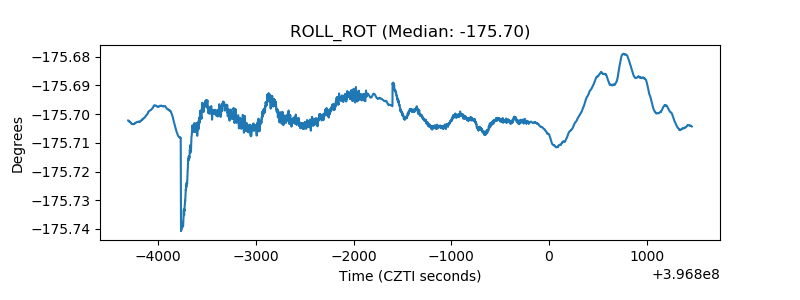 |
| _Roll_DEC | 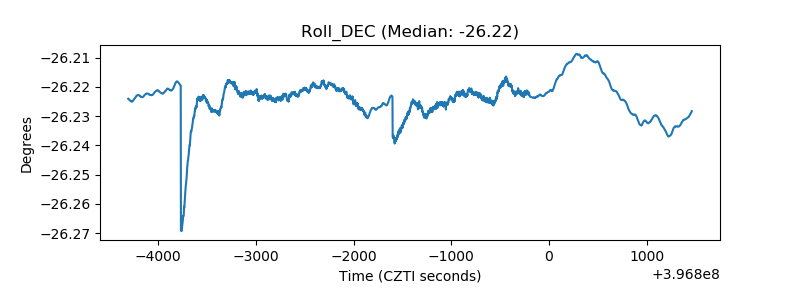 |
| _Roll_RA | 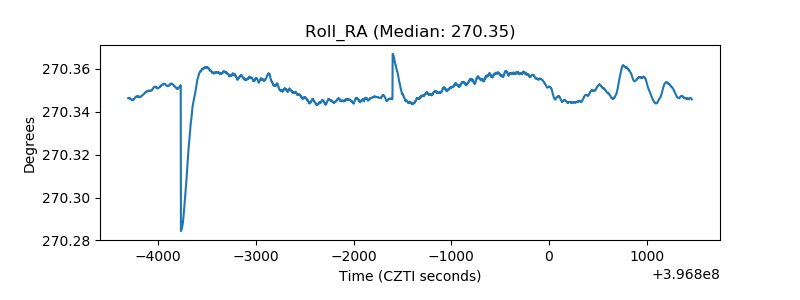 |
| Veto Counter | 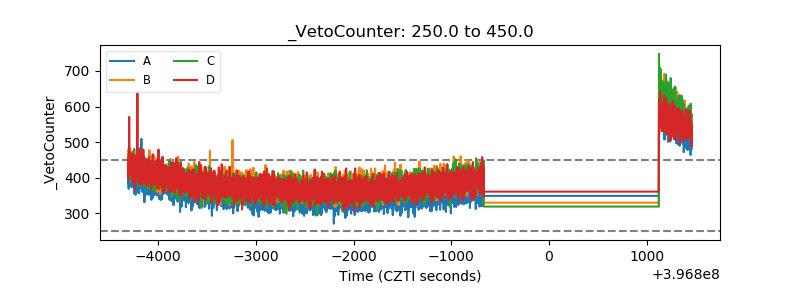 |