| Param | Original file | Final file |
|---|---|---|
| Filename | modeM0/AS1C07_001T10_9000005252_36954cztM0_level2.evt | modeM0/AS1C07_001T10_9000005252_36954cztM0_level2_quad_clean.evt |
| Size (bytes) | 338,601,600 | 66,041,280 |
| Size | 322.9 MB | 63.0 MB |
| Events in quadrant A | 2,594,160 | 443,013 |
| Events in quadrant B | 2,910,797 | 420,340 |
| Events in quadrant C | 2,019,159 | 441,174 |
| Events in quadrant D | 2,473,733 | 428,633 |
| Mode M0 | |||
|---|---|---|---|
| Quadrant | BADHDUFLAG | Total packets | Discarded packets |
| A | 0 | 10206 | 2 |
| B | 0 | 11145 | 1 |
| C | 0 | 8380 | 1 |
| D | 0 | 10010 | 1 |
| Mode SS | |||
|---|---|---|---|
| Quadrant | BADHDUFLAG | Total packets | Discarded packets |
| A | 0 | 78 | 0 |
| B | 0 | 78 | 0 |
| C | 0 | 78 | 0 |
| D | 0 | 78 | 0 |
| Mode M9 | |||
|---|---|---|---|
| Quadrant | BADHDUFLAG | Total packets | Discarded packets |
| A | 0 | 19 | 0 |
| B | 0 | 19 | 0 |
| C | 0 | 19 | 0 |
| D | 0 | 19 | 0 |
| Quadrant | Total seconds | Saturated seconds | Saturation percentage |
|---|---|---|---|
| A | 3766 | 162 | 4.301646% |
| B | 3766 | 339 | 9.001593% |
| C | 3766 | 55 | 1.460435% |
| D | 3766 | 127 | 3.372278% |
Noise dominated data is calculated using 1-second bins in cleaned event files. If a bin has >2000 counts, and if more than 50% of those come from <1% of pixels, then it is considered to be noise-dominated and hence unusable.
| Quadrant | # 1 sec bins | Bins with >0 counts | Bins with >2000 counts | High rate bins dominated by noise | Noise dominated (total time) | Noise dominated (detector-on time) | Marked lightcurve |
|---|---|---|---|---|---|---|---|
| A | 5679 | 3767 | 142 | 142 | 2.50% | 3.77% | 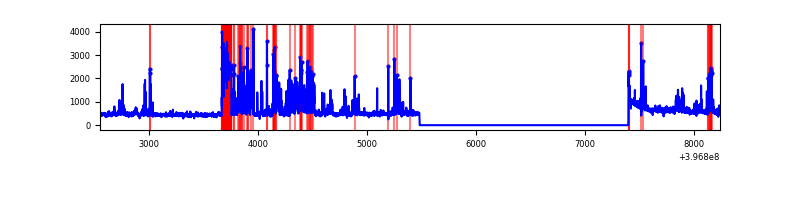 |
| B | 5678 | 3766 | 258 | 258 | 4.54% | 6.85% | 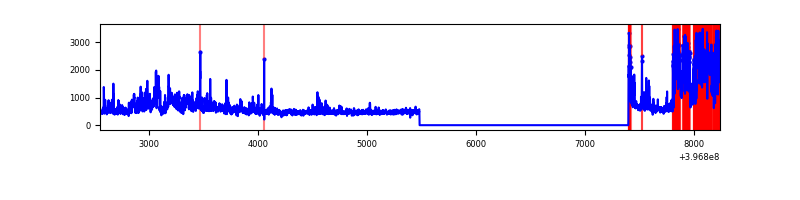 |
| C | 5679 | 3767 | 36 | 36 | 0.63% | 0.96% | 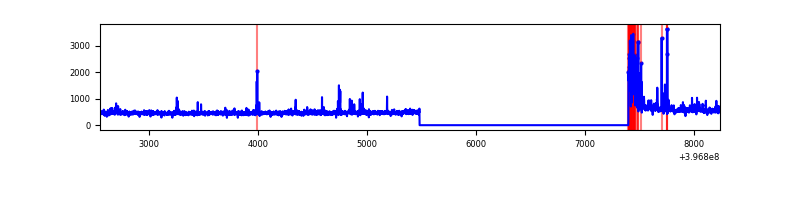 |
| D | 5679 | 3767 | 92 | 92 | 1.62% | 2.44% | 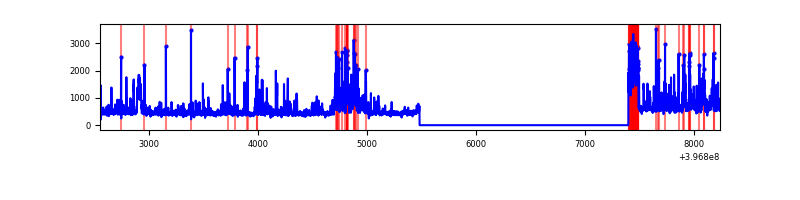 |
Top three noisy pixels from each quadrant. If the there are fewer than three noisy pixels in the level2.evt file, extra rows are filled as -1
| Pixel properties | Quadrant properties | ||||||
|---|---|---|---|---|---|---|---|
| Quadrant | DetID | PixID | Counts | Sigma | Mean | Median | Sigma |
| A | 0 | 247 | 604661 | 7077.6 | 425 | 418 | 85.4 |
| A | 10 | 83 | 151029 | 1764.13 | 425 | 418 | 85.4 |
| A | 15 | 237 | 70747 | 823.78 | 425 | 418 | 85.4 |
| B | 5 | 172 | 788343 | 10159.12 | 412 | 401 | 77.6 |
| B | 5 | 184 | 250396 | 3223.24 | 412 | 401 | 77.6 |
| B | 0 | 219 | 76731 | 984.13 | 412 | 401 | 77.6 |
| C | 15 | 214 | 159137 | 1638.13 | 420 | 423 | 96.9 |
| C | 0 | 10 | 155221 | 1597.72 | 420 | 423 | 96.9 |
| C | 14 | 254 | 37822 | 386.01 | 420 | 423 | 96.9 |
| D | 12 | 17 | 209603 | 2040.62 | 421 | 408 | 102.5 |
| D | 12 | 233 | 153600 | 1494.33 | 421 | 408 | 102.5 |
| D | 13 | 171 | 148910 | 1448.59 | 421 | 408 | 102.5 |
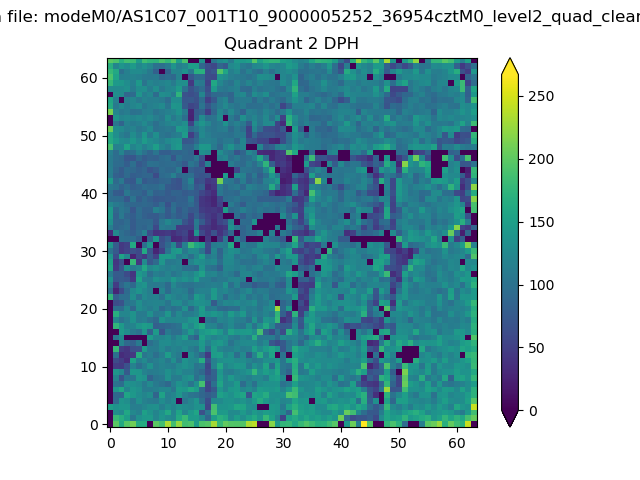
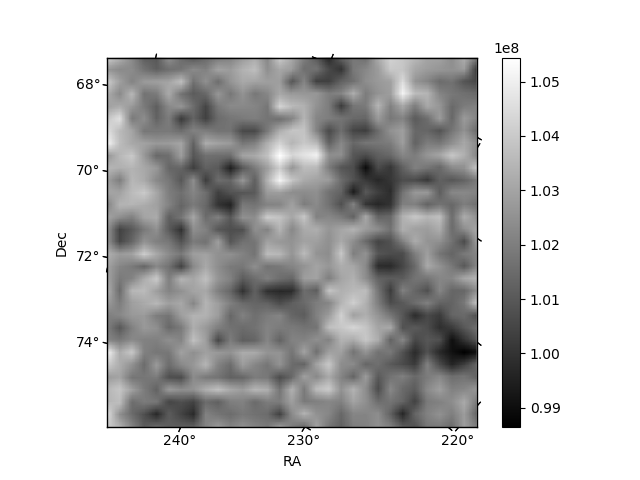
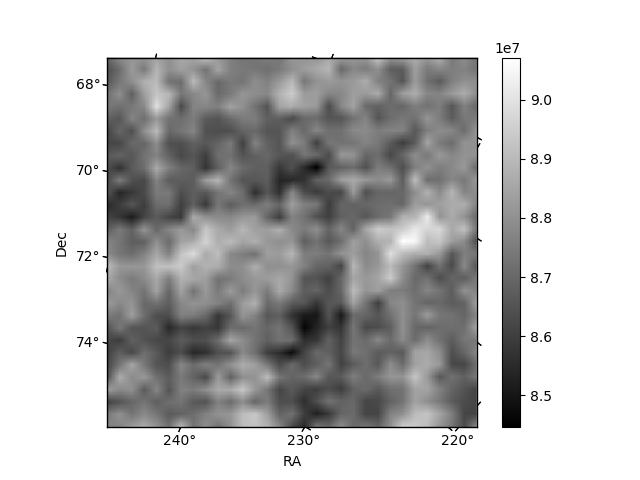
Histogram calculated using DETX and DETY for each event in the final _common_clean file
| Quadrant A | 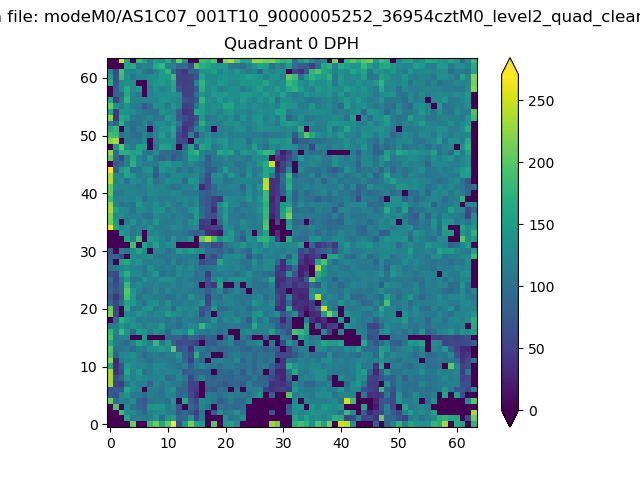 |
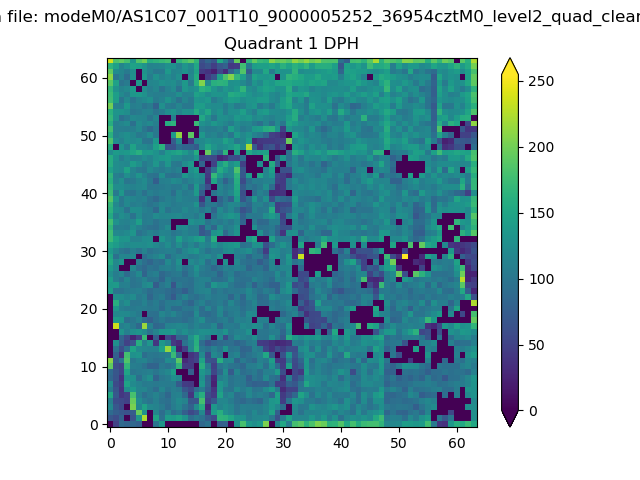 |
Quadrant B |
|---|---|---|---|
| Quadrant D | 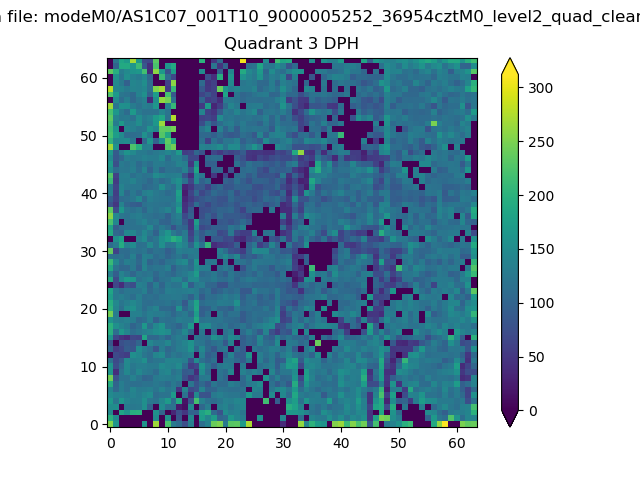 |
 |
Quadrant C |
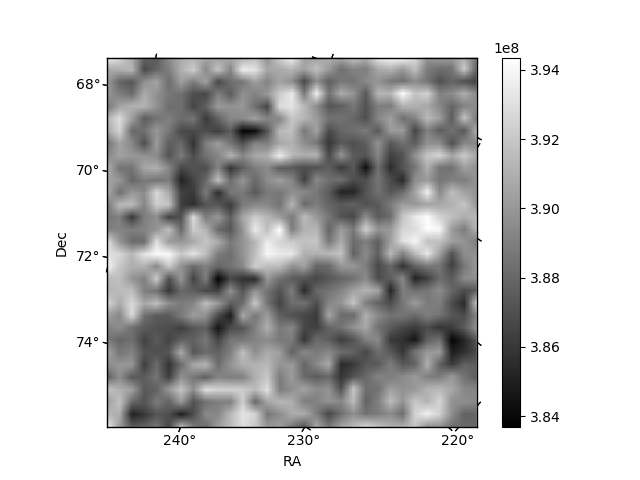
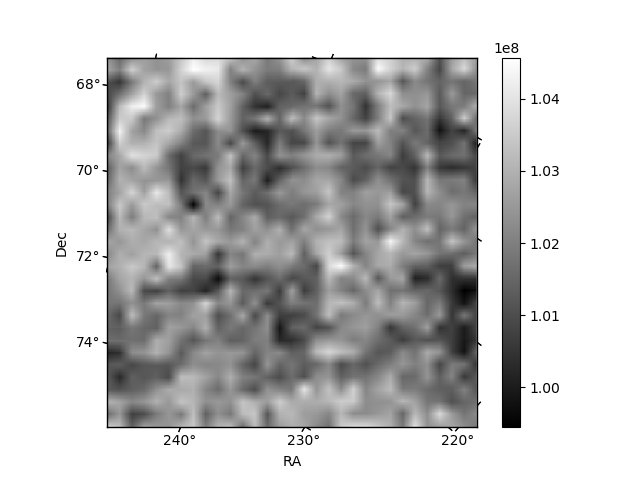
| Plot type | Count rate plots | Images |
|---|---|---|
| Comparison with Poisson distribution Blue bars denote a histogram of data divided into 1 sec bins. Red curve is a Poisson curve with rate = median count rate of data. |
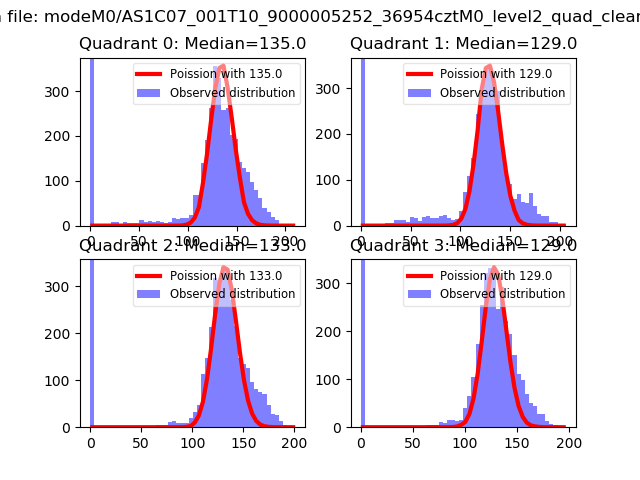 |
 |
| Quadrant-wise count rates Data is divided into 100 sec bins |
 |
|
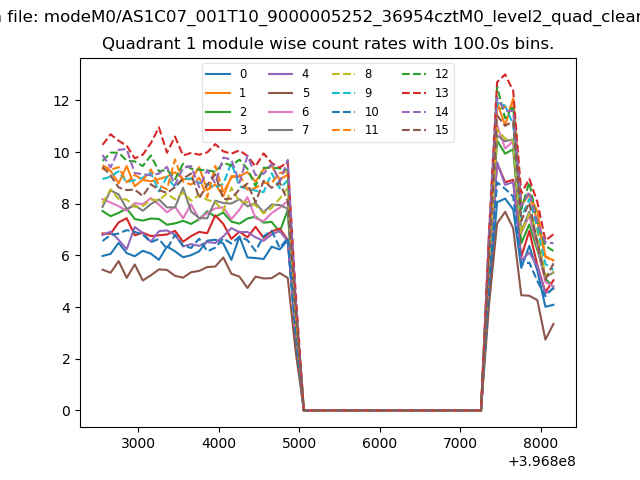
| Module-wise count rates for Quadrant A Data is divided into 100 sec bins |
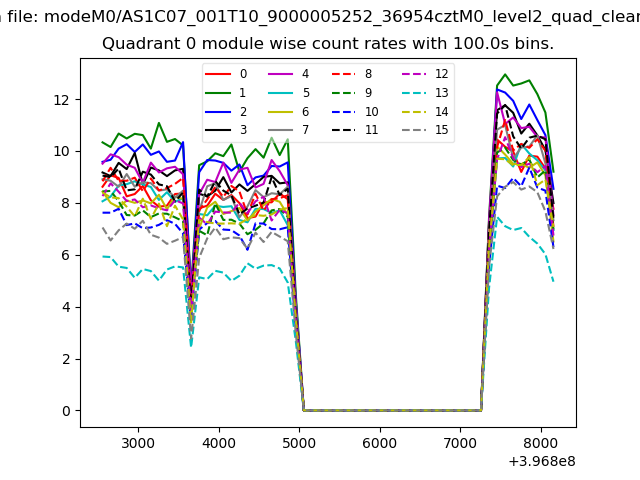 |
 |
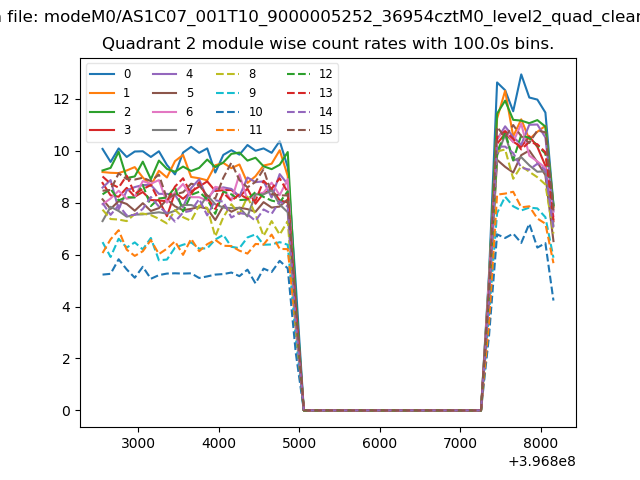
| Module-wise count rates for Quadrant B Data is divided into 100 sec bins |
 |
 |
| Module-wise count rates for Quadrant C Data is divided into 100 sec bins |
 |
 |
| Module-wise count rates for Quadrant D Data is divided into 100 sec bins |
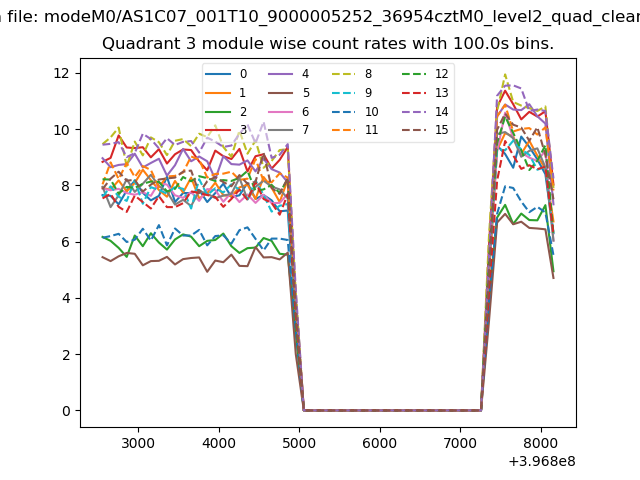 |
 |
| Parameter | Plot |
|---|---|
| CZT HV Monitor | 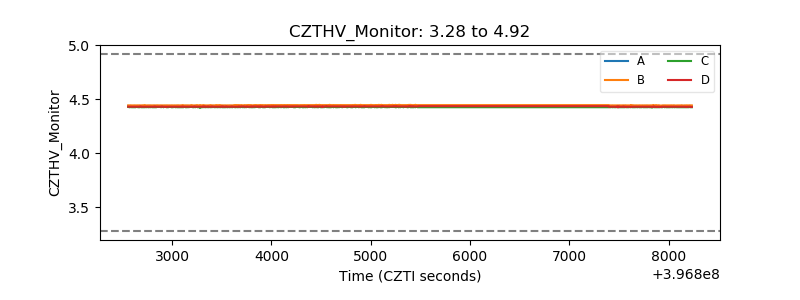 |
| D_VDD | 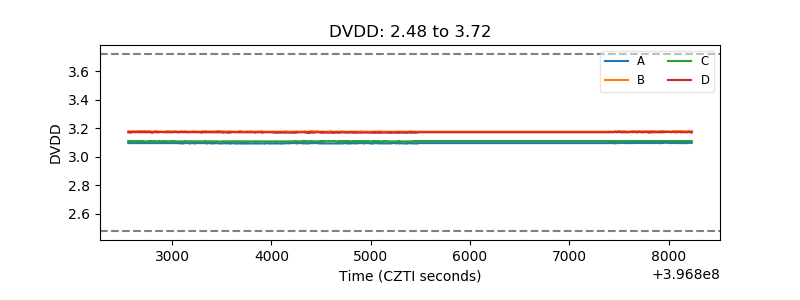 |
| Temperature 1 | 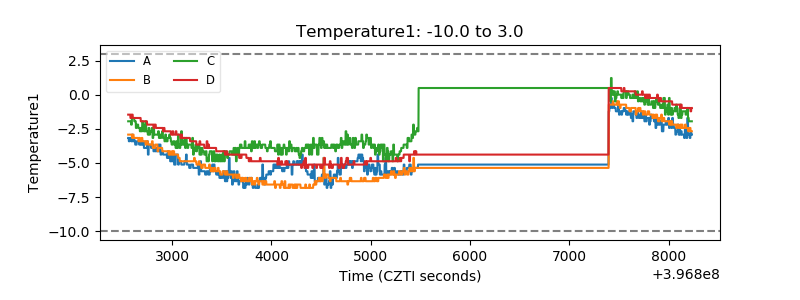 |
| Veto HV Monitor | 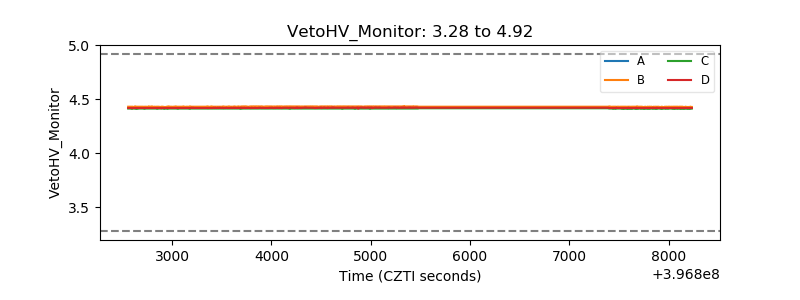 |
| Veto LLD | 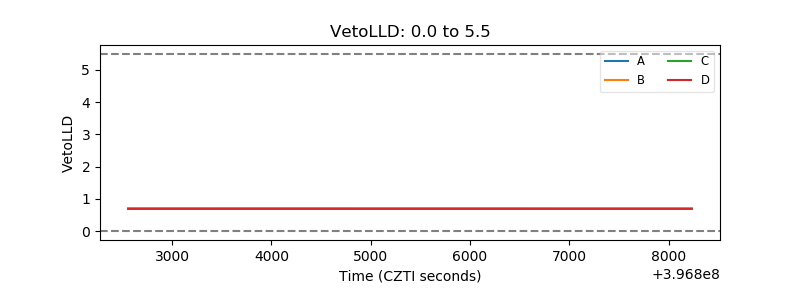 |
| Alpha Counter | 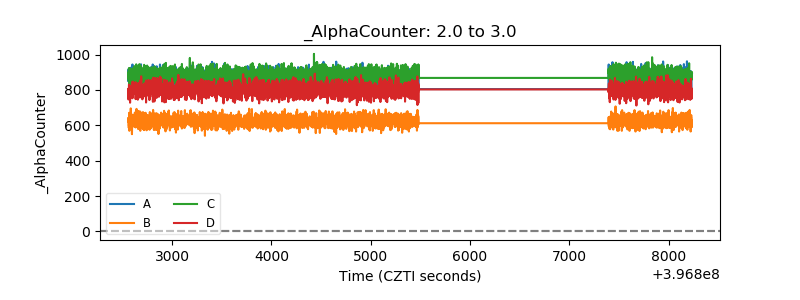 |
| _CPM_Rate | 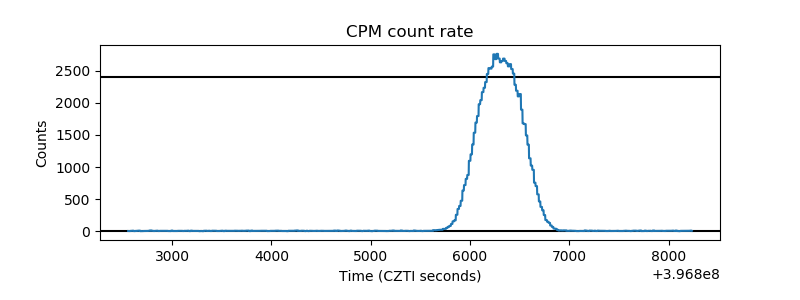 |
| CZT Counter | 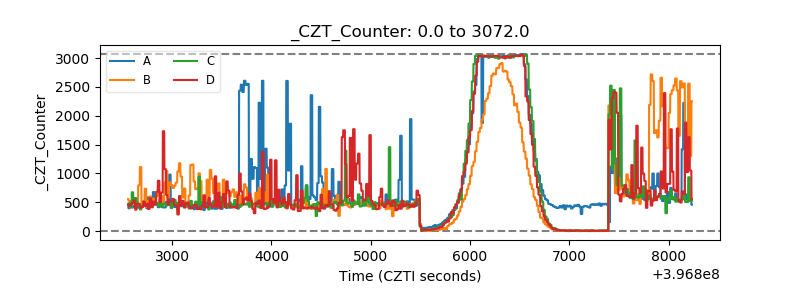 |
| +2.5 Volts monitor | 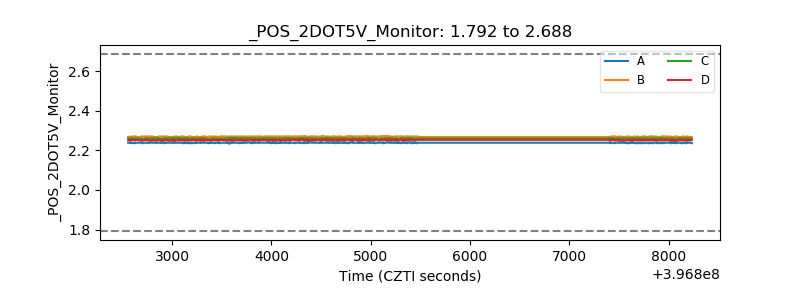 |
| +5 Volts monitor | 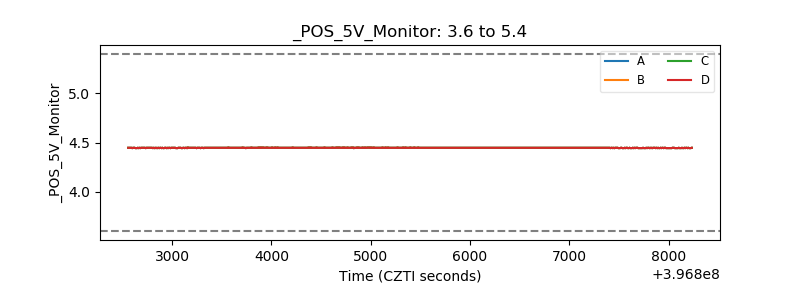 |
| _ROLL_ROT | 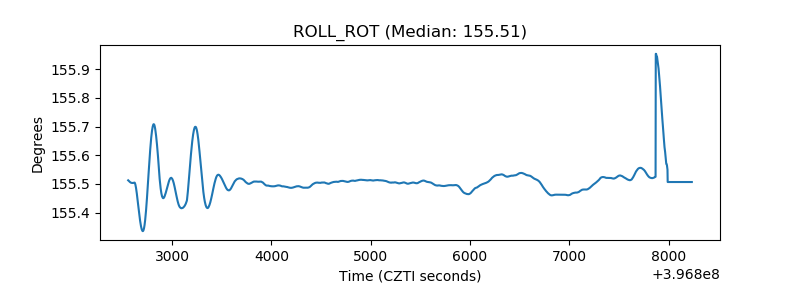 |
| _Roll_DEC | 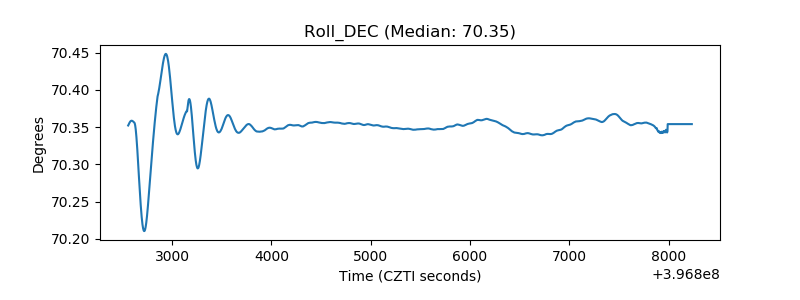 |
| _Roll_RA | 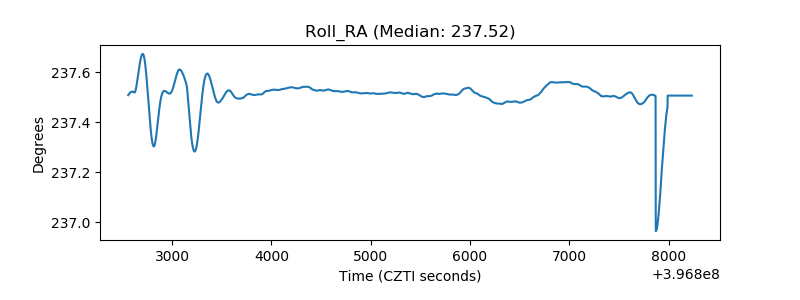 |
| Veto Counter | 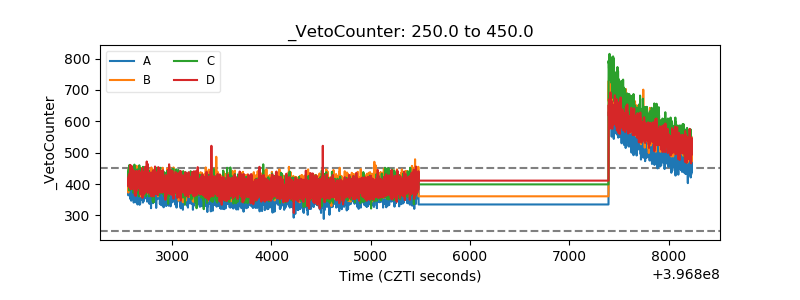 |