| Param | Original file | Final file |
|---|---|---|
| Filename | modeM0/AS1C07_001T10_9000005252_36955cztM0_level2.evt | modeM0/AS1C07_001T10_9000005252_36955cztM0_level2_quad_clean.evt |
| Size (bytes) | 782,498,880 | 141,857,280 |
| Size | 746.2 MB | 135.3 MB |
| Events in quadrant A | 4,895,459 | 966,262 |
| Events in quadrant B | 6,752,704 | 890,911 |
| Events in quadrant C | 4,653,787 | 962,903 |
| Events in quadrant D | 6,850,410 | 914,584 |
| Mode M0 | |||
|---|---|---|---|
| Quadrant | BADHDUFLAG | Total packets | Discarded packets |
| A | 0 | 19817 | 3 |
| B | 0 | 25445 | 10 |
| C | 0 | 18837 | 2 |
| D | 0 | 25922 | 2 |
| Mode SS | |||
|---|---|---|---|
| Quadrant | BADHDUFLAG | Total packets | Discarded packets |
| A | 0 | 166 | 0 |
| B | 0 | 166 | 0 |
| C | 0 | 166 | 0 |
| D | 0 | 166 | 0 |
| Mode M9 | |||
|---|---|---|---|
| Quadrant | BADHDUFLAG | Total packets | Discarded packets |
| A | 0 | 39 | 0 |
| B | 0 | 39 | 0 |
| C | 0 | 39 | 0 |
| D | 0 | 39 | 0 |
| Quadrant | Total seconds | Saturated seconds | Saturation percentage |
|---|---|---|---|
| A | 8074 | 204 | 2.526629% |
| B | 8073 | 947 | 11.730460% |
| C | 8074 | 198 | 2.452316% |
| D | 8074 | 892 | 11.047808% |
Noise dominated data is calculated using 1-second bins in cleaned event files. If a bin has >2000 counts, and if more than 50% of those come from <1% of pixels, then it is considered to be noise-dominated and hence unusable.
| Quadrant | # 1 sec bins | Bins with >0 counts | Bins with >2000 counts | High rate bins dominated by noise | Noise dominated (total time) | Noise dominated (detector-on time) | Marked lightcurve |
|---|---|---|---|---|---|---|---|
| A | 12020 | 8076 | 172 | 172 | 1.43% | 2.13% | 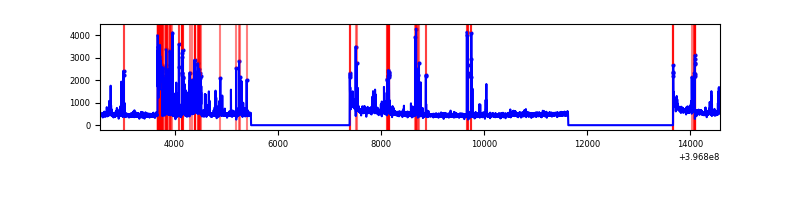 |
| B | 12020 | 8076 | 760 | 760 | 6.32% | 9.41% | 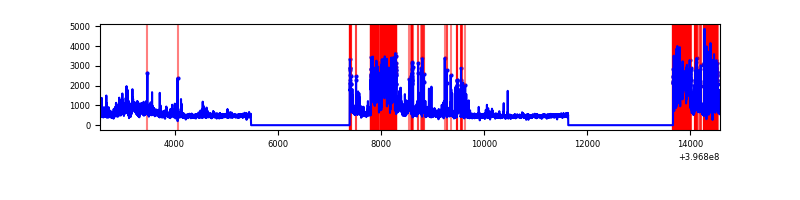 |
| C | 12020 | 8076 | 136 | 136 | 1.13% | 1.68% | 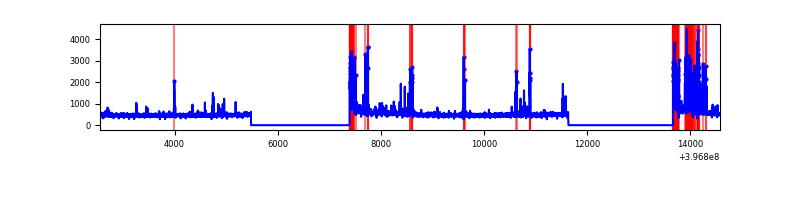 |
| D | 12020 | 8076 | 734 | 734 | 6.11% | 9.09% | 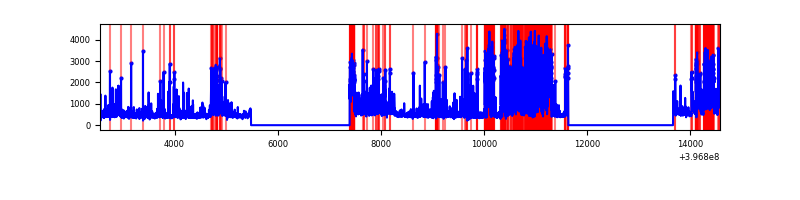 |
Top three noisy pixels from each quadrant. If the there are fewer than three noisy pixels in the level2.evt file, extra rows are filled as -1
| Pixel properties | Quadrant properties | ||||||
|---|---|---|---|---|---|---|---|
| Quadrant | DetID | PixID | Counts | Sigma | Mean | Median | Sigma |
| A | 0 | 247 | 609973 | 3338.44 | 920 | 904 | 182.4 |
| A | 10 | 83 | 319872 | 1748.33 | 920 | 904 | 182.4 |
| A | 15 | 237 | 185451 | 1011.54 | 920 | 904 | 182.4 |
| B | 5 | 172 | 1633762 | 10222.29 | 872 | 850 | 159.7 |
| B | 5 | 184 | 537397 | 3358.87 | 872 | 850 | 159.7 |
| B | 4 | 171 | 529501 | 3309.44 | 872 | 850 | 159.7 |
| C | 15 | 214 | 340324 | 1640.42 | 910 | 918 | 206.9 |
| C | 0 | 10 | 267345 | 1287.7 | 910 | 918 | 206.9 |
| C | 1 | 23 | 266756 | 1284.85 | 910 | 918 | 206.9 |
| D | 2 | 250 | 1884494 | 8908.98 | 880 | 858 | 211.4 |
| D | 12 | 17 | 494020 | 2332.49 | 880 | 858 | 211.4 |
| D | 13 | 171 | 205615 | 968.43 | 880 | 858 | 211.4 |
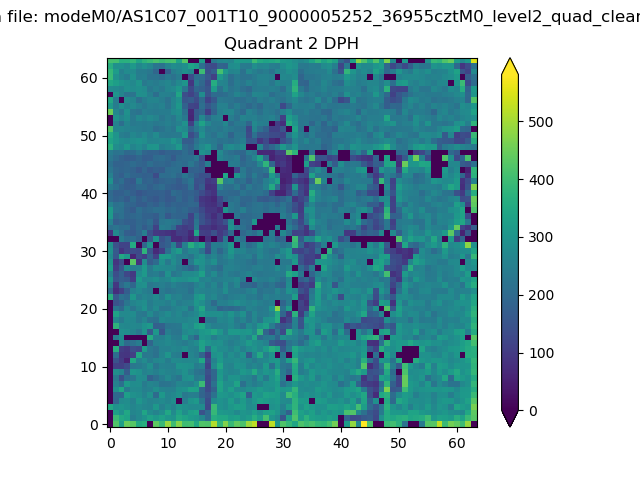
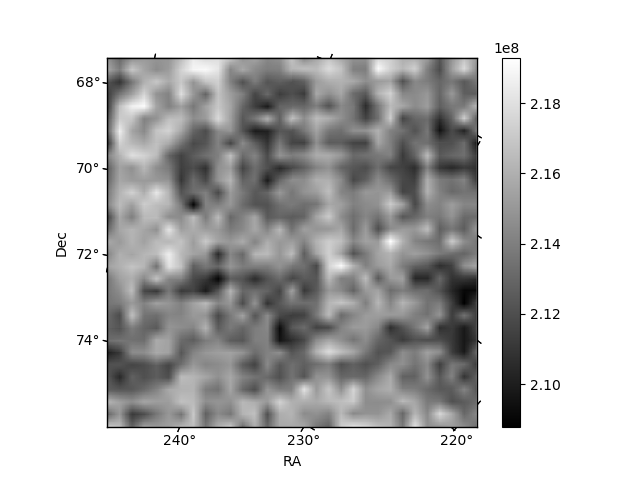
Histogram calculated using DETX and DETY for each event in the final _common_clean file
| Quadrant A |  |
 |
Quadrant B |
|---|---|---|---|
| Quadrant D | 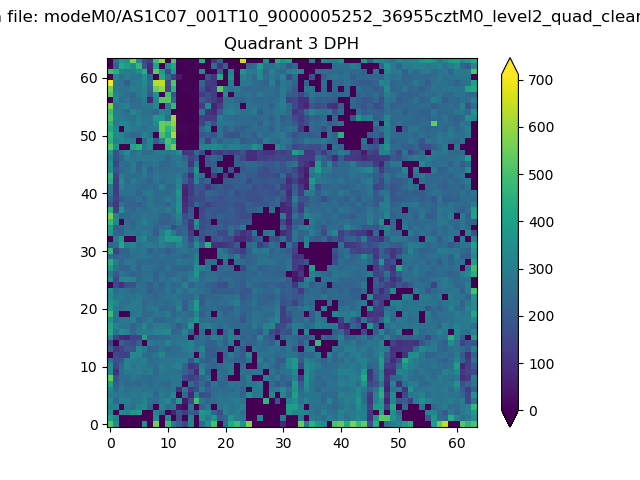 |
 |
Quadrant C |
| Plot type | Count rate plots | Images |
|---|---|---|
| Comparison with Poisson distribution Blue bars denote a histogram of data divided into 1 sec bins. Red curve is a Poisson curve with rate = median count rate of data. |
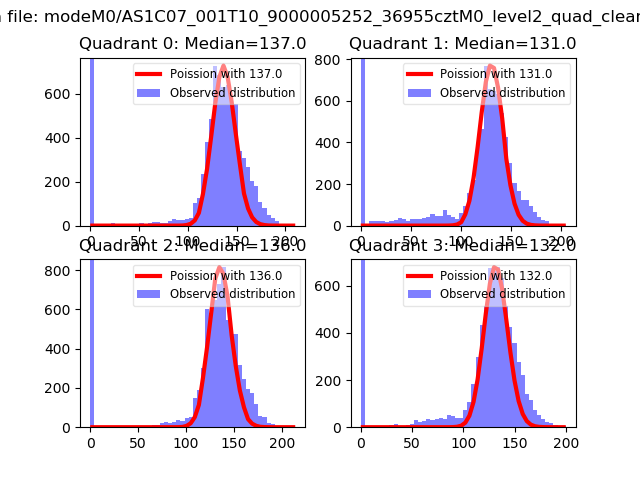 |
 |
| Quadrant-wise count rates Data is divided into 100 sec bins |
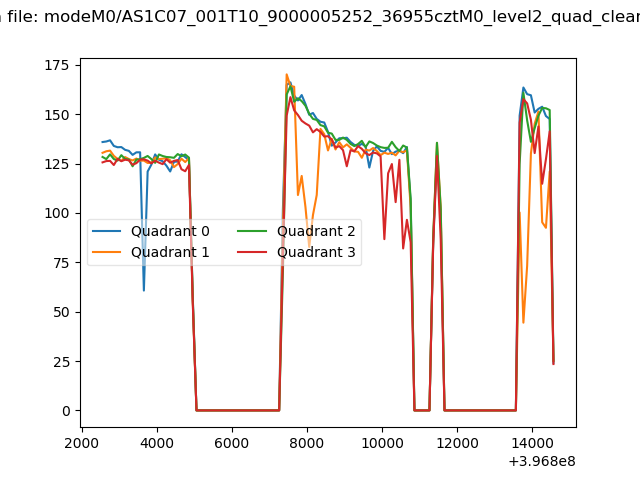 |
|
| Module-wise count rates for Quadrant A Data is divided into 100 sec bins |
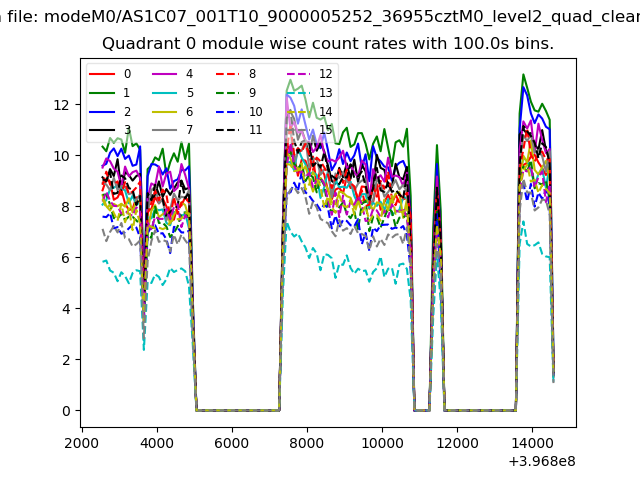 |
 |
| Module-wise count rates for Quadrant B Data is divided into 100 sec bins |
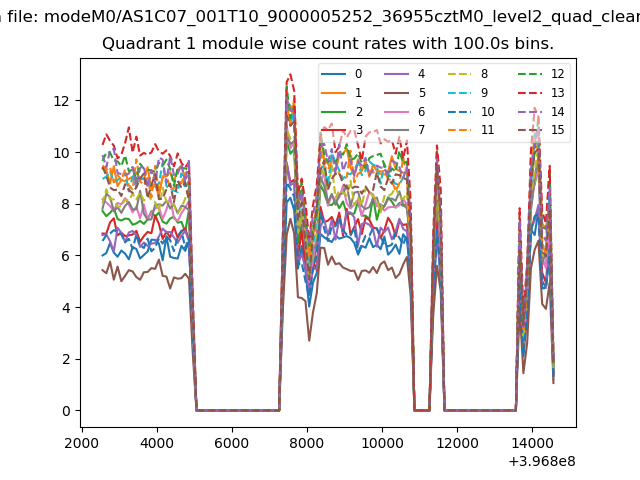 |
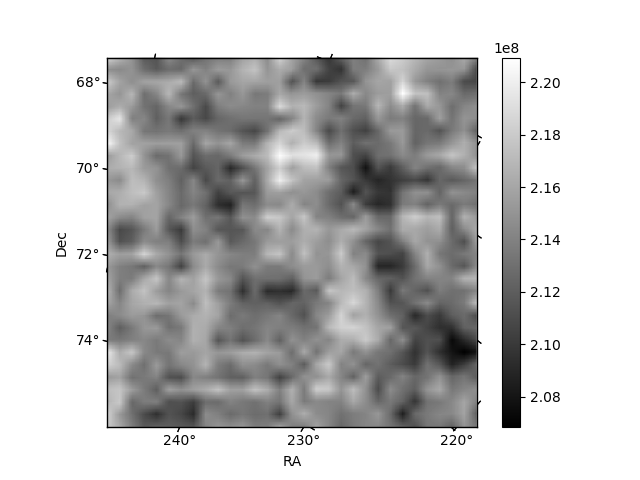 |
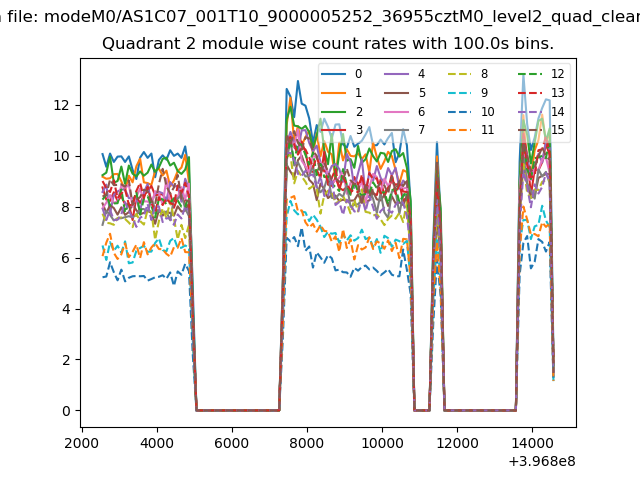
| Module-wise count rates for Quadrant C Data is divided into 100 sec bins |
 |
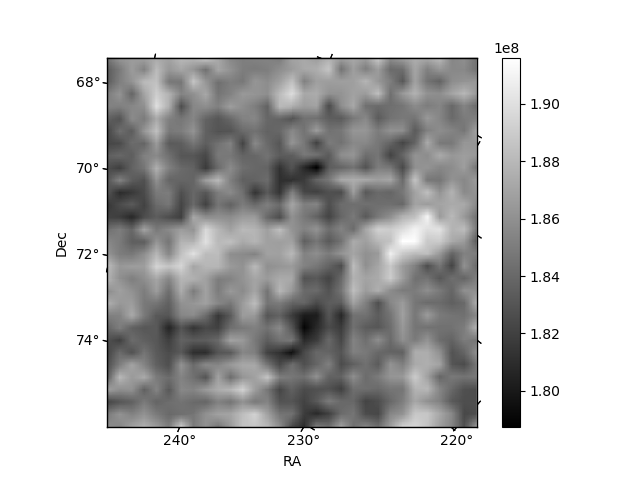 |
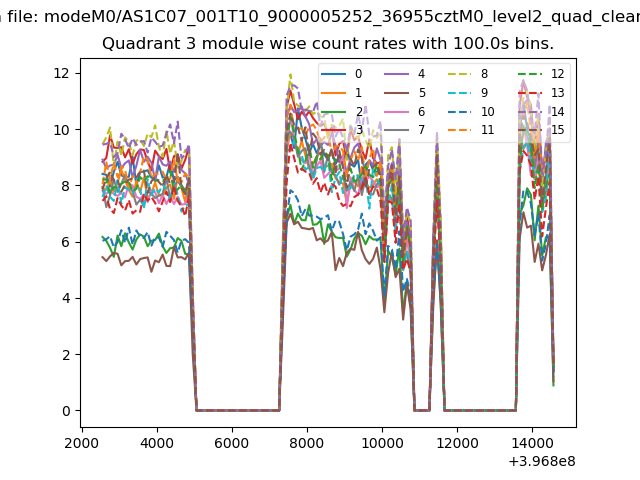
| Module-wise count rates for Quadrant D Data is divided into 100 sec bins |
 |
 |
| Parameter | Plot |
|---|---|
| CZT HV Monitor |  |
| D_VDD | 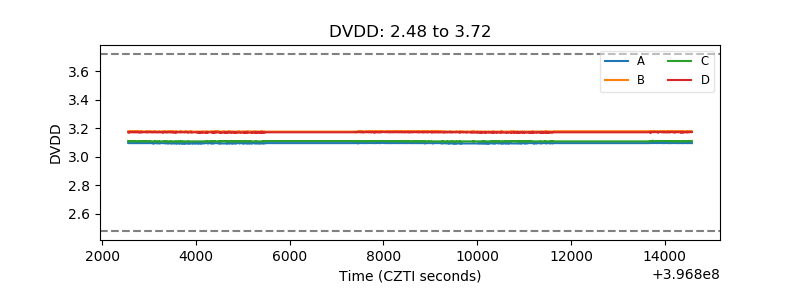 |
| Temperature 1 | 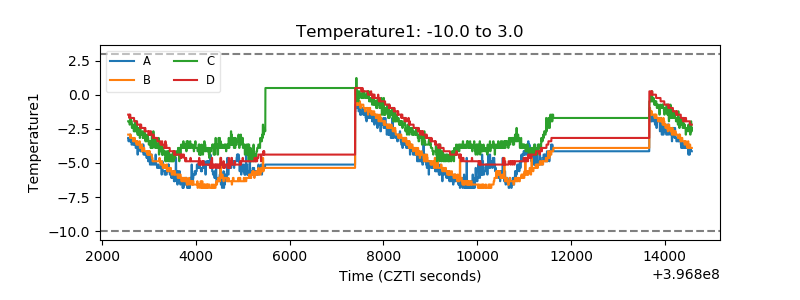 |
| Veto HV Monitor | 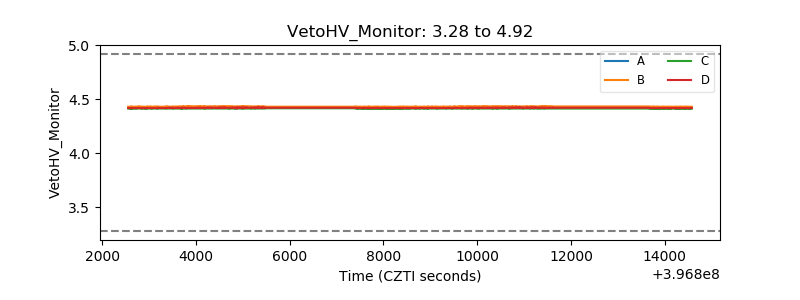 |
| Veto LLD | 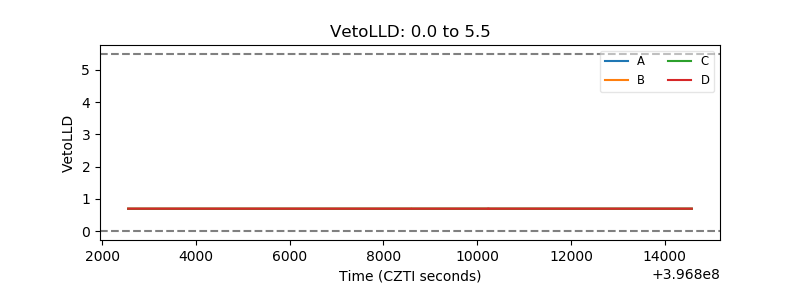 |
| Alpha Counter | 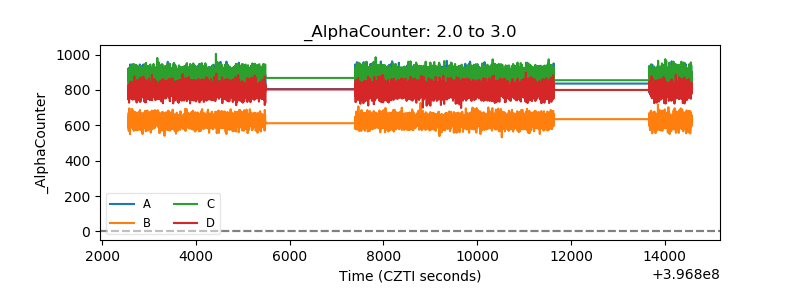 |
| _CPM_Rate | 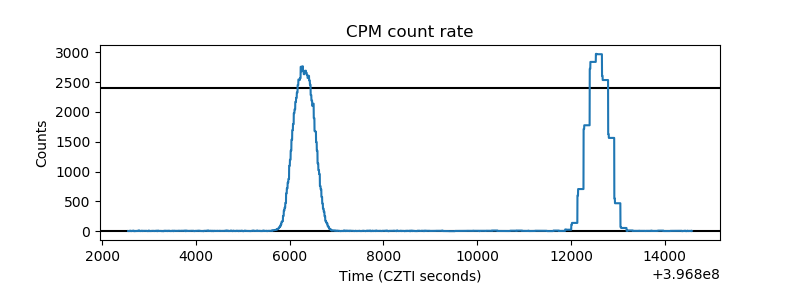 |
| CZT Counter | 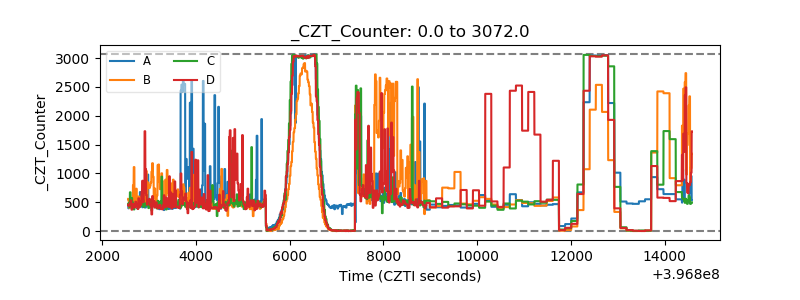 |
| +2.5 Volts monitor | 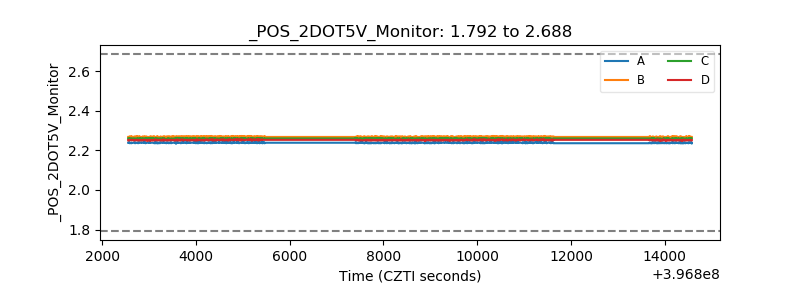 |
| +5 Volts monitor | 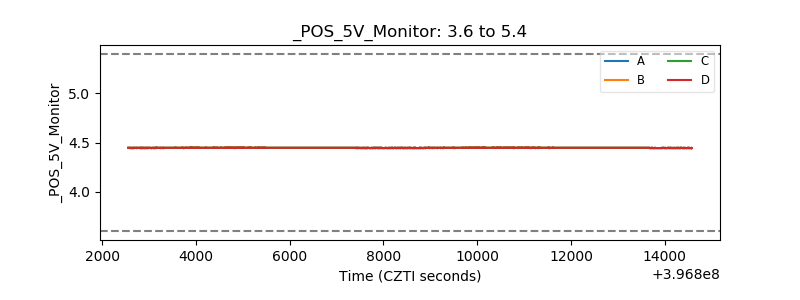 |
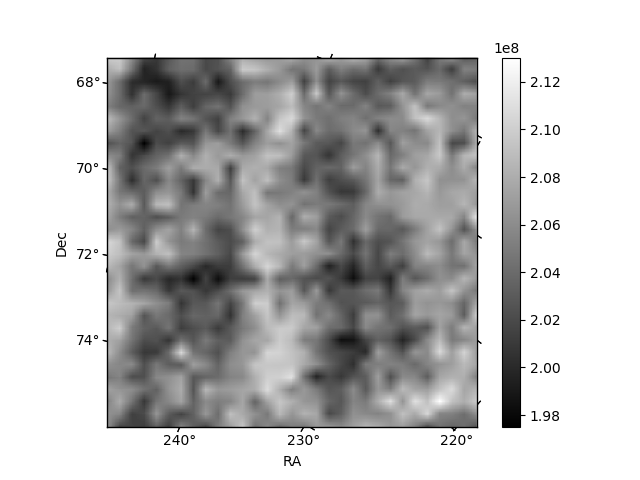
| _ROLL_ROT | 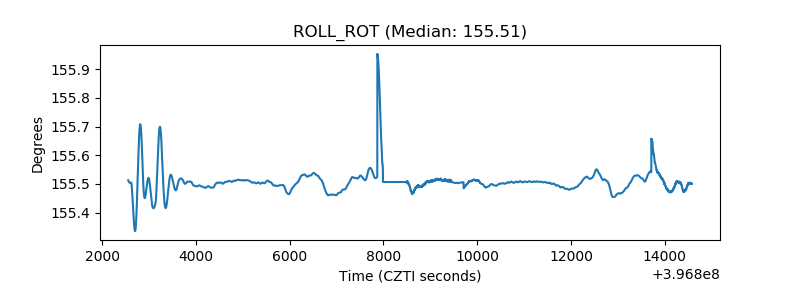 |
| _Roll_DEC | 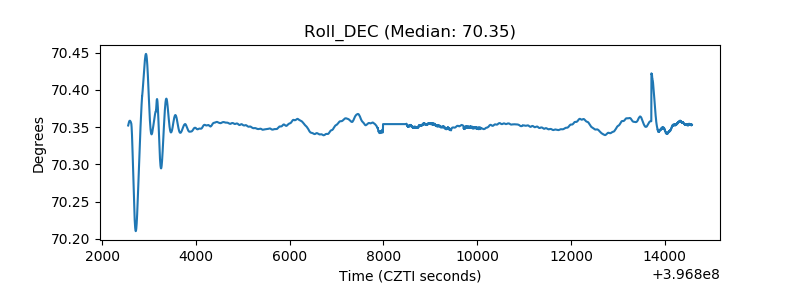 |
| _Roll_RA | 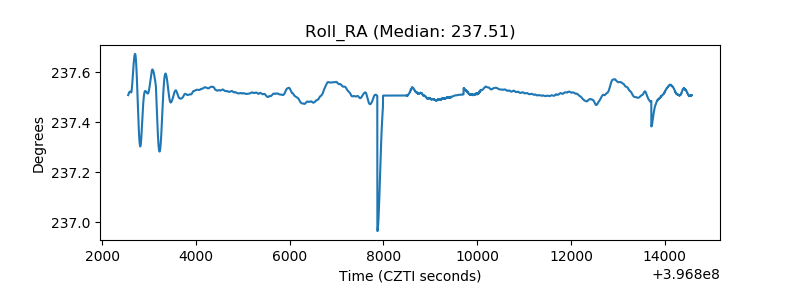 |
| Veto Counter | 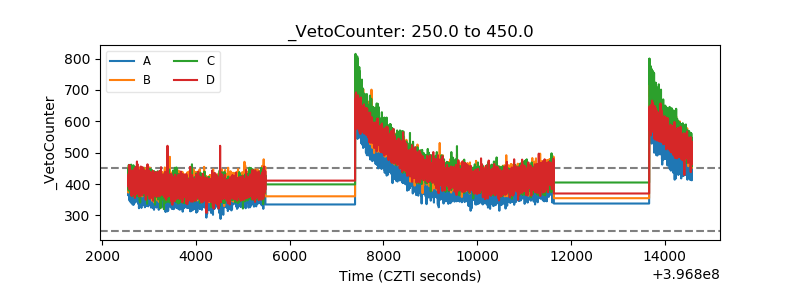 |