| Param | Original file | Final file |
|---|---|---|
| Filename | modeM0/AS1C07_001T10_9000005252_36956cztM0_level2.evt | modeM0/AS1C07_001T10_9000005252_36956cztM0_level2_quad_clean.evt |
| Size (bytes) | 508,308,480 | 89,717,760 |
| Size | 484.8 MB | 85.6 MB |
| Events in quadrant A | 2,720,384 | 612,219 |
| Events in quadrant B | 4,450,317 | 567,703 |
| Events in quadrant C | 3,294,169 | 614,983 |
| Events in quadrant D | 4,595,592 | 576,157 |
| Mode M0 | |||
|---|---|---|---|
| Quadrant | BADHDUFLAG | Total packets | Discarded packets |
| A | 0 | 11225 | 3 |
| B | 0 | 16543 | 2 |
| C | 0 | 12800 | 2 |
| D | 0 | 16984 | 2 |
| Mode SS | |||
|---|---|---|---|
| Quadrant | BADHDUFLAG | Total packets | Discarded packets |
| A | 0 | 100 | 0 |
| B | 0 | 100 | 0 |
| C | 0 | 100 | 0 |
| D | 0 | 100 | 0 |
| Mode M9 | |||
|---|---|---|---|
| Quadrant | BADHDUFLAG | Total packets | Discarded packets |
| A | 0 | 23 | 0 |
| B | 0 | 23 | 0 |
| C | 0 | 23 | 0 |
| D | 0 | 24 | 0 |
| Quadrant | Total seconds | Saturated seconds | Saturation percentage |
|---|---|---|---|
| A | 4928 | 50 | 1.014610% |
| B | 4928 | 648 | 13.149351% |
| C | 4928 | 205 | 4.159903% |
| D | 4928 | 447 | 9.070617% |
Noise dominated data is calculated using 1-second bins in cleaned event files. If a bin has >2000 counts, and if more than 50% of those come from <1% of pixels, then it is considered to be noise-dominated and hence unusable.
| Quadrant | # 1 sec bins | Bins with >0 counts | Bins with >2000 counts | High rate bins dominated by noise | Noise dominated (total time) | Noise dominated (detector-on time) | Marked lightcurve |
|---|---|---|---|---|---|---|---|
| A | 7020 | 4929 | 39 | 39 | 0.56% | 0.79% | 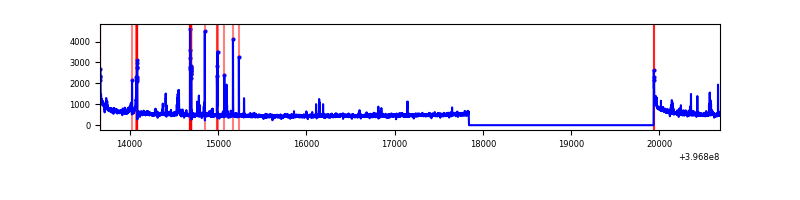 |
| B | 7020 | 4929 | 536 | 536 | 7.64% | 10.87% | 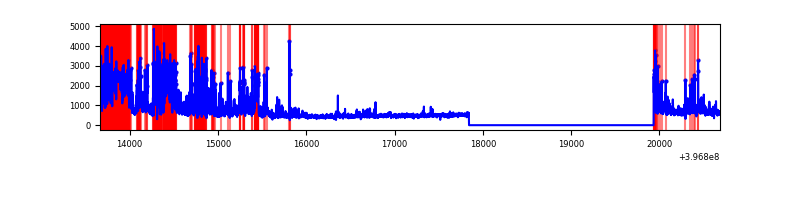 |
| C | 7020 | 4929 | 141 | 141 | 2.01% | 2.86% | 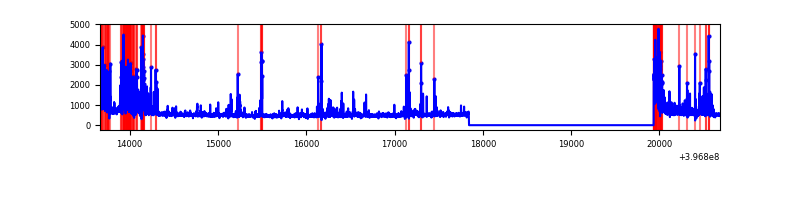 |
| D | 7020 | 4929 | 389 | 389 | 5.54% | 7.89% | 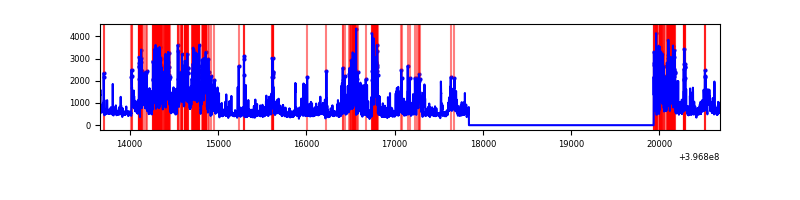 |
Top three noisy pixels from each quadrant. If the there are fewer than three noisy pixels in the level2.evt file, extra rows are filled as -1
| Pixel properties | Quadrant properties | ||||||
|---|---|---|---|---|---|---|---|
| Quadrant | DetID | PixID | Counts | Sigma | Mean | Median | Sigma |
| A | 10 | 83 | 246161 | 2139.42 | 572 | 561 | 114.8 |
| A | 15 | 237 | 86525 | 748.83 | 572 | 561 | 114.8 |
| A | 15 | 174 | 80972 | 700.46 | 572 | 561 | 114.8 |
| B | 4 | 171 | 836082 | 8330.61 | 543 | 528 | 100.3 |
| B | 5 | 172 | 816374 | 8134.12 | 543 | 528 | 100.3 |
| B | 0 | 221 | 162231 | 1612.2 | 543 | 528 | 100.3 |
| C | 1 | 23 | 361847 | 2772.25 | 568 | 574 | 130.3 |
| C | 0 | 10 | 272024 | 2082.98 | 568 | 574 | 130.3 |
| C | 15 | 214 | 211729 | 1620.31 | 568 | 574 | 130.3 |
| D | 12 | 17 | 1527023 | 10403.93 | 551 | 539 | 146.7 |
| D | 2 | 250 | 239751 | 1630.38 | 551 | 539 | 146.7 |
| D | 10 | 253 | 196583 | 1336.16 | 551 | 539 | 146.7 |
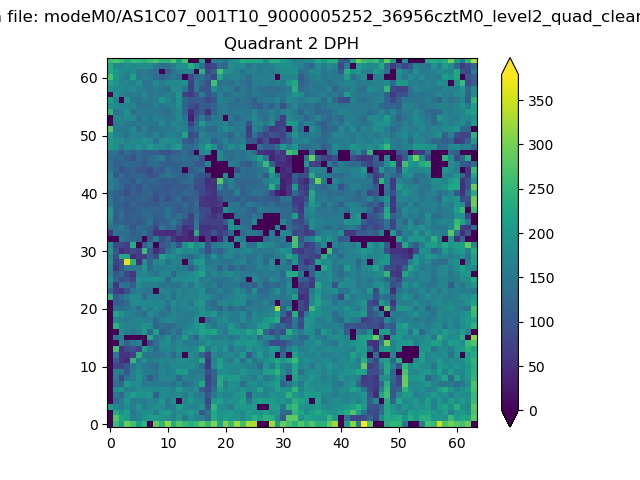
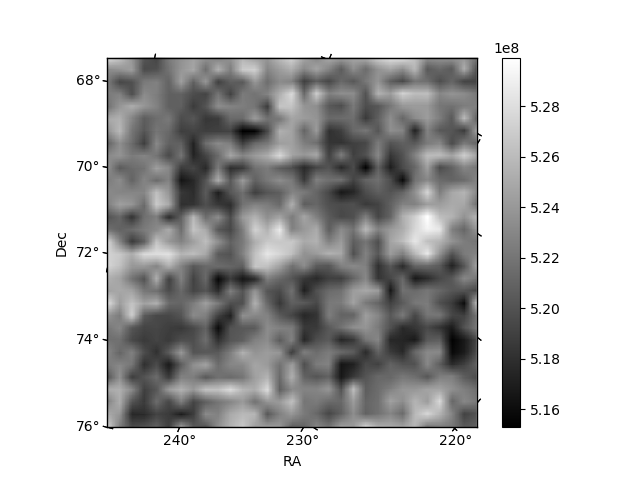
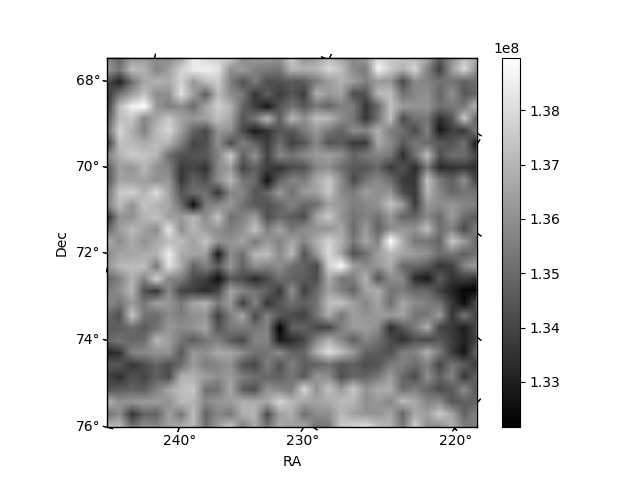
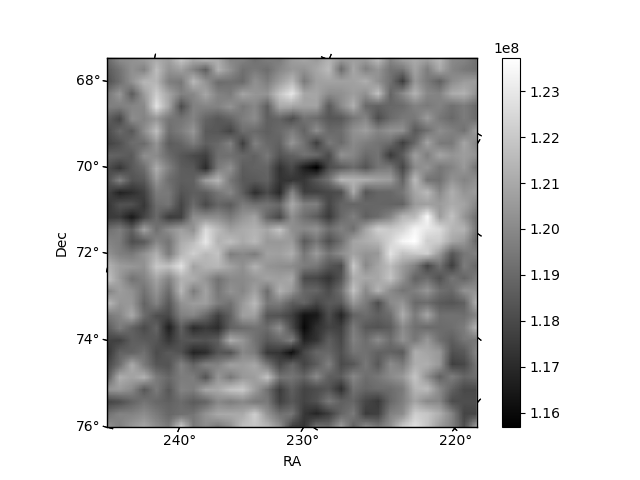
Histogram calculated using DETX and DETY for each event in the final _common_clean file
| Quadrant A | 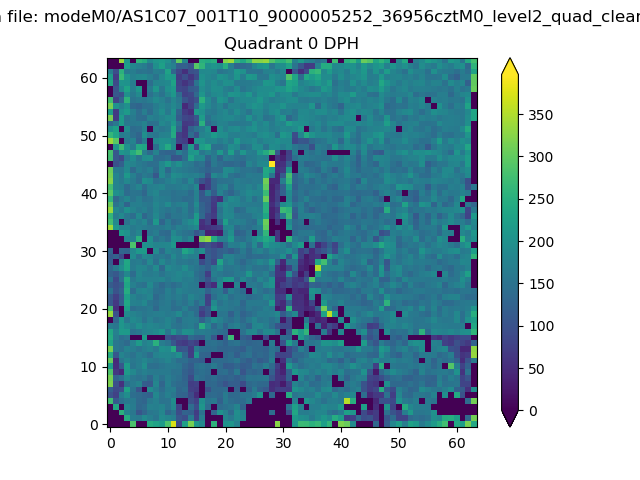 |
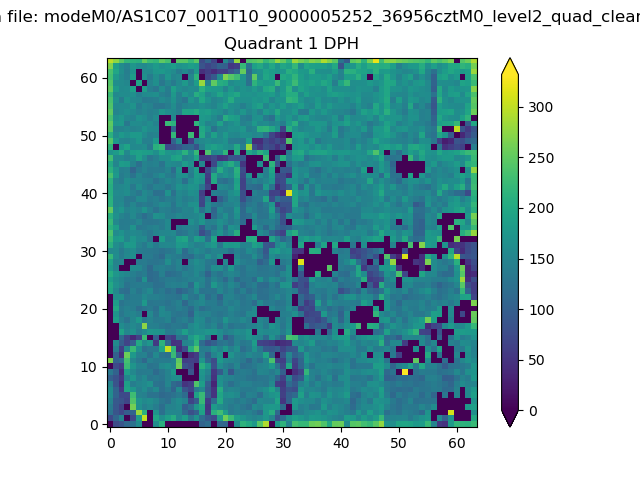 |
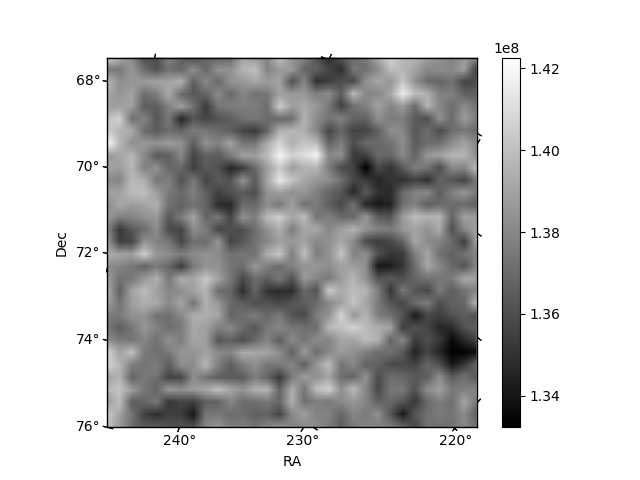
Quadrant B |
|---|---|---|---|
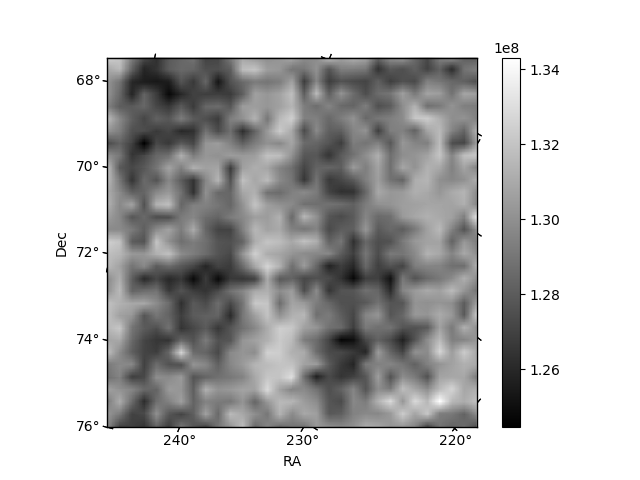
| Quadrant D | 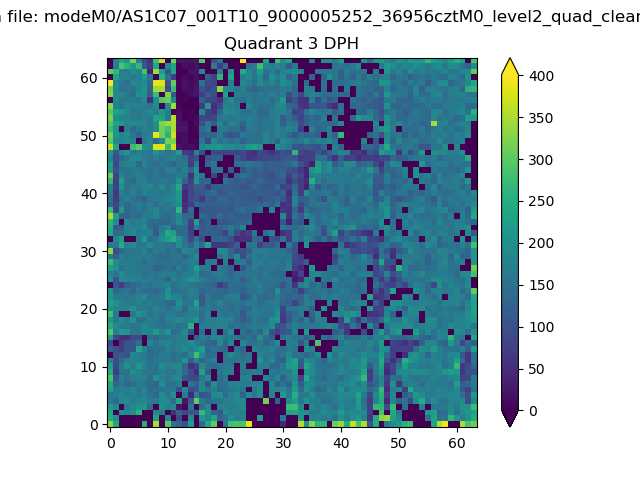 |
 |
Quadrant C |
| Plot type | Count rate plots | Images |
|---|---|---|
| Comparison with Poisson distribution Blue bars denote a histogram of data divided into 1 sec bins. Red curve is a Poisson curve with rate = median count rate of data. |
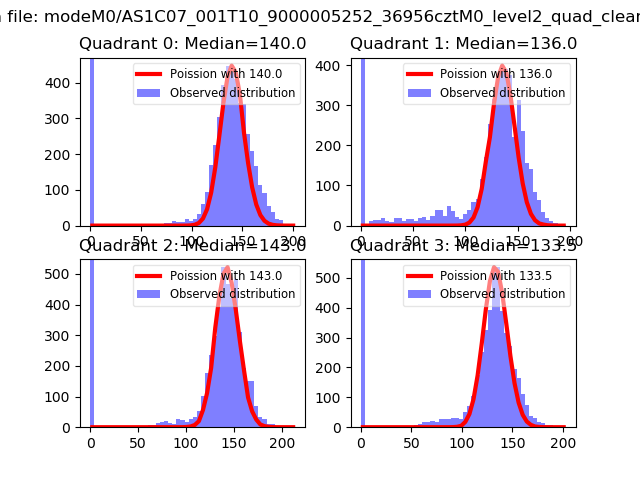 |
 |
| Quadrant-wise count rates Data is divided into 100 sec bins |
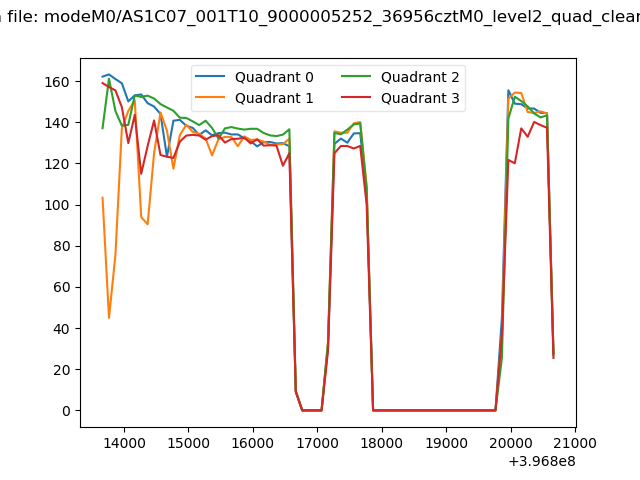 |
|
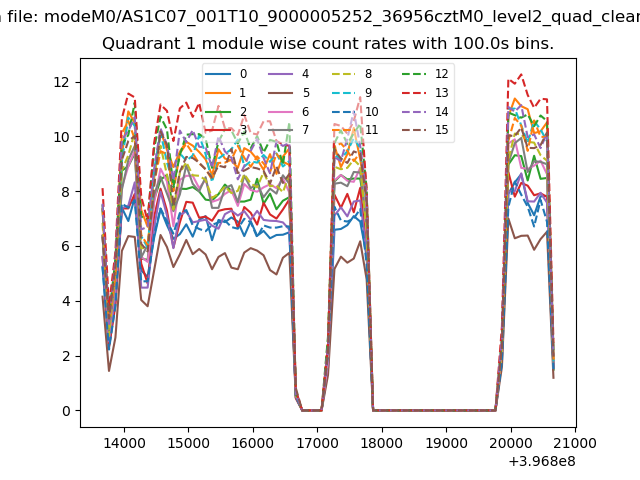
| Module-wise count rates for Quadrant A Data is divided into 100 sec bins |
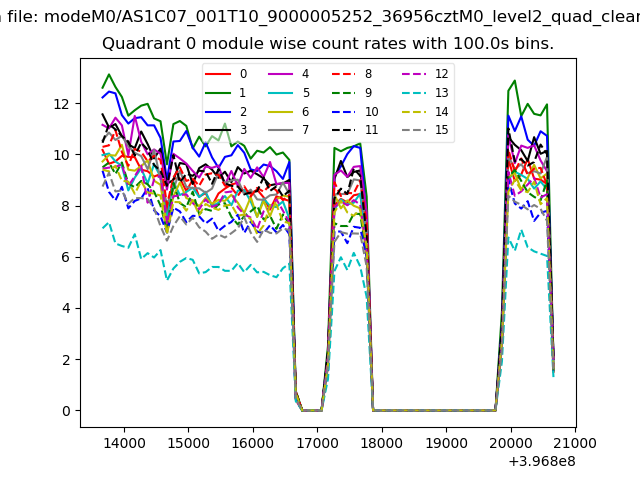 |
 |
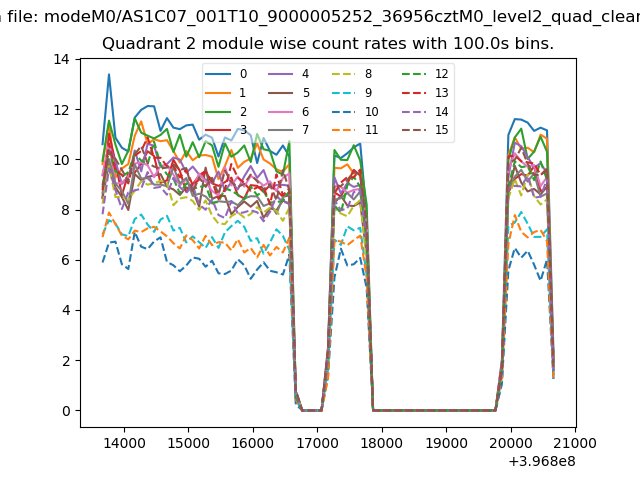
| Module-wise count rates for Quadrant B Data is divided into 100 sec bins |
 |
 |
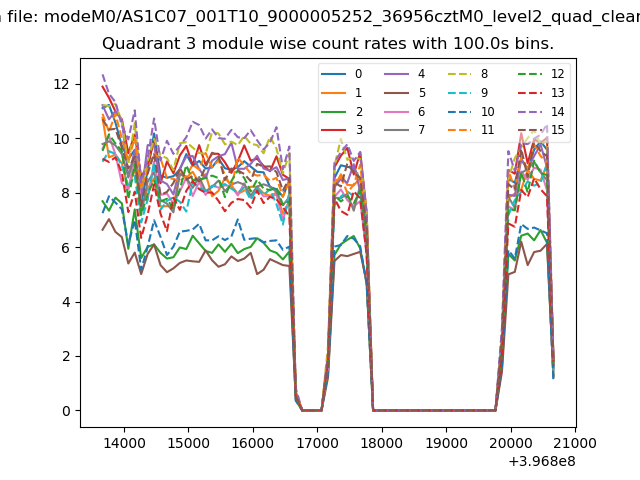
| Module-wise count rates for Quadrant C Data is divided into 100 sec bins |
 |
 |
| Module-wise count rates for Quadrant D Data is divided into 100 sec bins |
 |
 |
| Parameter | Plot |
|---|---|
| CZT HV Monitor | 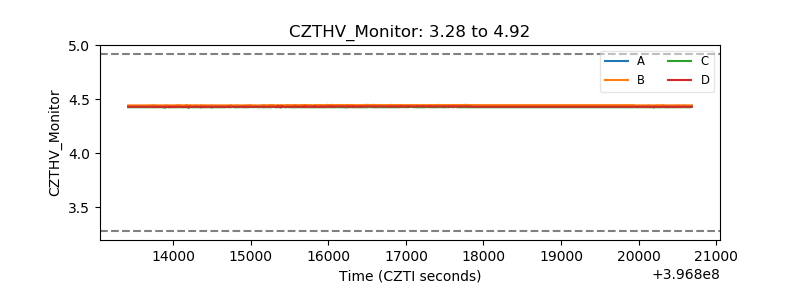 |
| D_VDD | 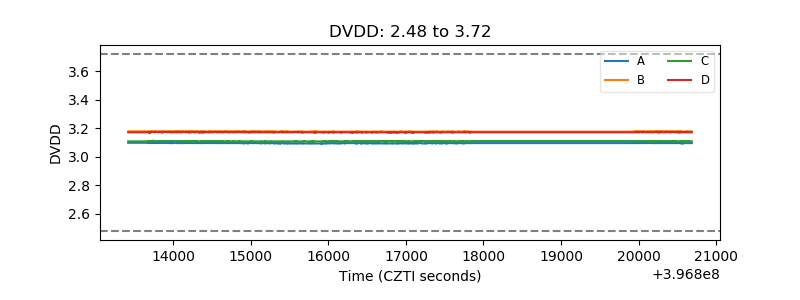 |
| Temperature 1 | 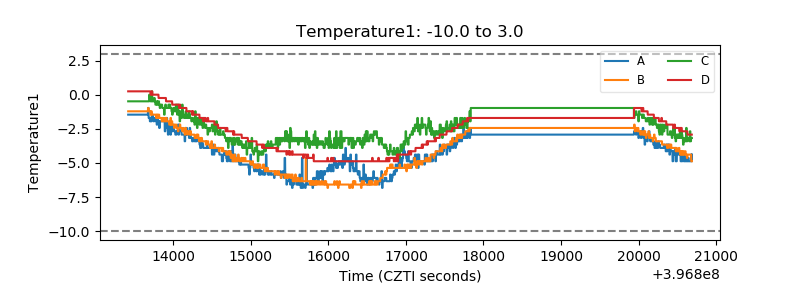 |
| Veto HV Monitor |  |
| Veto LLD | 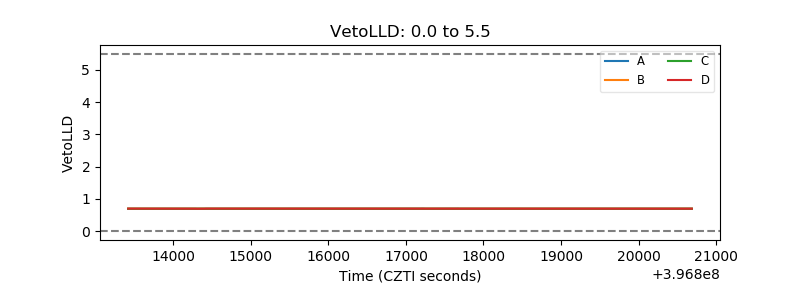 |
| Alpha Counter |  |
| _CPM_Rate | 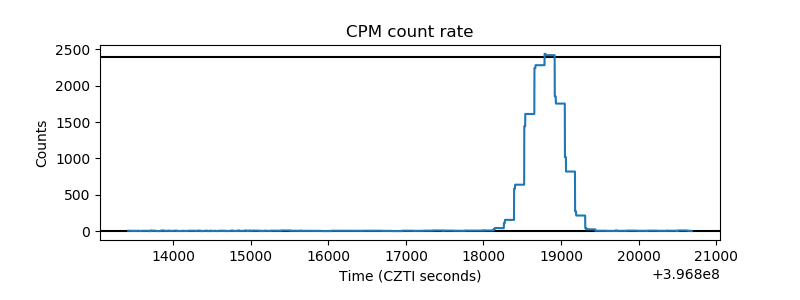 |
| CZT Counter | 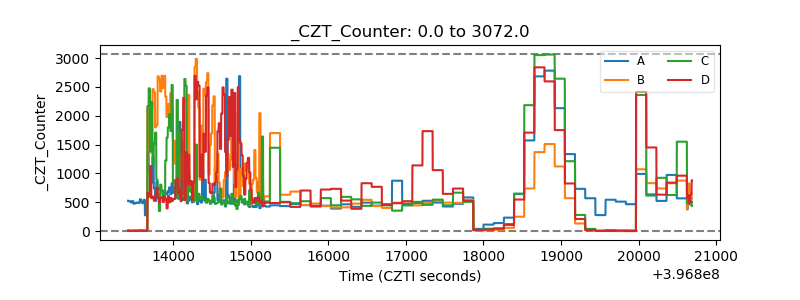 |
| +2.5 Volts monitor | 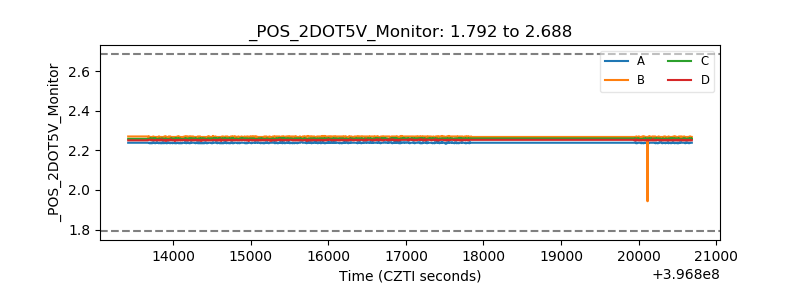 |
| +5 Volts monitor | 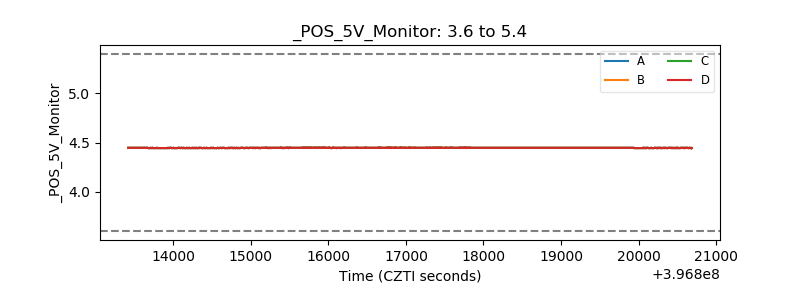 |
| _ROLL_ROT | 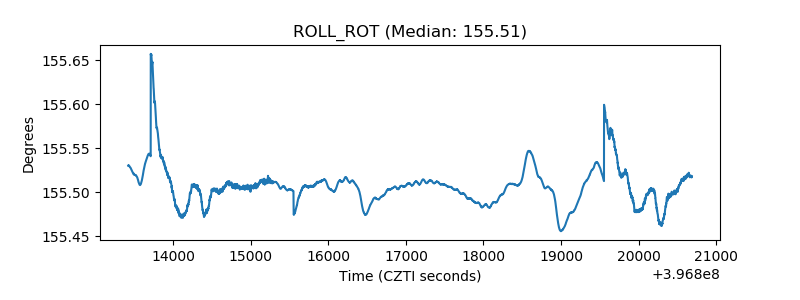 |
| _Roll_DEC | 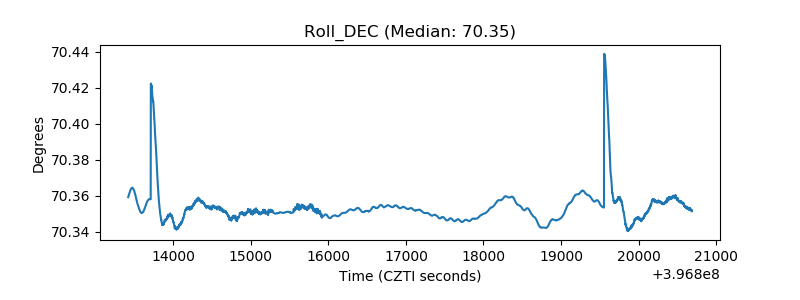 |
| _Roll_RA | 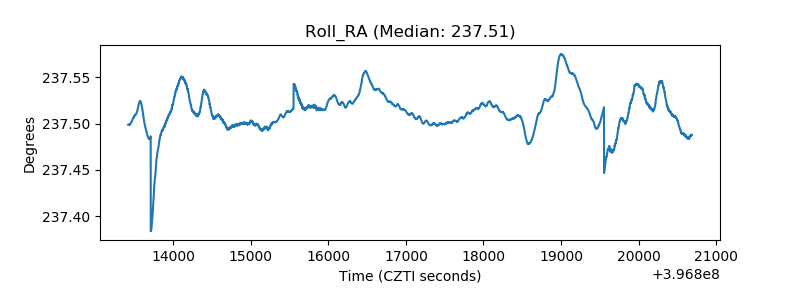 |
| Veto Counter | 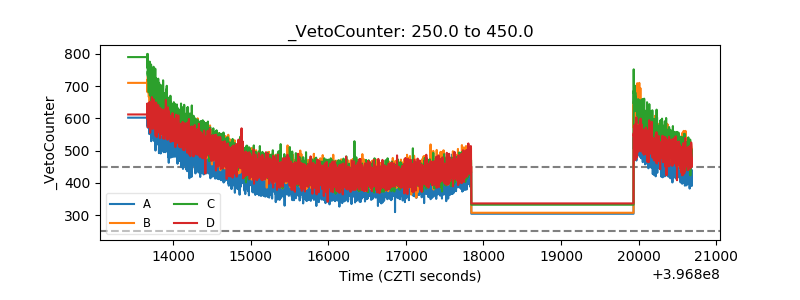 |