| Param | Original file | Final file |
|---|---|---|
| Filename | modeM0/AS1C07_001T10_9000005252_36957cztM0_level2.evt | modeM0/AS1C07_001T10_9000005252_36957cztM0_level2_quad_clean.evt |
| Size (bytes) | 444,024,000 | 86,166,720 |
| Size | 423.5 MB | 82.2 MB |
| Events in quadrant A | 2,450,924 | 577,064 |
| Events in quadrant B | 3,352,728 | 576,256 |
| Events in quadrant C | 2,862,056 | 579,356 |
| Events in quadrant D | 4,450,648 | 534,620 |
| Mode M0 | |||
|---|---|---|---|
| Quadrant | BADHDUFLAG | Total packets | Discarded packets |
| A | 0 | 10468 | 3 |
| B | 0 | 13243 | 2 |
| C | 0 | 11538 | 2 |
| D | 0 | 16607 | 2 |
| Mode SS | |||
|---|---|---|---|
| Quadrant | BADHDUFLAG | Total packets | Discarded packets |
| A | 0 | 100 | 0 |
| B | 0 | 100 | 0 |
| C | 0 | 100 | 0 |
| D | 0 | 100 | 0 |
| Mode M9 | |||
|---|---|---|---|
| Quadrant | BADHDUFLAG | Total packets | Discarded packets |
| A | 0 | 28 | 0 |
| B | 0 | 28 | 0 |
| C | 0 | 28 | 0 |
| D | 0 | 29 | 0 |
| Quadrant | Total seconds | Saturated seconds | Saturation percentage |
|---|---|---|---|
| A | 4872 | 16 | 0.328407% |
| B | 4872 | 161 | 3.304598% |
| C | 4872 | 131 | 2.688834% |
| D | 4872 | 512 | 10.509031% |
Noise dominated data is calculated using 1-second bins in cleaned event files. If a bin has >2000 counts, and if more than 50% of those come from <1% of pixels, then it is considered to be noise-dominated and hence unusable.
| Quadrant | # 1 sec bins | Bins with >0 counts | Bins with >2000 counts | High rate bins dominated by noise | Noise dominated (total time) | Noise dominated (detector-on time) | Marked lightcurve |
|---|---|---|---|---|---|---|---|
| A | 6995 | 4873 | 12 | 12 | 0.17% | 0.25% | 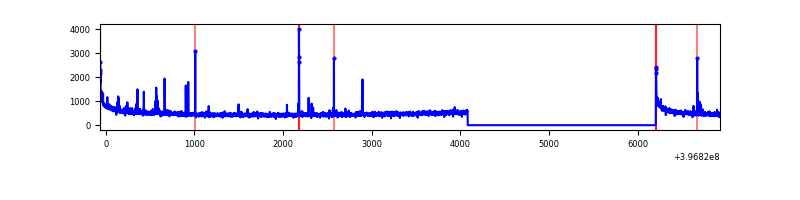 |
| B | 6995 | 4873 | 101 | 101 | 1.44% | 2.07% | 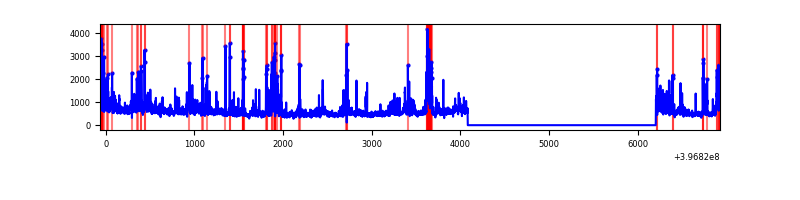 |
| C | 6995 | 4873 | 95 | 95 | 1.36% | 1.95% | 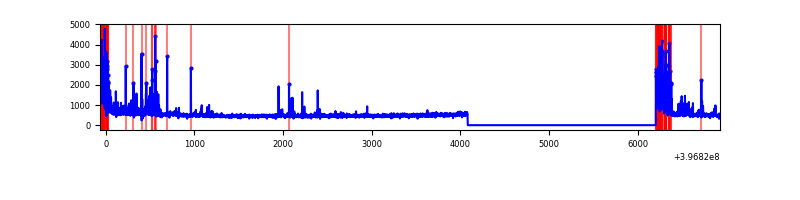 |
| D | 6995 | 4873 | 419 | 419 | 5.99% | 8.60% | 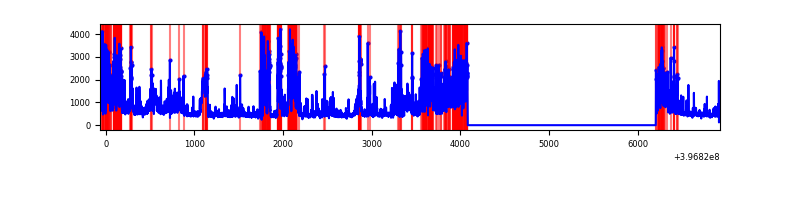 |
Top three noisy pixels from each quadrant. If the there are fewer than three noisy pixels in the level2.evt file, extra rows are filled as -1
| Pixel properties | Quadrant properties | ||||||
|---|---|---|---|---|---|---|---|
| Quadrant | DetID | PixID | Counts | Sigma | Mean | Median | Sigma |
| A | 10 | 83 | 236179 | 2141.45 | 547 | 536 | 110.0 |
| A | 9 | 143 | 37577 | 336.62 | 547 | 536 | 110.0 |
| A | 15 | 237 | 15653 | 137.38 | 547 | 536 | 110.0 |
| B | 4 | 171 | 272674 | 2663.93 | 548 | 534 | 102.2 |
| B | 5 | 184 | 225850 | 2205.58 | 548 | 534 | 102.2 |
| B | 0 | 221 | 180227 | 1758.98 | 548 | 534 | 102.2 |
| C | 1 | 23 | 242044 | 1910.1 | 543 | 547 | 126.4 |
| C | 0 | 10 | 232796 | 1836.95 | 543 | 547 | 126.4 |
| C | 15 | 214 | 207366 | 1635.82 | 543 | 547 | 126.4 |
| D | 12 | 17 | 1718840 | 12407.9 | 518 | 508 | 138.5 |
| D | 2 | 250 | 207753 | 1496.5 | 518 | 508 | 138.5 |
| D | 13 | 171 | 121747 | 875.45 | 518 | 508 | 138.5 |
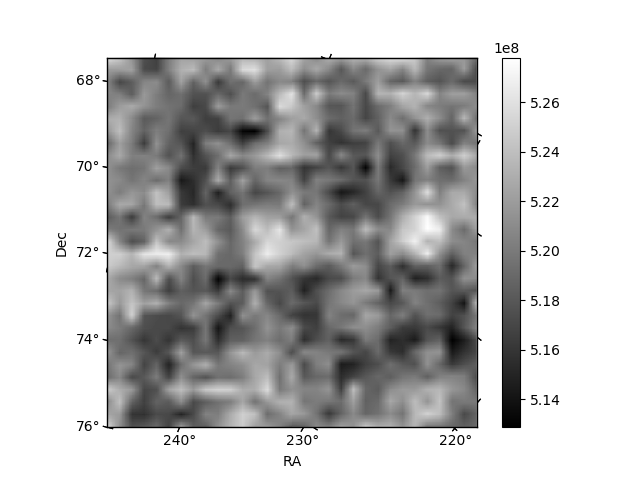
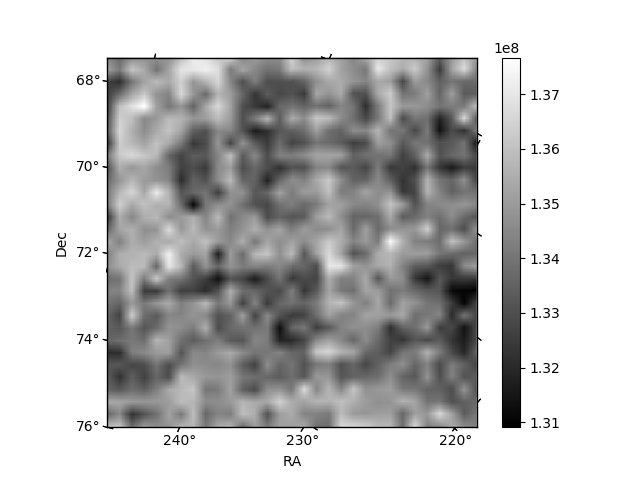
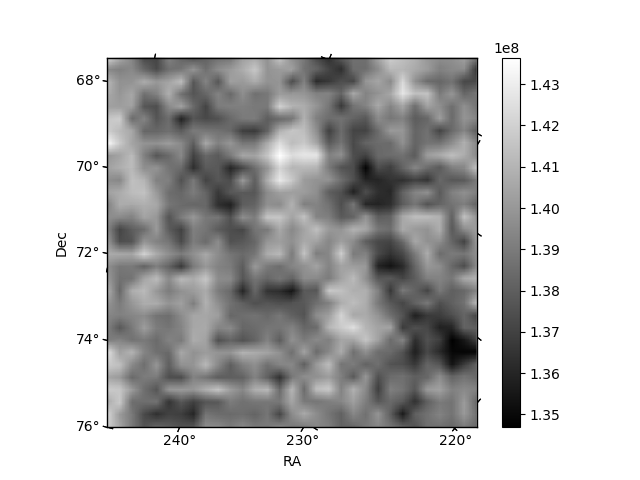
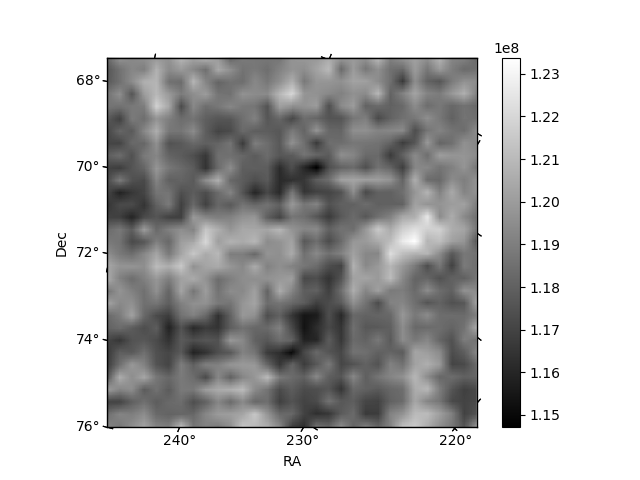
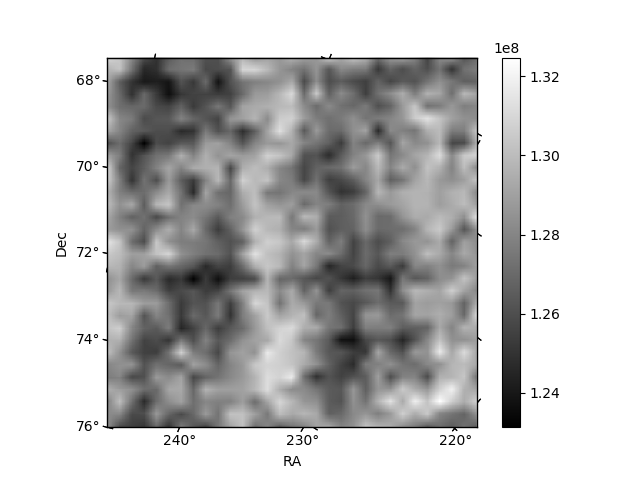
Histogram calculated using DETX and DETY for each event in the final _common_clean file
| Quadrant A | 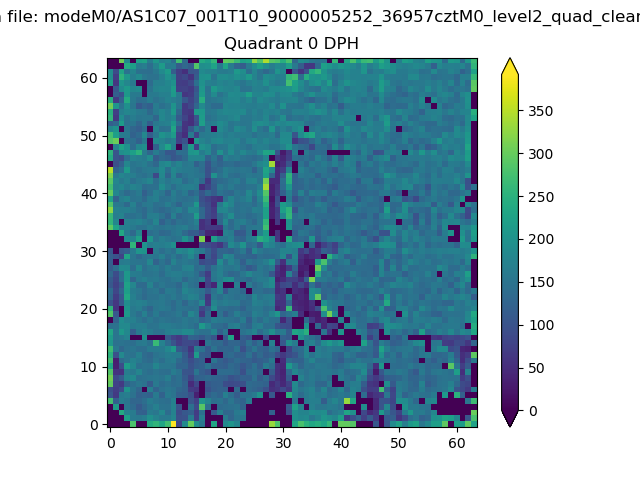 |
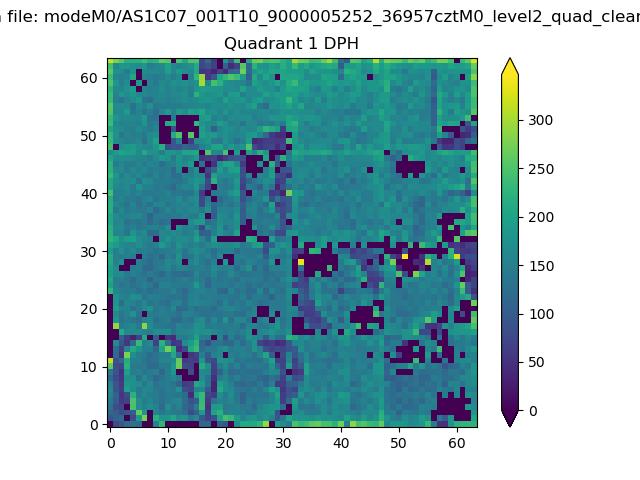 |
Quadrant B |
|---|---|---|---|
| Quadrant D | 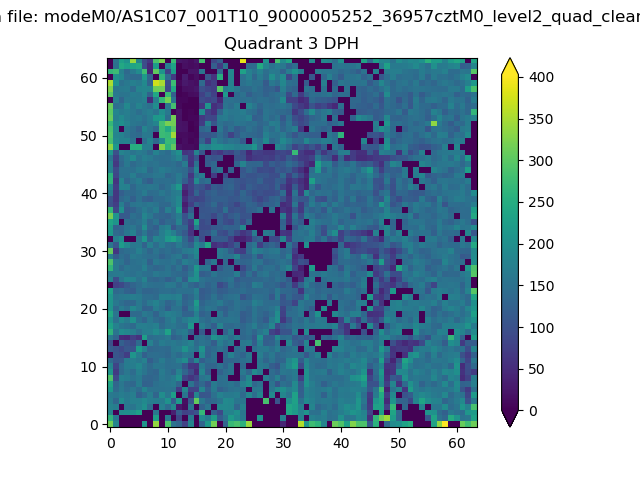 |
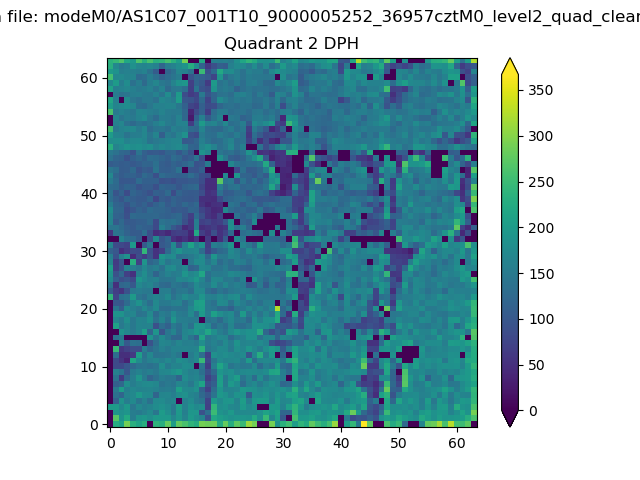 |
Quadrant C |
| Plot type | Count rate plots | Images |
|---|---|---|
| Comparison with Poisson distribution Blue bars denote a histogram of data divided into 1 sec bins. Red curve is a Poisson curve with rate = median count rate of data. |
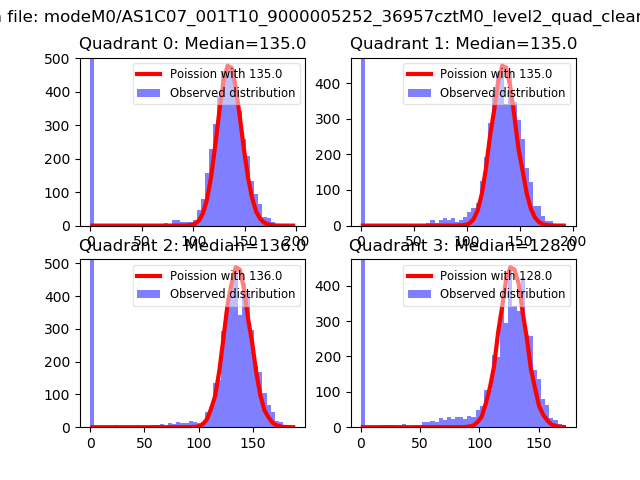 |
 |
| Quadrant-wise count rates Data is divided into 100 sec bins |
 |
|
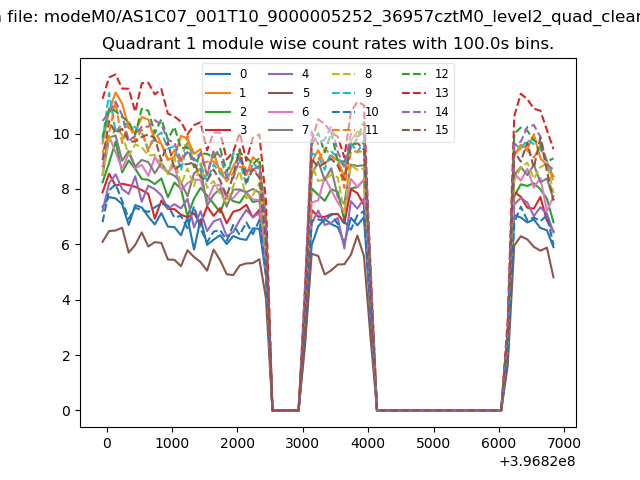
| Module-wise count rates for Quadrant A Data is divided into 100 sec bins |
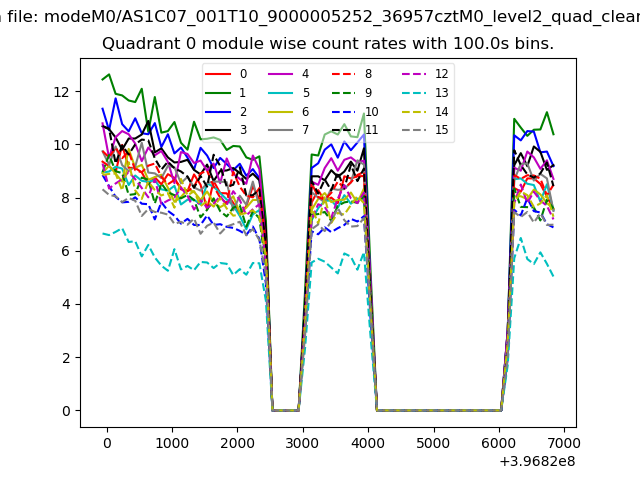 |
 |
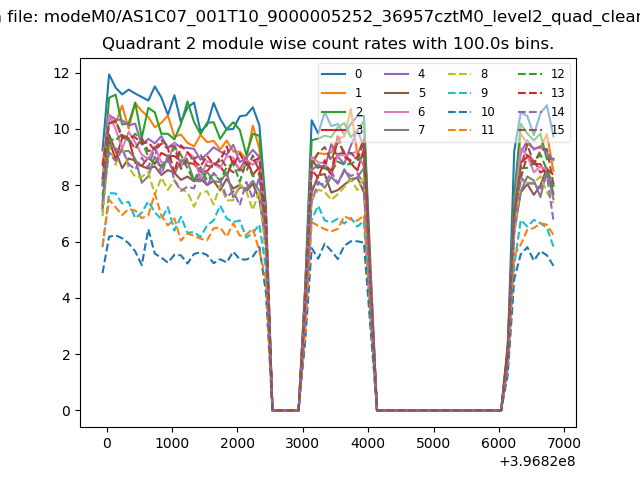
| Module-wise count rates for Quadrant B Data is divided into 100 sec bins |
 |
 |
| Module-wise count rates for Quadrant C Data is divided into 100 sec bins |
 |
 |
| Module-wise count rates for Quadrant D Data is divided into 100 sec bins |
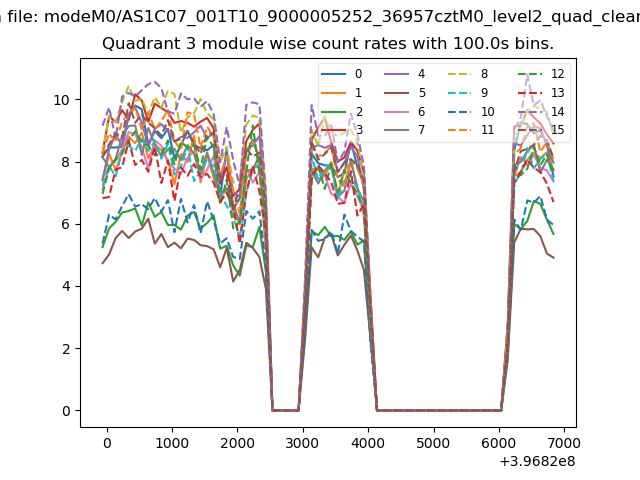 |
 |
| Parameter | Plot |
|---|---|
| CZT HV Monitor | 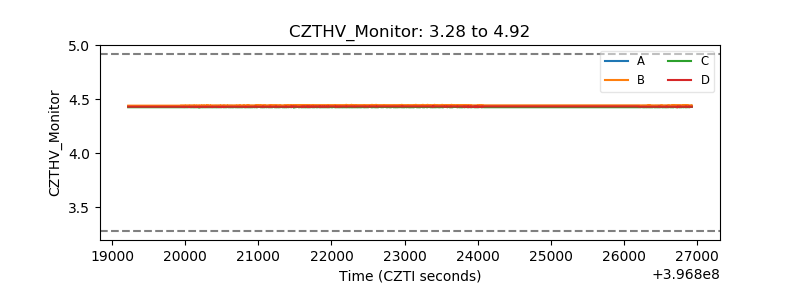 |
| D_VDD | 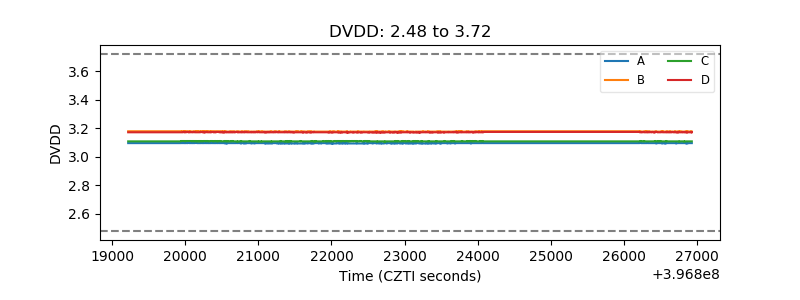 |
| Temperature 1 | 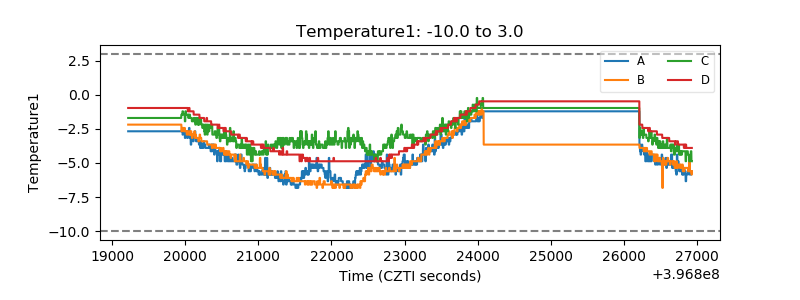 |
| Veto HV Monitor | 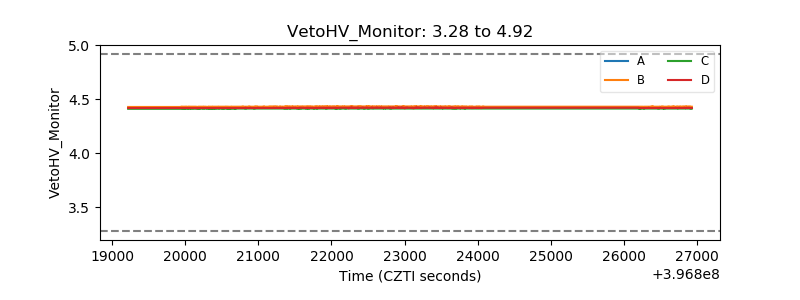 |
| Veto LLD | 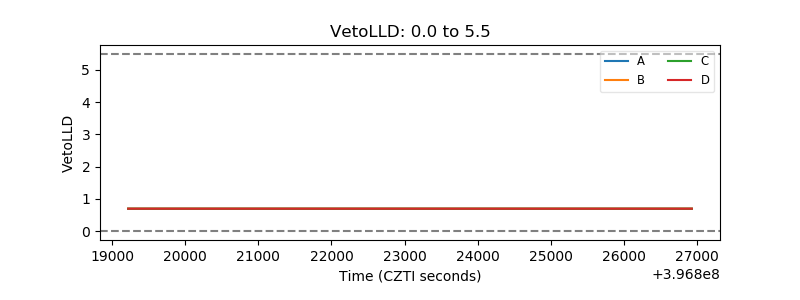 |
| Alpha Counter | 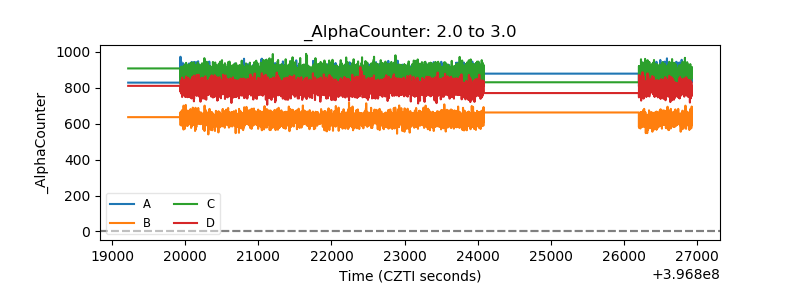 |
| _CPM_Rate | 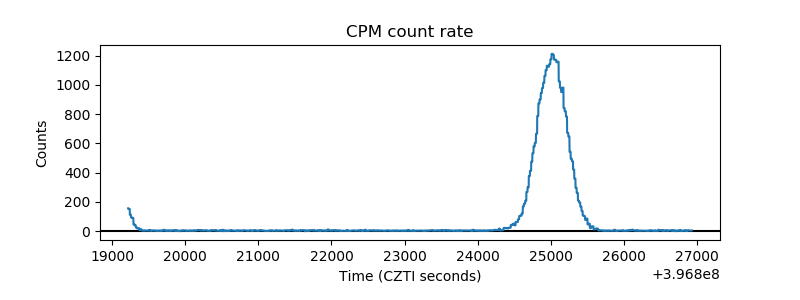 |
| CZT Counter | 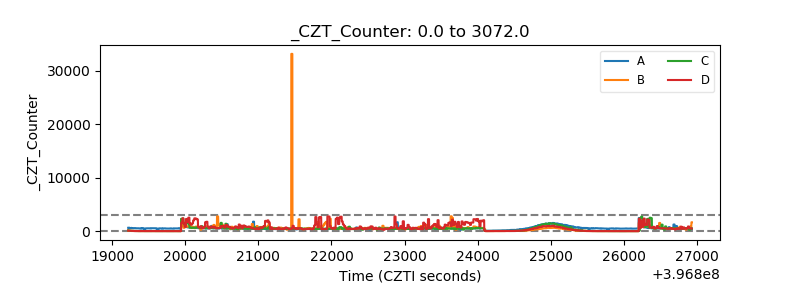 |
| +2.5 Volts monitor | 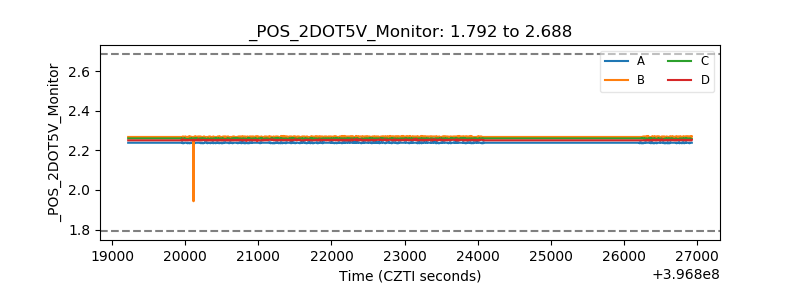 |
| +5 Volts monitor | 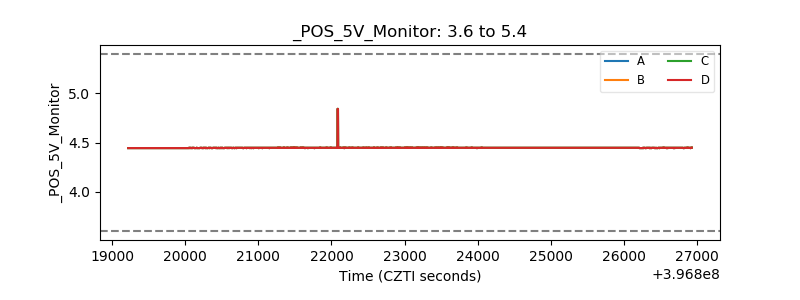 |
| _ROLL_ROT | 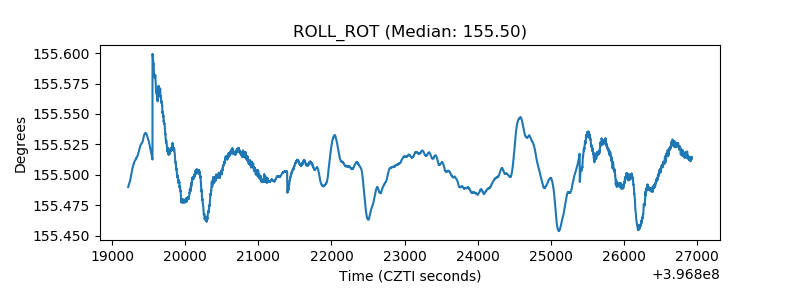 |
| _Roll_DEC | 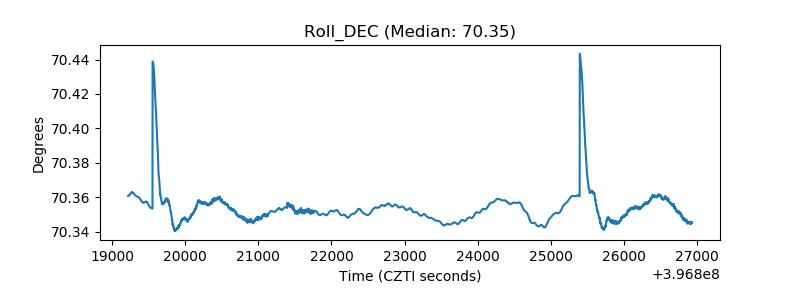 |
| _Roll_RA | 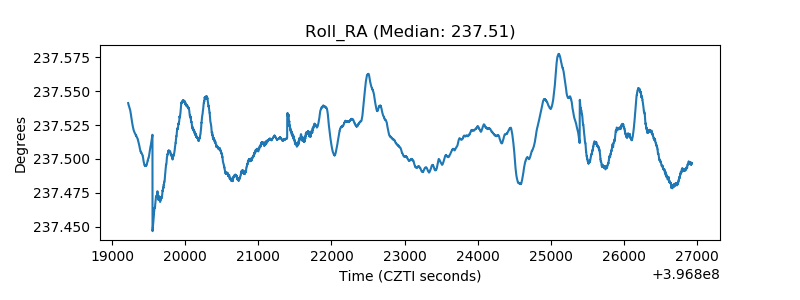 |
| Veto Counter | 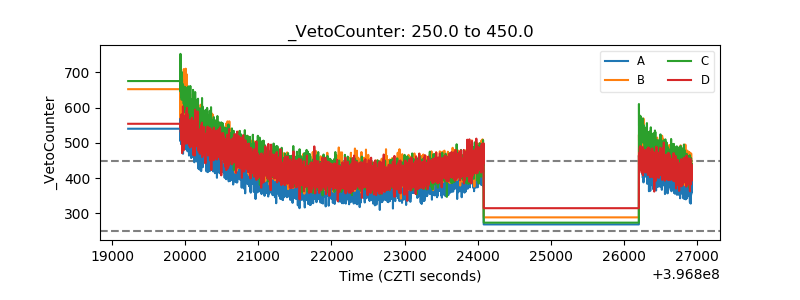 |