| Param | Original file | Final file |
|---|---|---|
| Filename | modeM0/AS1C07_001T10_9000005252_36958cztM0_level2.evt | modeM0/AS1C07_001T10_9000005252_36958cztM0_level2_quad_clean.evt |
| Size (bytes) | 399,634,560 | 84,165,120 |
| Size | 381.1 MB | 80.3 MB |
| Events in quadrant A | 2,382,372 | 557,231 |
| Events in quadrant B | 2,840,611 | 560,679 |
| Events in quadrant C | 2,916,558 | 558,454 |
| Events in quadrant D | 3,623,617 | 521,995 |
| Mode M0 | |||
|---|---|---|---|
| Quadrant | BADHDUFLAG | Total packets | Discarded packets |
| A | 0 | 10458 | 3 |
| B | 0 | 11792 | 2 |
| C | 0 | 11851 | 2 |
| D | 0 | 14398 | 2 |
| Mode SS | |||
|---|---|---|---|
| Quadrant | BADHDUFLAG | Total packets | Discarded packets |
| A | 0 | 102 | 0 |
| B | 0 | 102 | 0 |
| C | 0 | 102 | 0 |
| D | 0 | 102 | 0 |
| Mode M9 | |||
|---|---|---|---|
| Quadrant | BADHDUFLAG | Total packets | Discarded packets |
| A | 0 | 31 | 0 |
| B | 0 | 31 | 0 |
| C | 0 | 31 | 0 |
| D | 0 | 32 | 0 |
| Quadrant | Total seconds | Saturated seconds | Saturation percentage |
|---|---|---|---|
| A | 4996 | 15 | 0.300240% |
| B | 4996 | 89 | 1.781425% |
| C | 4996 | 113 | 2.261809% |
| D | 4996 | 361 | 7.225781% |
Noise dominated data is calculated using 1-second bins in cleaned event files. If a bin has >2000 counts, and if more than 50% of those come from <1% of pixels, then it is considered to be noise-dominated and hence unusable.
| Quadrant | # 1 sec bins | Bins with >0 counts | Bins with >2000 counts | High rate bins dominated by noise | Noise dominated (total time) | Noise dominated (detector-on time) | Marked lightcurve |
|---|---|---|---|---|---|---|---|
| A | 7059 | 4997 | 6 | 6 | 0.08% | 0.12% | 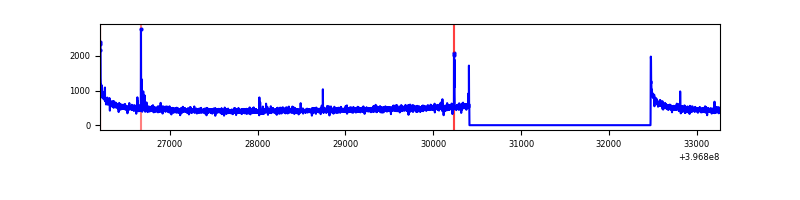 |
| B | 7059 | 4997 | 60 | 60 | 0.85% | 1.20% | 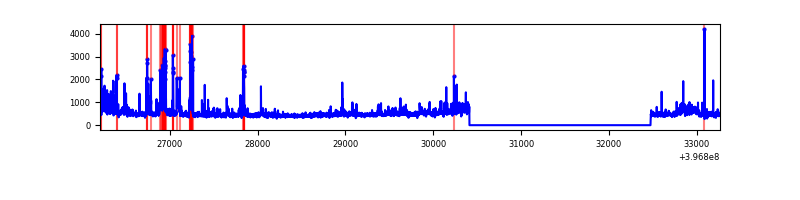 |
| C | 7059 | 4997 | 91 | 91 | 1.29% | 1.82% | 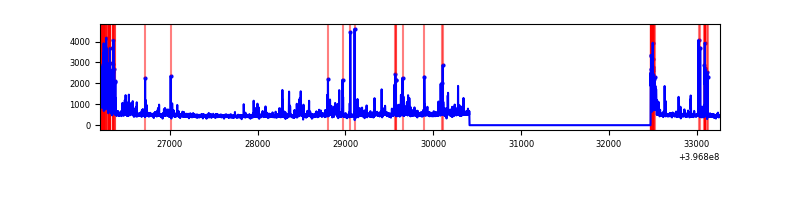 |
| D | 7059 | 4997 | 310 | 310 | 4.39% | 6.20% | 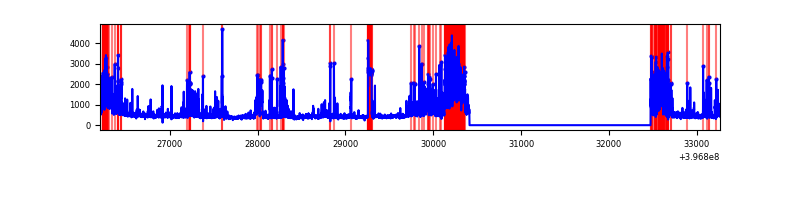 |
Top three noisy pixels from each quadrant. If the there are fewer than three noisy pixels in the level2.evt file, extra rows are filled as -1
| Pixel properties | Quadrant properties | ||||||
|---|---|---|---|---|---|---|---|
| Quadrant | DetID | PixID | Counts | Sigma | Mean | Median | Sigma |
| A | 10 | 83 | 227036 | 2066.93 | 544 | 535 | 109.6 |
| A | 13 | 6 | 15229 | 134.09 | 544 | 535 | 109.6 |
| A | 15 | 237 | 13354 | 116.98 | 544 | 535 | 109.6 |
| B | 5 | 184 | 163079 | 1576.27 | 543 | 531 | 103.1 |
| B | 0 | 221 | 103865 | 1002.06 | 543 | 531 | 103.1 |
| B | 4 | 171 | 73273 | 705.4 | 543 | 531 | 103.1 |
| C | 1 | 23 | 247140 | 1968.19 | 534 | 537 | 125.3 |
| C | 15 | 214 | 210666 | 1677.08 | 534 | 537 | 125.3 |
| C | 0 | 10 | 163694 | 1302.19 | 534 | 537 | 125.3 |
| D | 12 | 17 | 823207 | 6096.14 | 513 | 500 | 135.0 |
| D | 2 | 249 | 171525 | 1267.27 | 513 | 500 | 135.0 |
| D | 2 | 153 | 164412 | 1214.56 | 513 | 500 | 135.0 |
Histogram calculated using DETX and DETY for each event in the final _common_clean file
| Quadrant A |  |
 |
Quadrant B |
|---|---|---|---|
| Quadrant D |  |
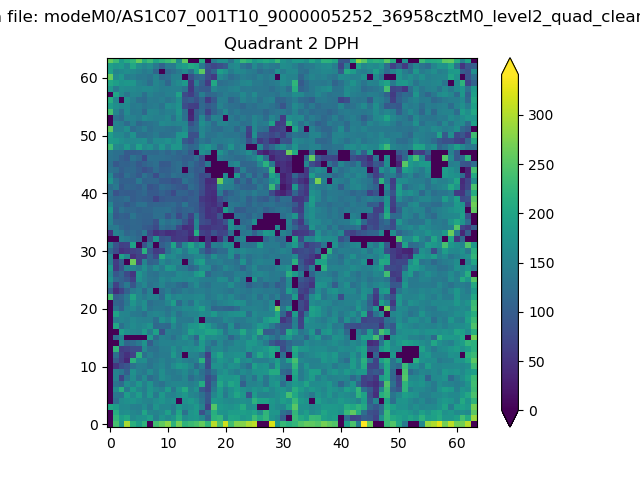 |
Quadrant C |
| Plot type | Count rate plots | Images |
|---|---|---|
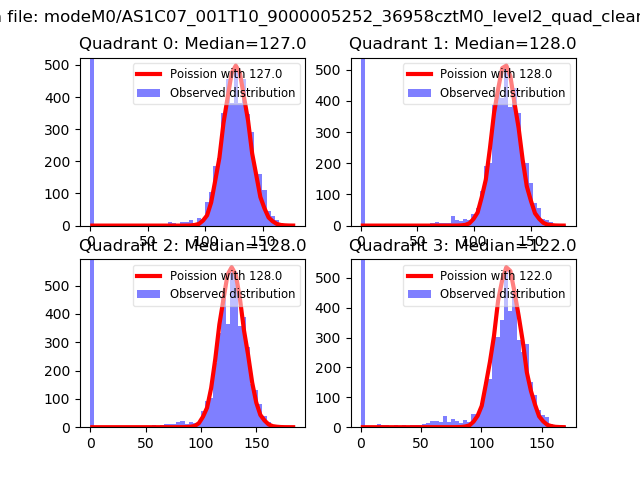
| Comparison with Poisson distribution Blue bars denote a histogram of data divided into 1 sec bins. Red curve is a Poisson curve with rate = median count rate of data. |
 |
 |
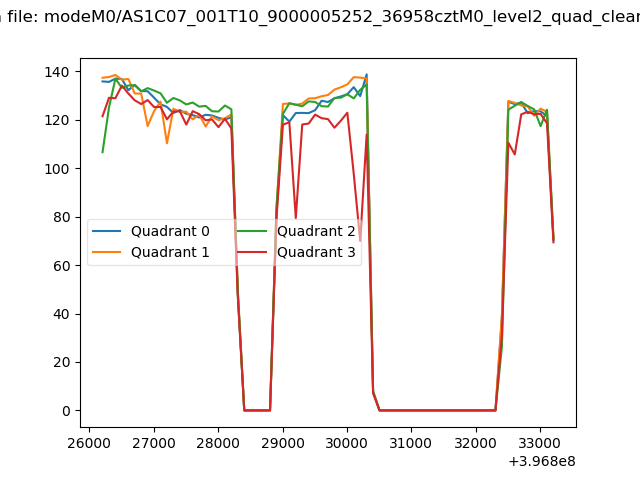
| Quadrant-wise count rates Data is divided into 100 sec bins |
 |
|
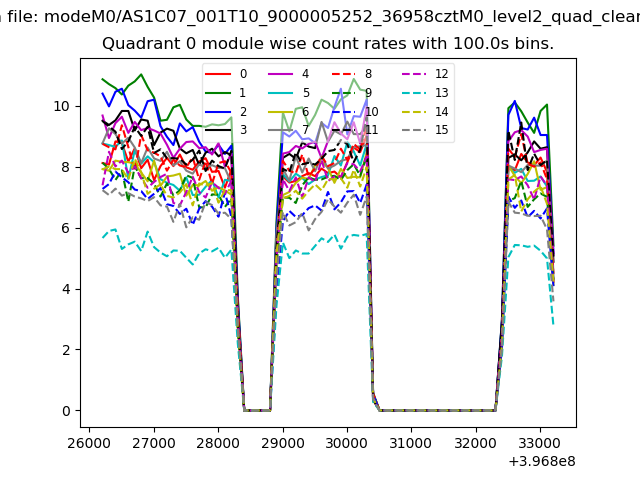
| Module-wise count rates for Quadrant A Data is divided into 100 sec bins |
 |
 |
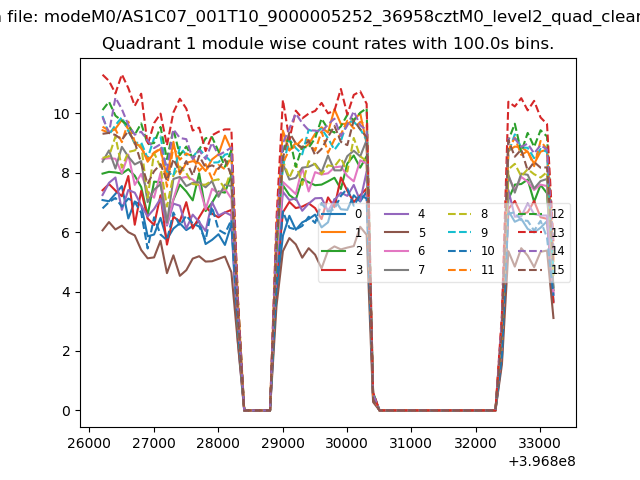
| Module-wise count rates for Quadrant B Data is divided into 100 sec bins |
 |
 |
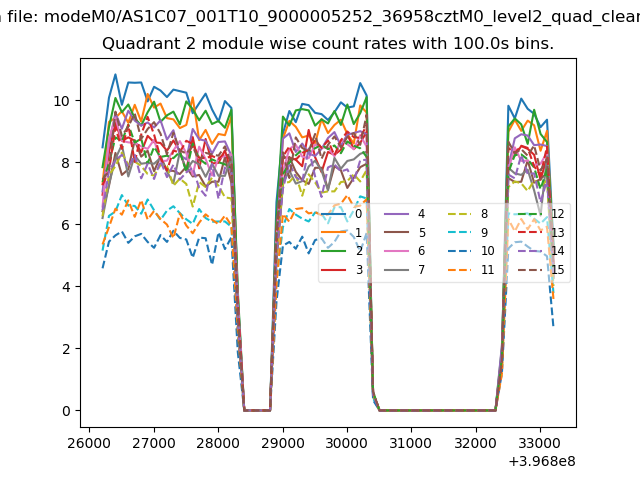
| Module-wise count rates for Quadrant C Data is divided into 100 sec bins |
 |
 |
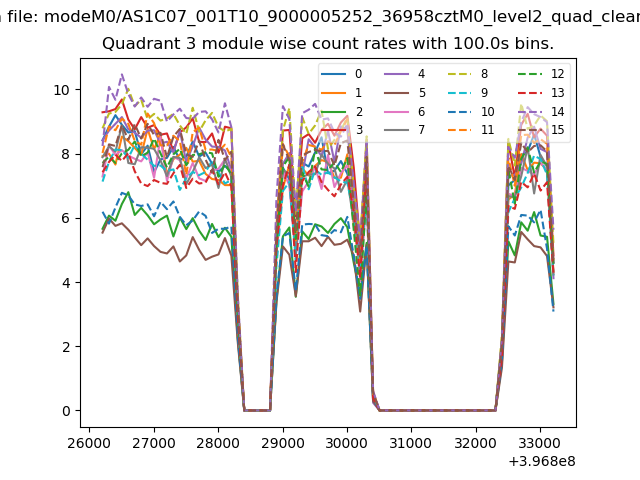
| Module-wise count rates for Quadrant D Data is divided into 100 sec bins |
 |
 |
| Parameter | Plot |
|---|---|
| CZT HV Monitor | 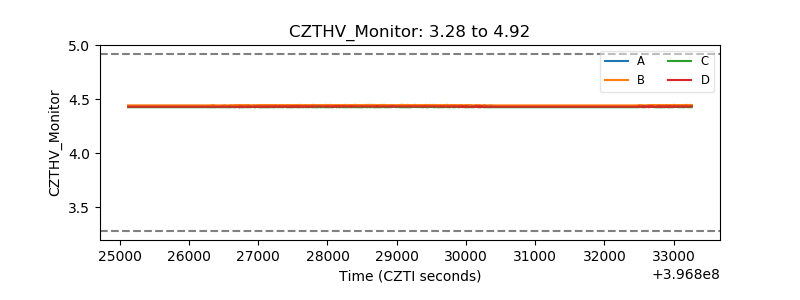 |
| D_VDD | 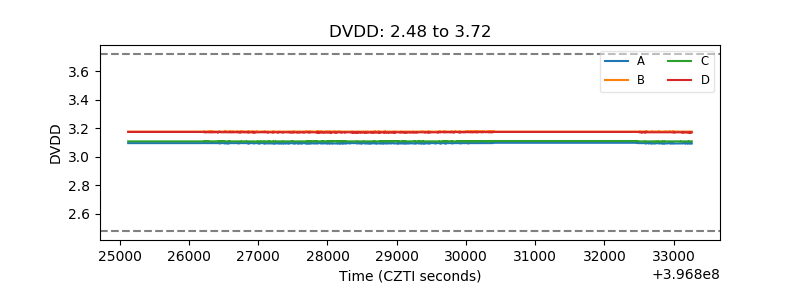 |
| Temperature 1 | 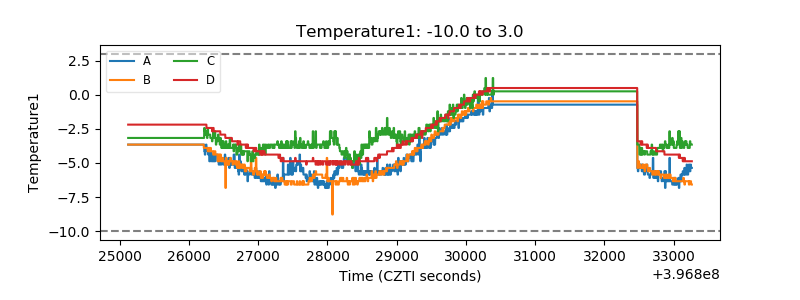 |
| Veto HV Monitor | 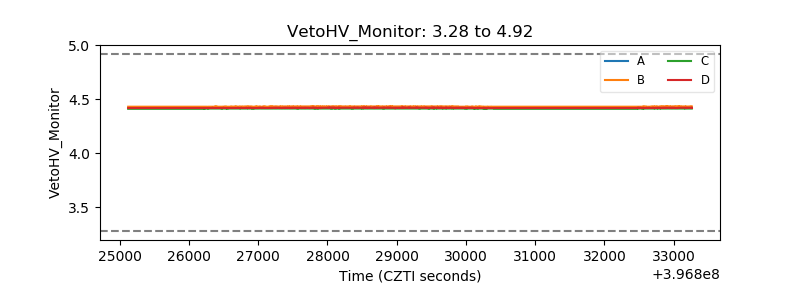 |
| Veto LLD | 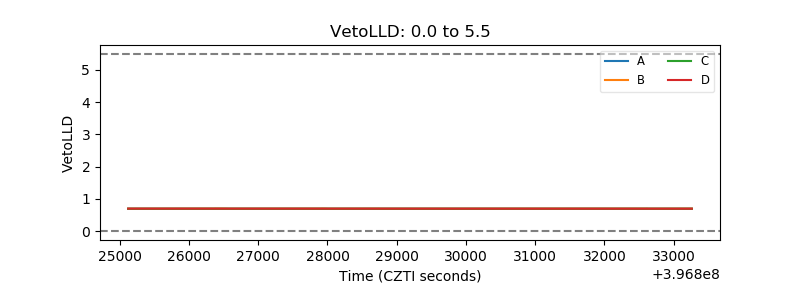 |
| Alpha Counter | 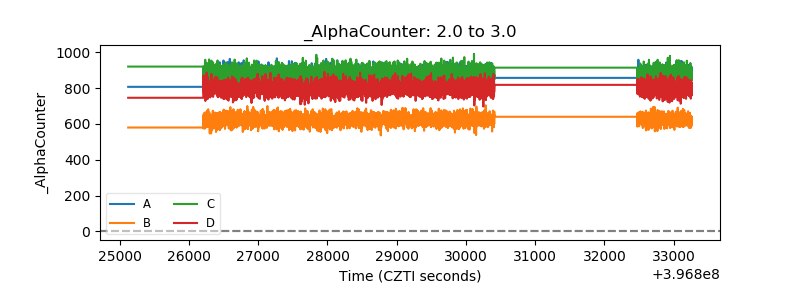 |
| _CPM_Rate | 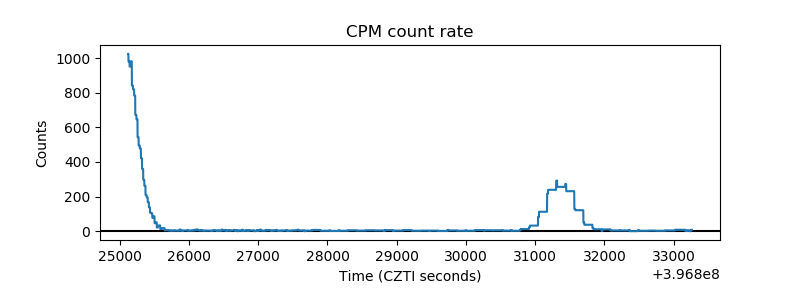 |
| CZT Counter | 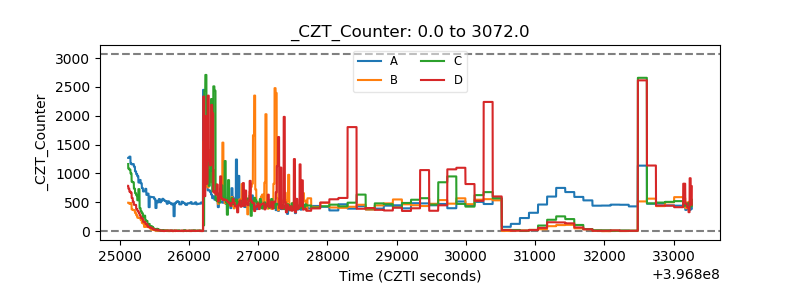 |
| +2.5 Volts monitor | 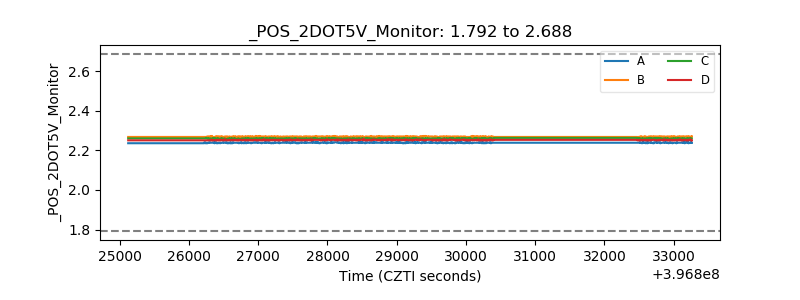 |
| +5 Volts monitor | 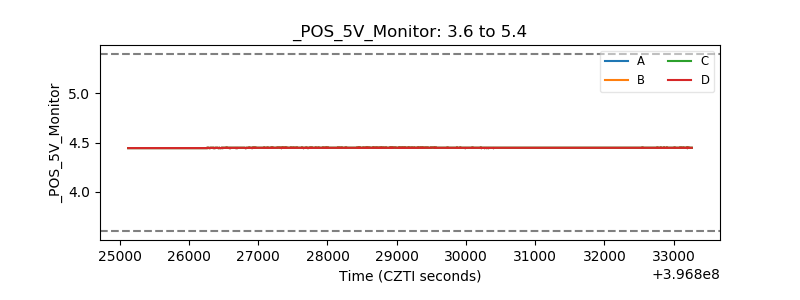 |
| _ROLL_ROT | 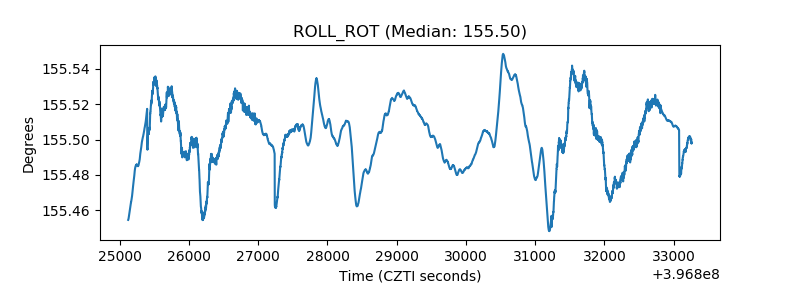 |
| _Roll_DEC | 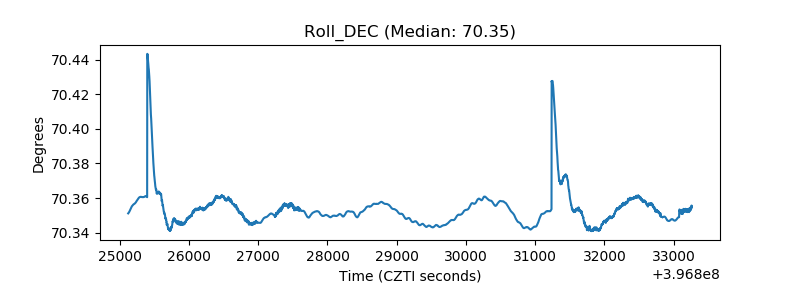 |
| _Roll_RA | 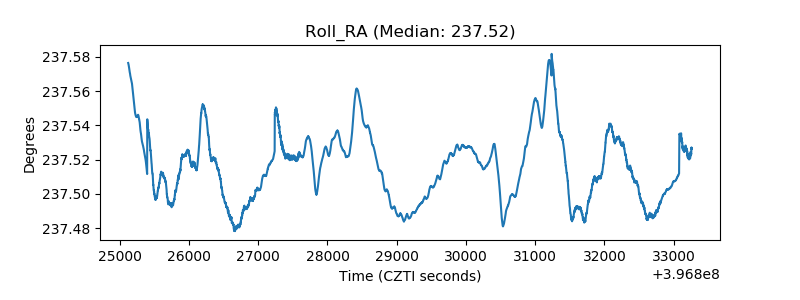 |
| Veto Counter | 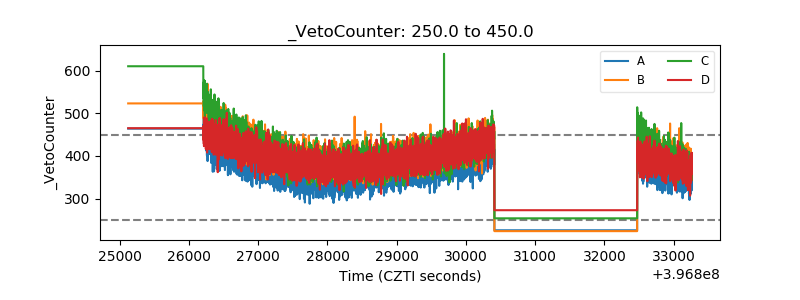 |