| Param | Original file | Final file |
|---|---|---|
| Filename | modeM0/AS1C07_001T10_9000005252_36959cztM0_level2.evt | modeM0/AS1C07_001T10_9000005252_36959cztM0_level2_quad_clean.evt |
| Size (bytes) | 398,566,080 | 86,693,760 |
| Size | 380.1 MB | 82.7 MB |
| Events in quadrant A | 2,487,349 | 571,760 |
| Events in quadrant B | 2,904,694 | 571,743 |
| Events in quadrant C | 3,129,165 | 564,439 |
| Events in quadrant D | 3,190,317 | 547,569 |
| Mode M0 | |||
|---|---|---|---|
| Quadrant | BADHDUFLAG | Total packets | Discarded packets |
| A | 0 | 10966 | 3 |
| B | 0 | 12175 | 2 |
| C | 0 | 12731 | 2 |
| D | 0 | 13362 | 2 |
| Mode SS | |||
|---|---|---|---|
| Quadrant | BADHDUFLAG | Total packets | Discarded packets |
| A | 0 | 108 | 0 |
| B | 0 | 108 | 0 |
| C | 0 | 108 | 0 |
| D | 0 | 108 | 0 |
| Mode M9 | |||
|---|---|---|---|
| Quadrant | BADHDUFLAG | Total packets | Discarded packets |
| A | 0 | 31 | 0 |
| B | 0 | 31 | 0 |
| C | 0 | 31 | 0 |
| D | 0 | 32 | 0 |
| Quadrant | Total seconds | Saturated seconds | Saturation percentage |
|---|---|---|---|
| A | 5279 | 12 | 0.227316% |
| B | 5279 | 42 | 0.795605% |
| C | 5279 | 124 | 2.348930% |
| D | 5279 | 179 | 3.390794% |
Noise dominated data is calculated using 1-second bins in cleaned event files. If a bin has >2000 counts, and if more than 50% of those come from <1% of pixels, then it is considered to be noise-dominated and hence unusable.
| Quadrant | # 1 sec bins | Bins with >0 counts | Bins with >2000 counts | High rate bins dominated by noise | Noise dominated (total time) | Noise dominated (detector-on time) | Marked lightcurve |
|---|---|---|---|---|---|---|---|
| A | 7102 | 5280 | 1 | 1 | 0.01% | 0.02% | 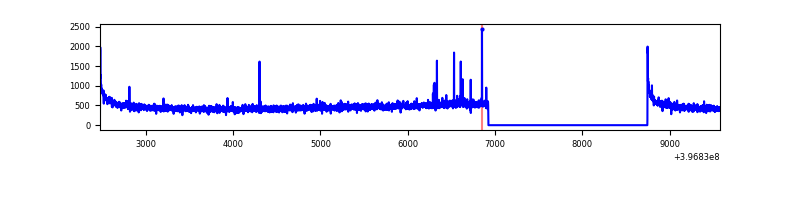 |
| B | 7102 | 5280 | 14 | 14 | 0.20% | 0.27% | 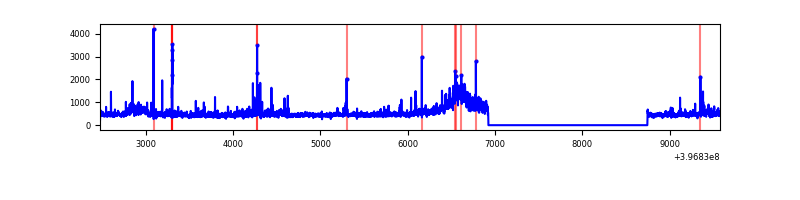 |
| C | 7102 | 5280 | 108 | 108 | 1.52% | 2.05% | 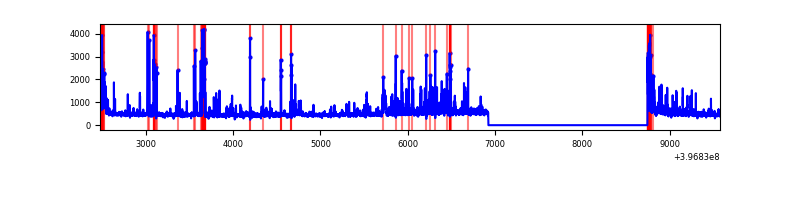 |
| D | 7102 | 5280 | 153 | 153 | 2.15% | 2.90% | 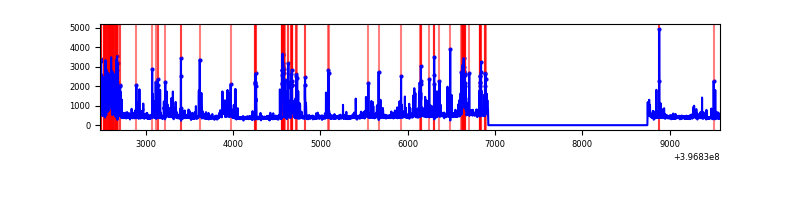 |
Top three noisy pixels from each quadrant. If the there are fewer than three noisy pixels in the level2.evt file, extra rows are filled as -1
| Pixel properties | Quadrant properties | ||||||
|---|---|---|---|---|---|---|---|
| Quadrant | DetID | PixID | Counts | Sigma | Mean | Median | Sigma |
| A | 10 | 83 | 236882 | 2042.79 | 569 | 557 | 115.7 |
| A | 13 | 6 | 16133 | 134.64 | 569 | 557 | 115.7 |
| A | 13 | 248 | 10834 | 88.83 | 569 | 557 | 115.7 |
| B | 0 | 189 | 148983 | 1387.97 | 568 | 554 | 106.9 |
| B | 0 | 221 | 109369 | 1017.53 | 568 | 554 | 106.9 |
| B | 5 | 184 | 96767 | 899.69 | 568 | 554 | 106.9 |
| C | 1 | 23 | 281910 | 2200.86 | 551 | 555 | 127.8 |
| C | 0 | 10 | 239894 | 1872.19 | 551 | 555 | 127.8 |
| C | 15 | 214 | 224709 | 1753.41 | 551 | 555 | 127.8 |
| D | 12 | 17 | 471486 | 3490.7 | 550 | 534 | 134.9 |
| D | 2 | 250 | 148447 | 1096.33 | 550 | 534 | 134.9 |
| D | 2 | 153 | 130686 | 964.68 | 550 | 534 | 134.9 |
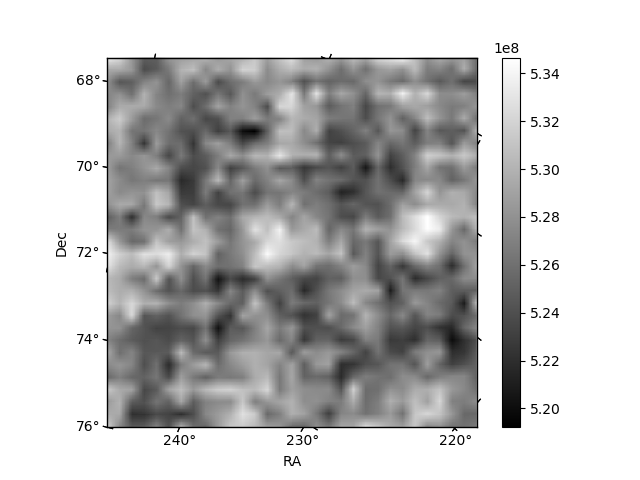
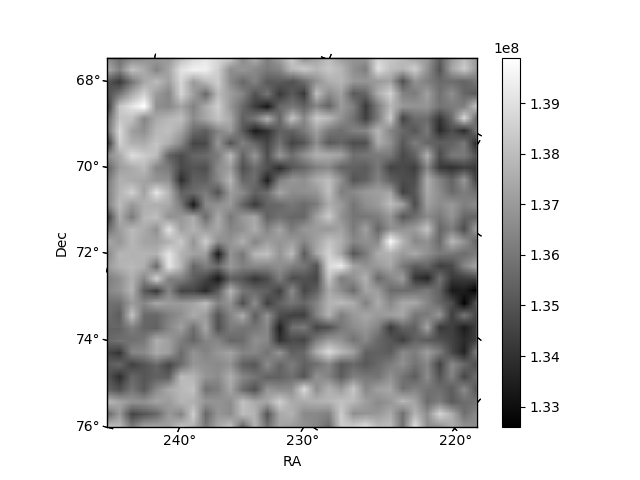
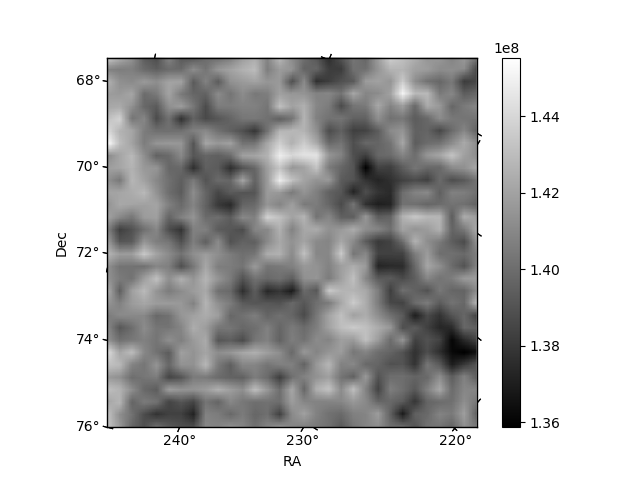
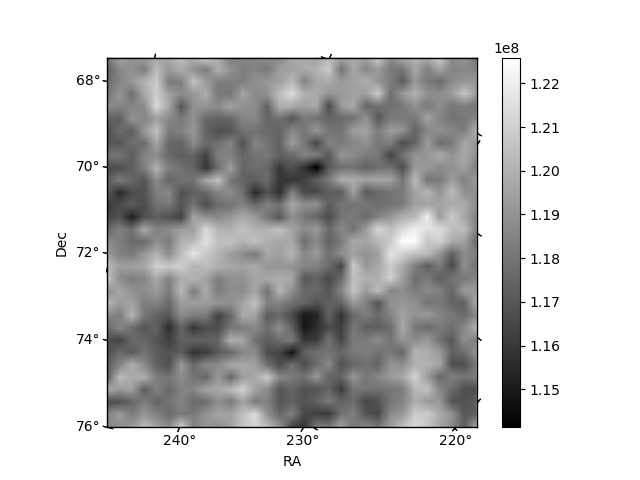
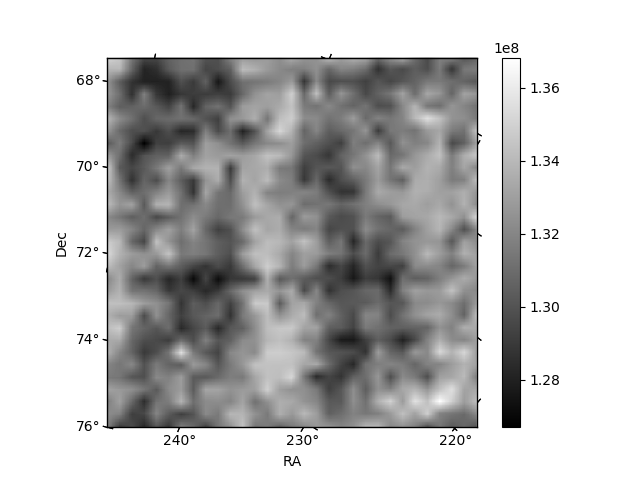
Histogram calculated using DETX and DETY for each event in the final _common_clean file
| Quadrant A | 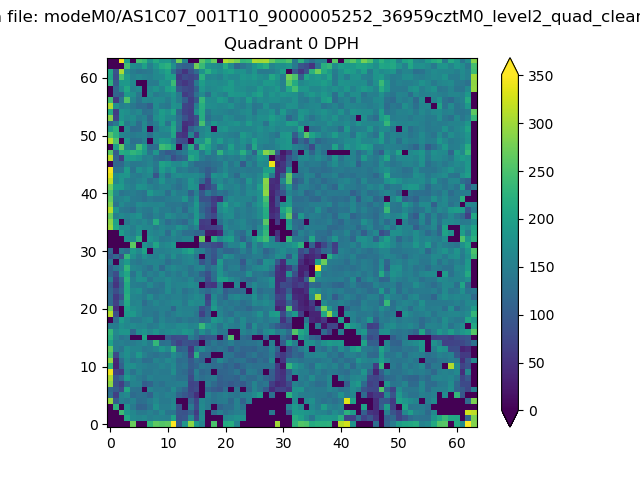 |
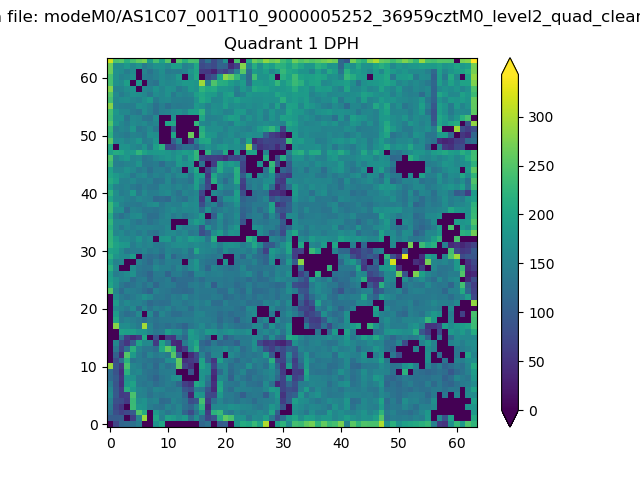 |
Quadrant B |
|---|---|---|---|
| Quadrant D | 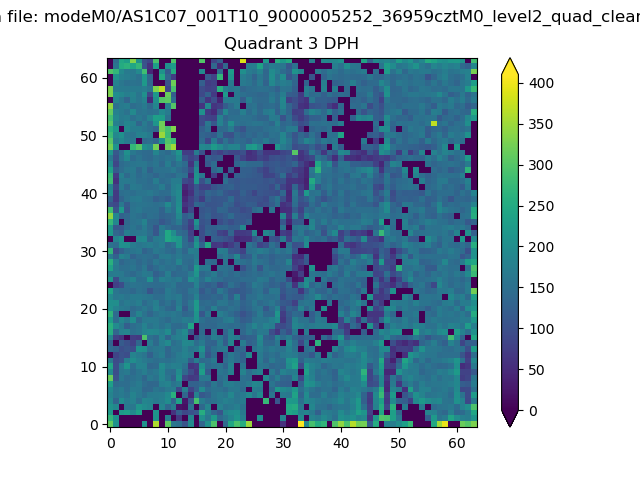 |
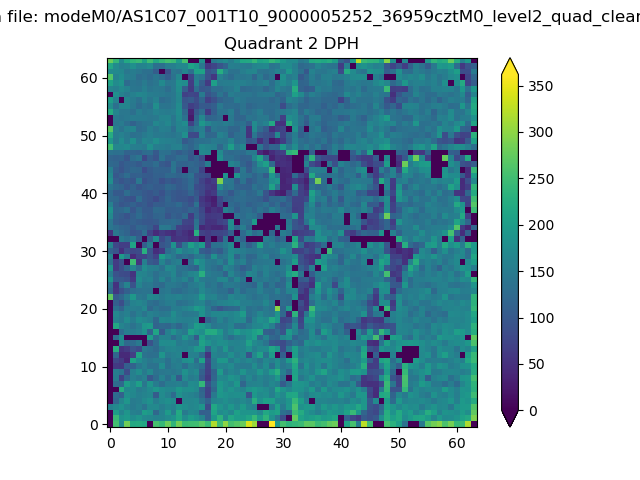 |
Quadrant C |
| Plot type | Count rate plots | Images |
|---|---|---|
| Comparison with Poisson distribution Blue bars denote a histogram of data divided into 1 sec bins. Red curve is a Poisson curve with rate = median count rate of data. |
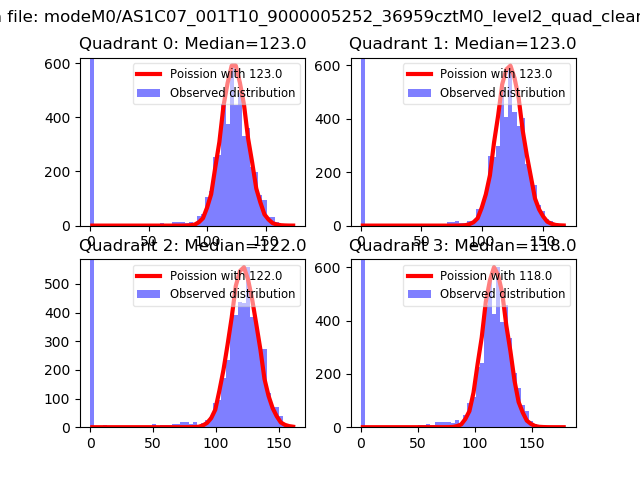 |
 |
| Quadrant-wise count rates Data is divided into 100 sec bins |
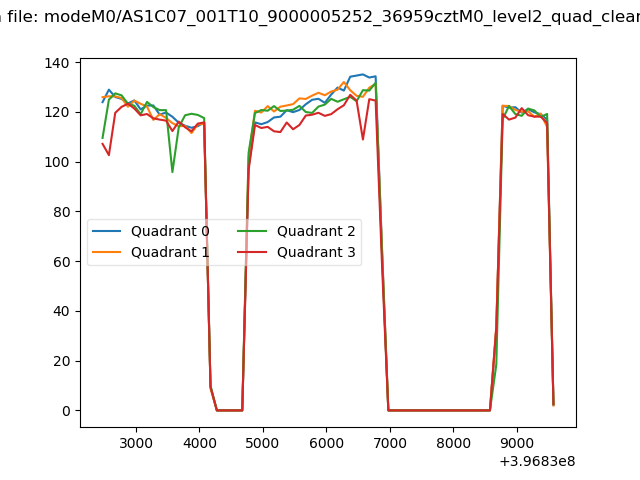 |
|
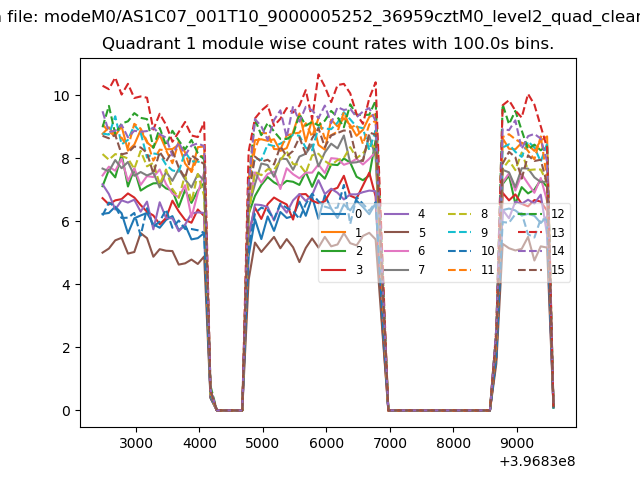
| Module-wise count rates for Quadrant A Data is divided into 100 sec bins |
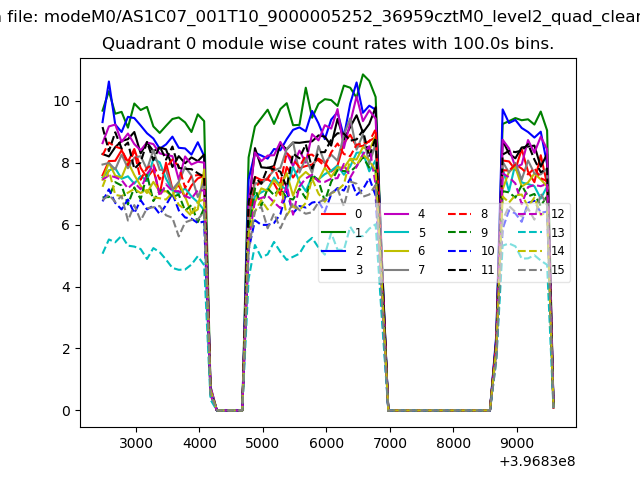 |
 |
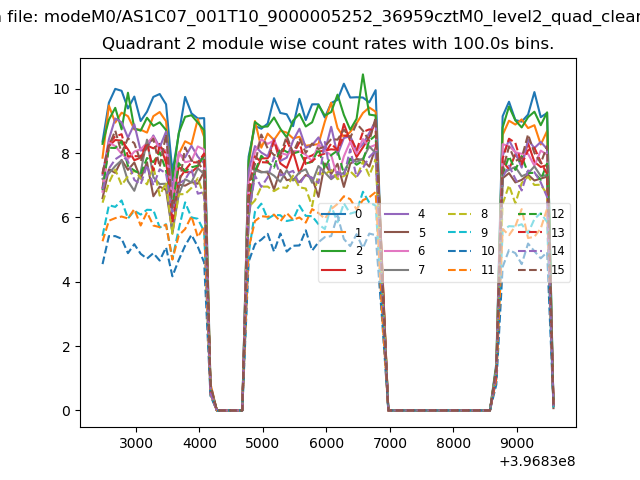
| Module-wise count rates for Quadrant B Data is divided into 100 sec bins |
 |
 |
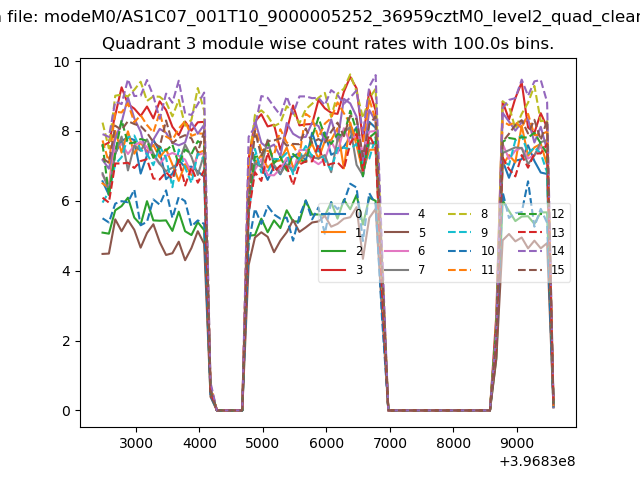
| Module-wise count rates for Quadrant C Data is divided into 100 sec bins |
 |
 |
| Module-wise count rates for Quadrant D Data is divided into 100 sec bins |
 |
 |
| Parameter | Plot |
|---|---|
| CZT HV Monitor | 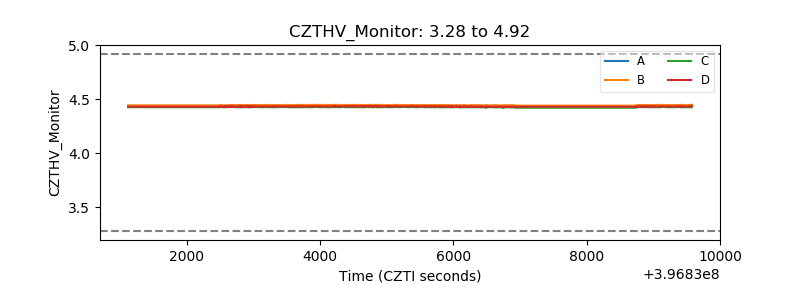 |
| D_VDD | 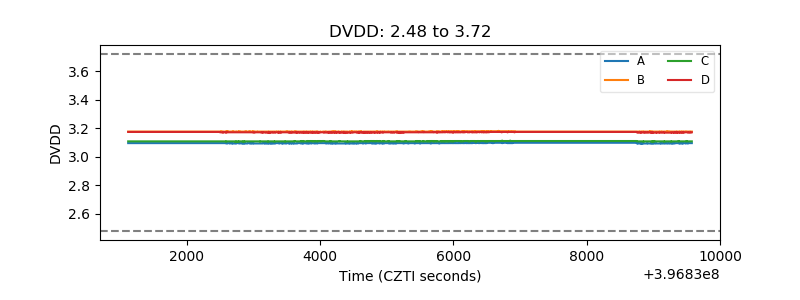 |
| Temperature 1 | 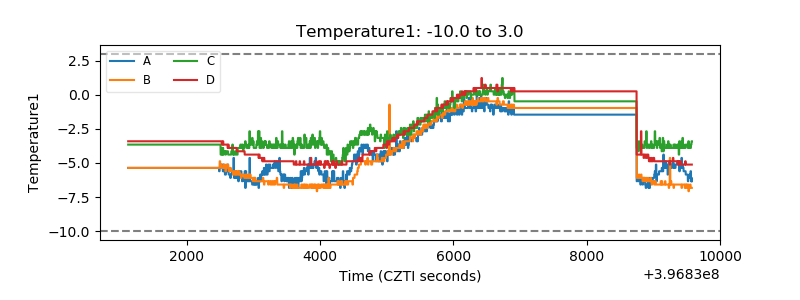 |
| Veto HV Monitor | 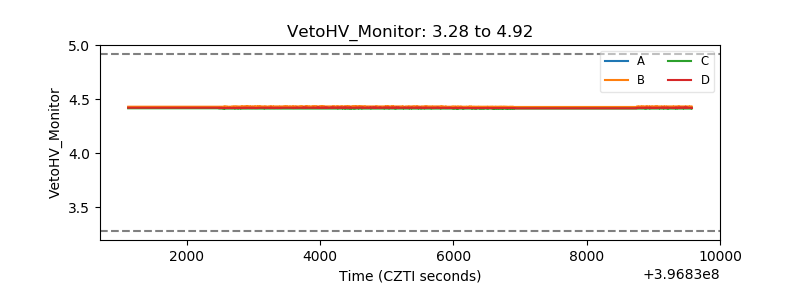 |
| Veto LLD | 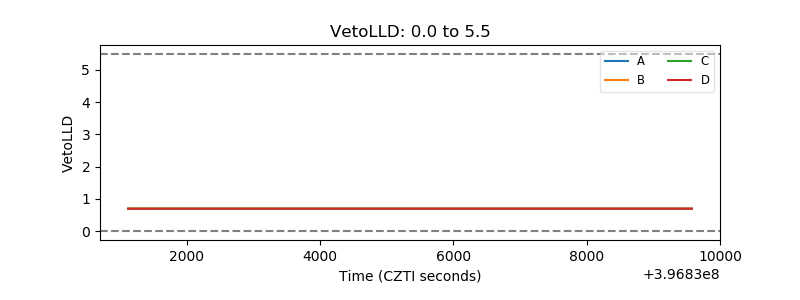 |
| Alpha Counter | 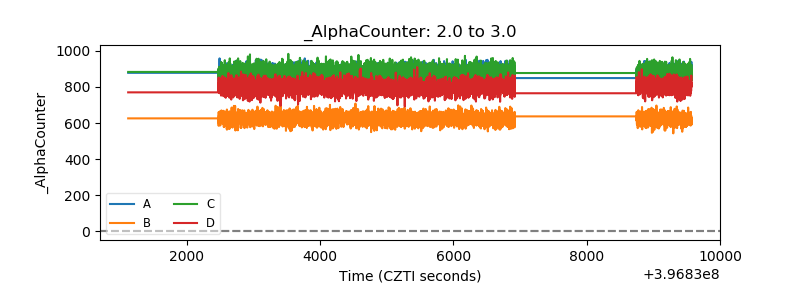 |
| _CPM_Rate | 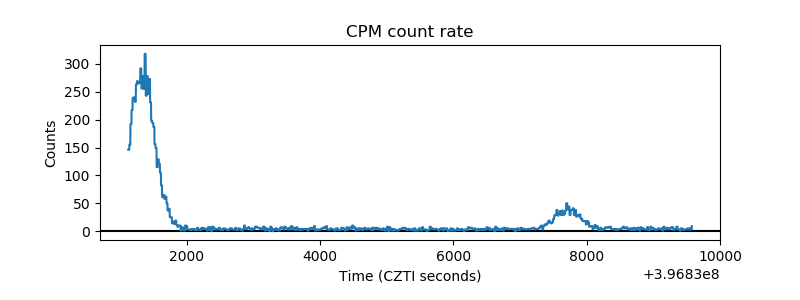 |
| CZT Counter | 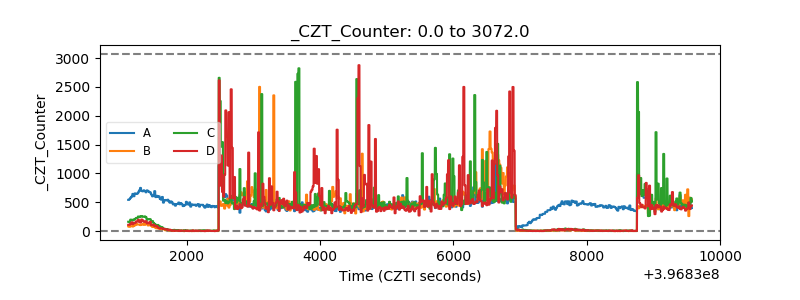 |
| +2.5 Volts monitor | 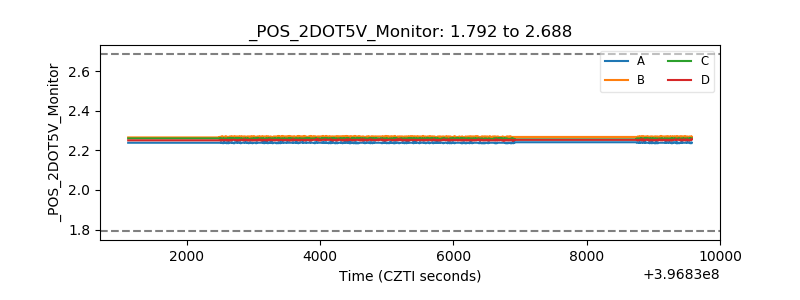 |
| +5 Volts monitor | 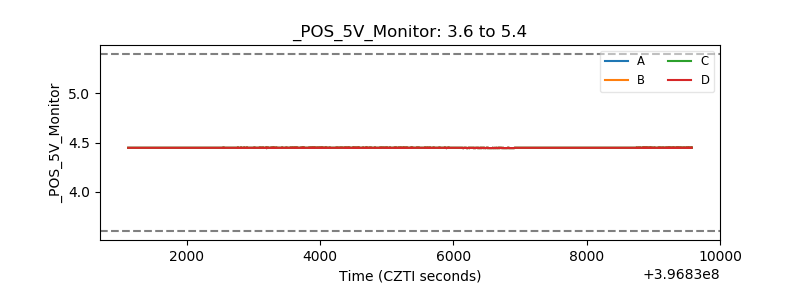 |
| _ROLL_ROT | 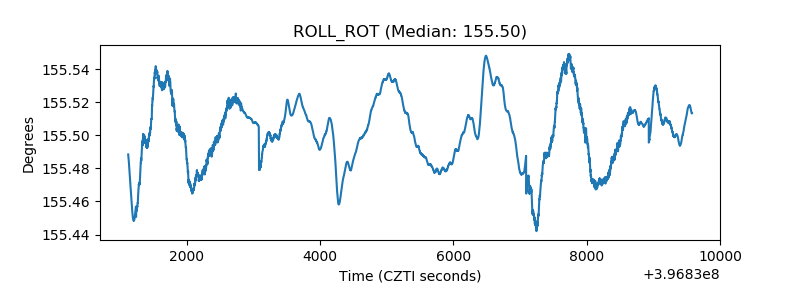 |
| _Roll_DEC | 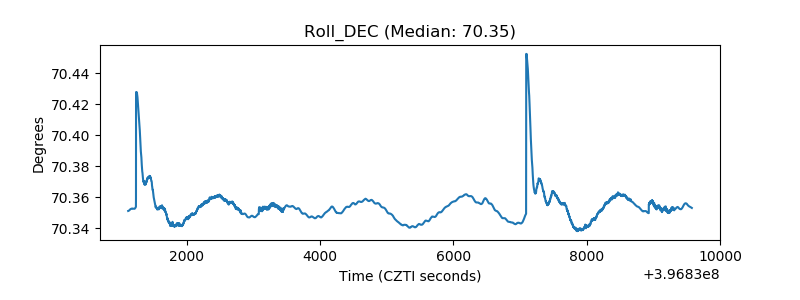 |
| _Roll_RA | 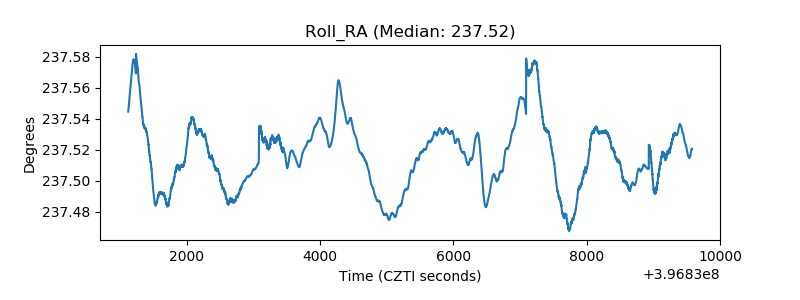 |
| Veto Counter | 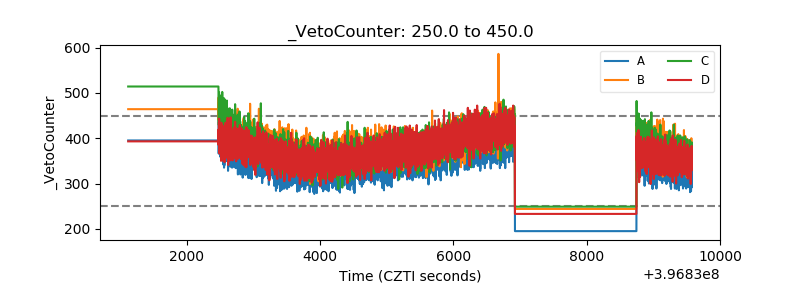 |