| Param | Original file | Final file |
|---|---|---|
| Filename | modeM0/AS1C07_001T10_9000005252_36960cztM0_level2.evt | modeM0/AS1C07_001T10_9000005252_36960cztM0_level2_quad_clean.evt |
| Size (bytes) | 432,322,560 | 92,522,880 |
| Size | 412.3 MB | 88.2 MB |
| Events in quadrant A | 2,823,145 | 603,954 |
| Events in quadrant B | 3,041,771 | 604,354 |
| Events in quadrant C | 3,257,200 | 602,101 |
| Events in quadrant D | 3,574,665 | 584,133 |
| Mode M0 | |||
|---|---|---|---|
| Quadrant | BADHDUFLAG | Total packets | Discarded packets |
| A | 0 | 12327 | 3 |
| B | 0 | 12812 | 2 |
| C | 0 | 13377 | 2 |
| D | 0 | 14730 | 2 |
| Mode SS | |||
|---|---|---|---|
| Quadrant | BADHDUFLAG | Total packets | Discarded packets |
| A | 0 | 120 | 0 |
| B | 0 | 120 | 0 |
| C | 0 | 120 | 0 |
| D | 0 | 120 | 0 |
| Mode M9 | |||
|---|---|---|---|
| Quadrant | BADHDUFLAG | Total packets | Discarded packets |
| A | 0 | 30 | 0 |
| B | 0 | 30 | 0 |
| C | 0 | 30 | 0 |
| D | 0 | 31 | 0 |
| Quadrant | Total seconds | Saturated seconds | Saturation percentage |
|---|---|---|---|
| A | 5824 | 42 | 0.721154% |
| B | 5824 | 28 | 0.480769% |
| C | 5824 | 77 | 1.322115% |
| D | 5824 | 163 | 2.798764% |
Noise dominated data is calculated using 1-second bins in cleaned event files. If a bin has >2000 counts, and if more than 50% of those come from <1% of pixels, then it is considered to be noise-dominated and hence unusable.
| Quadrant | # 1 sec bins | Bins with >0 counts | Bins with >2000 counts | High rate bins dominated by noise | Noise dominated (total time) | Noise dominated (detector-on time) | Marked lightcurve |
|---|---|---|---|---|---|---|---|
| A | 7317 | 5825 | 27 | 27 | 0.37% | 0.46% | 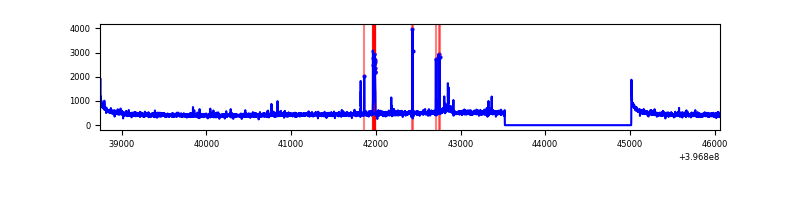 |
| B | 7317 | 5825 | 9 | 9 | 0.12% | 0.15% | 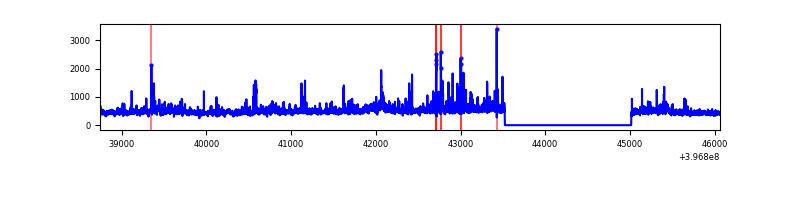 |
| C | 7317 | 5825 | 56 | 56 | 0.77% | 0.96% | 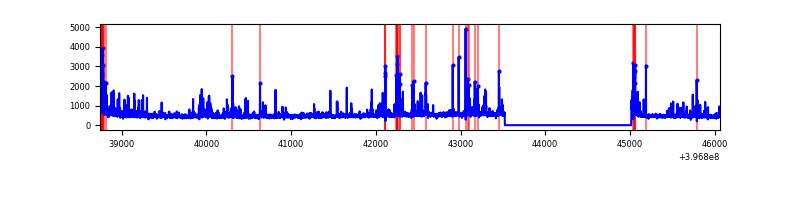 |
| D | 7317 | 5825 | 148 | 148 | 2.02% | 2.54% | 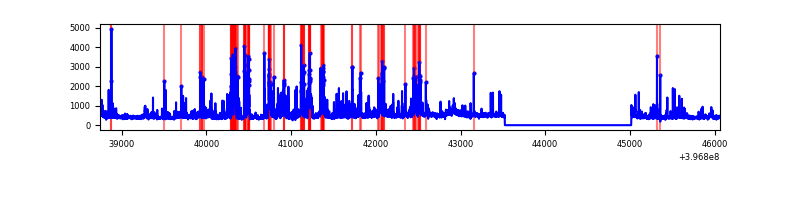 |
Top three noisy pixels from each quadrant. If the there are fewer than three noisy pixels in the level2.evt file, extra rows are filled as -1
| Pixel properties | Quadrant properties | ||||||
|---|---|---|---|---|---|---|---|
| Quadrant | DetID | PixID | Counts | Sigma | Mean | Median | Sigma |
| A | 10 | 83 | 249259 | 1940.73 | 628 | 616 | 128.1 |
| A | 15 | 174 | 65488 | 506.35 | 628 | 616 | 128.1 |
| A | 15 | 237 | 37137 | 285.06 | 628 | 616 | 128.1 |
| B | 0 | 221 | 83224 | 693.33 | 626 | 610 | 119.2 |
| B | 0 | 155 | 77467 | 645.02 | 626 | 610 | 119.2 |
| B | 0 | 219 | 62395 | 518.53 | 626 | 610 | 119.2 |
| C | 15 | 214 | 251819 | 1742.69 | 615 | 619 | 144.1 |
| C | 14 | 254 | 245224 | 1696.94 | 615 | 619 | 144.1 |
| C | 0 | 10 | 225743 | 1561.79 | 615 | 619 | 144.1 |
| D | 12 | 17 | 749000 | 4998.48 | 613 | 596 | 149.7 |
| D | 2 | 250 | 178910 | 1190.93 | 613 | 596 | 149.7 |
| D | 2 | 249 | 76993 | 510.24 | 613 | 596 | 149.7 |
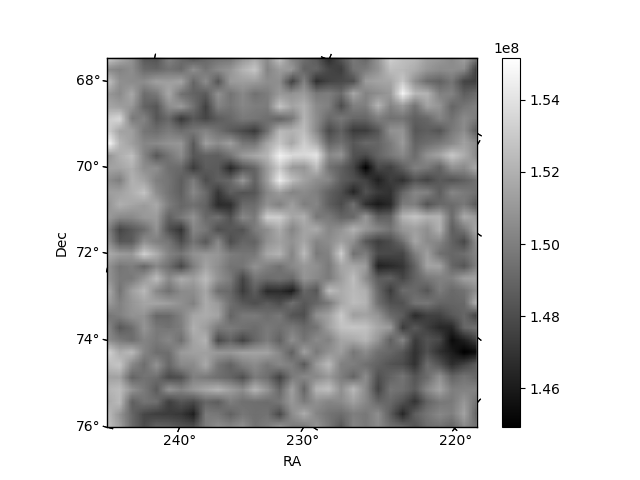
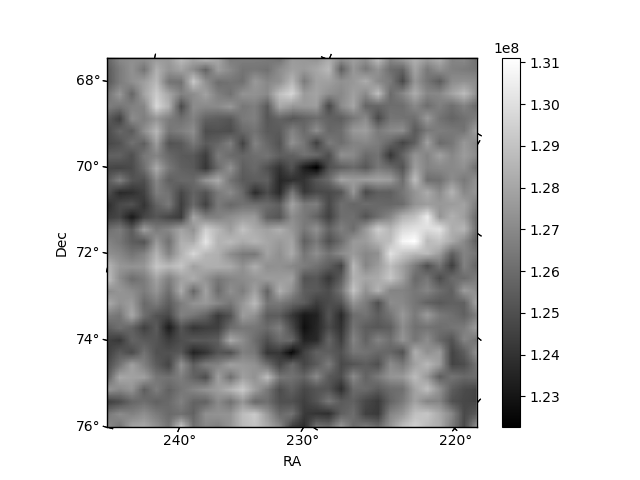
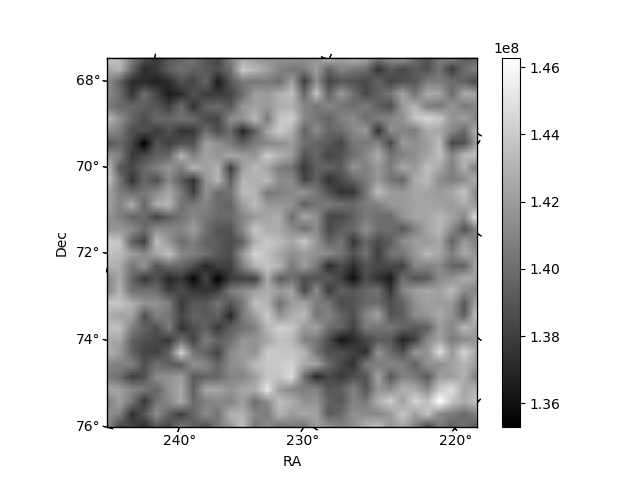
Histogram calculated using DETX and DETY for each event in the final _common_clean file
| Quadrant A | 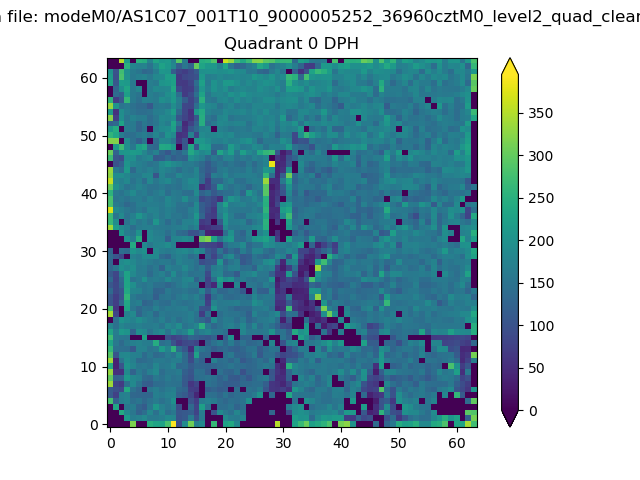 |
 |
Quadrant B |
|---|---|---|---|
| Quadrant D |  |
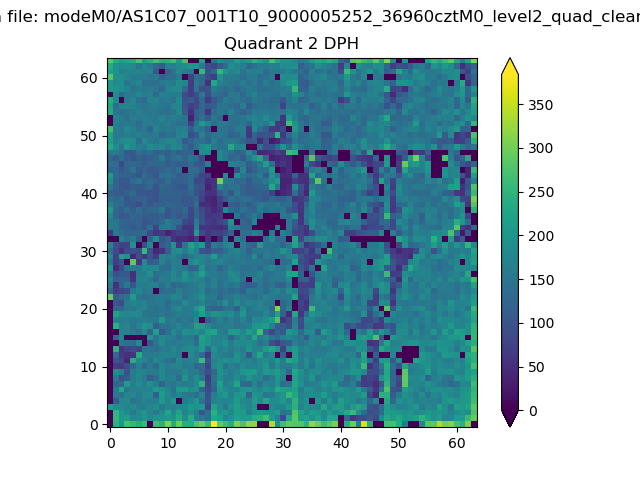 |
Quadrant C |
| Plot type | Count rate plots | Images |
|---|---|---|
| Comparison with Poisson distribution Blue bars denote a histogram of data divided into 1 sec bins. Red curve is a Poisson curve with rate = median count rate of data. |
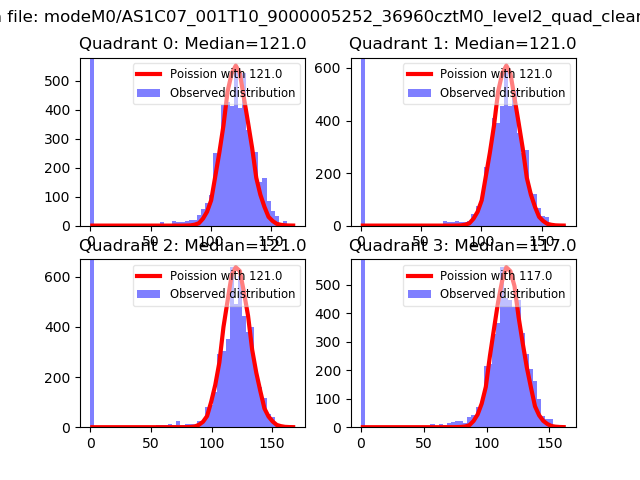 |
 |
| Quadrant-wise count rates Data is divided into 100 sec bins |
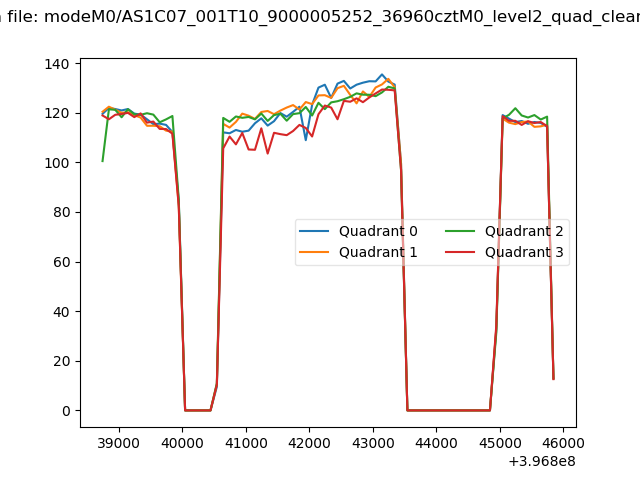 |
|
| Module-wise count rates for Quadrant A Data is divided into 100 sec bins |
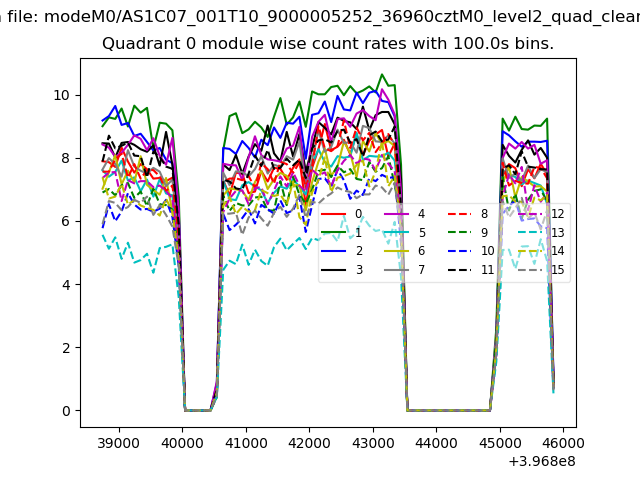 |
 |
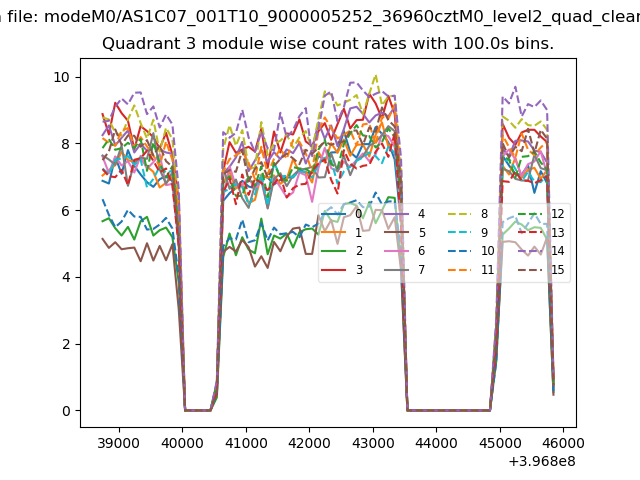
| Module-wise count rates for Quadrant B Data is divided into 100 sec bins |
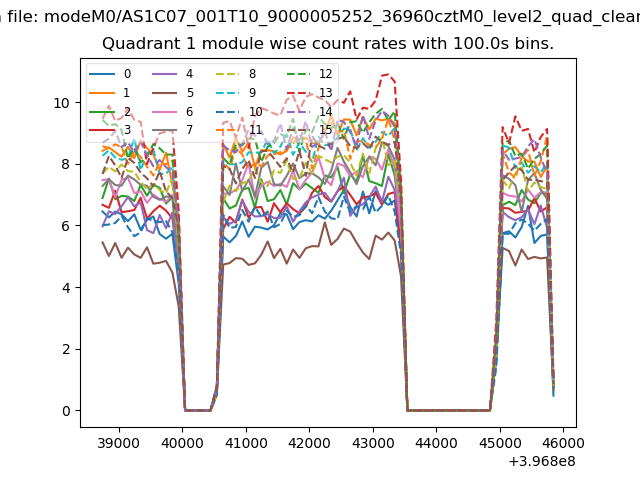 |
 |
| Module-wise count rates for Quadrant C Data is divided into 100 sec bins |
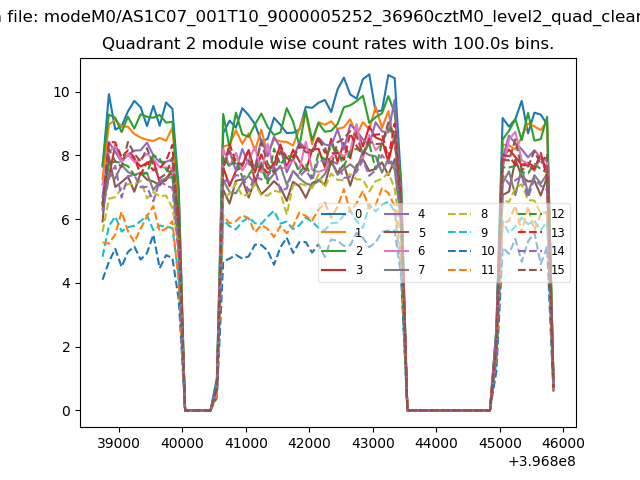 |
 |
| Module-wise count rates for Quadrant D Data is divided into 100 sec bins |
 |
 |
| Parameter | Plot |
|---|---|
| CZT HV Monitor | 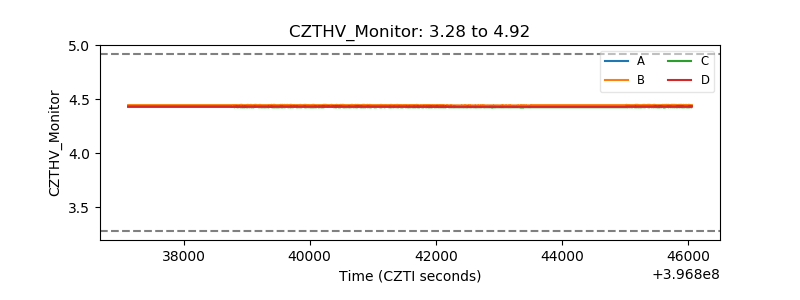 |
| D_VDD | 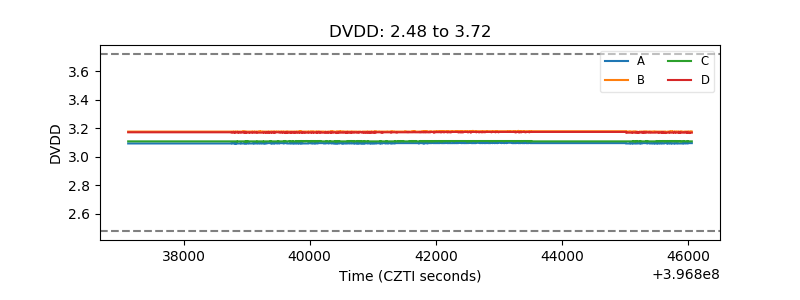 |
| Temperature 1 | 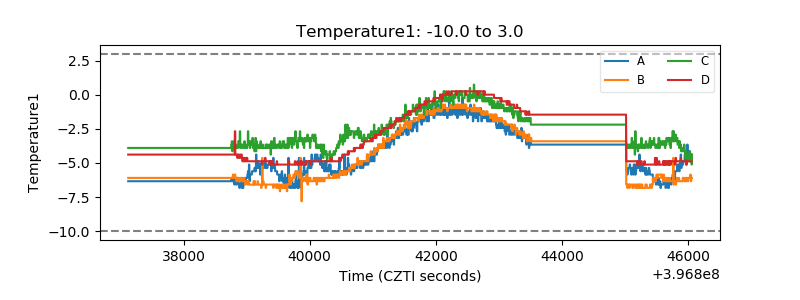 |
| Veto HV Monitor | 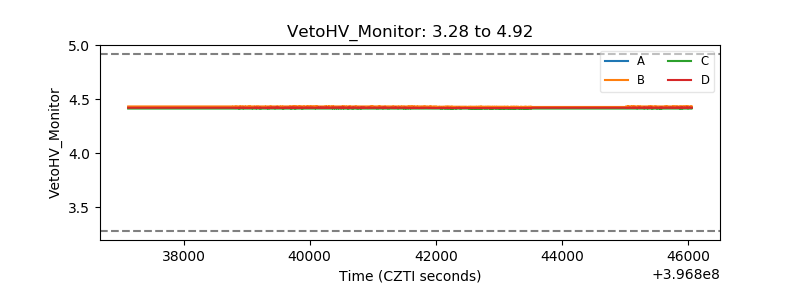 |
| Veto LLD | 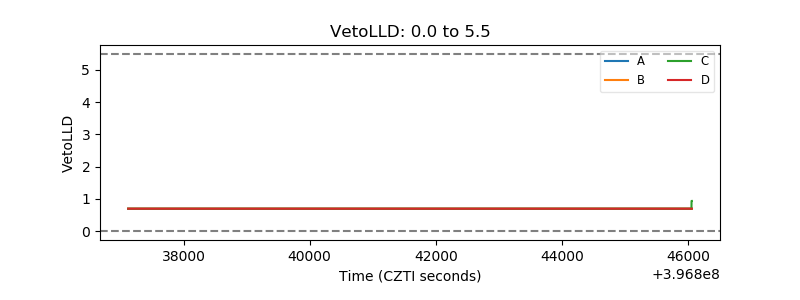 |
| Alpha Counter | 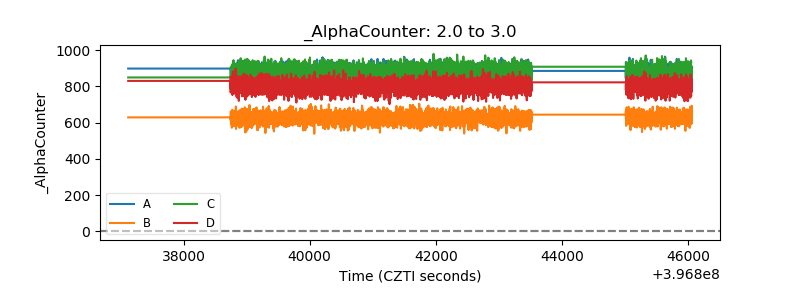 |
| _CPM_Rate | 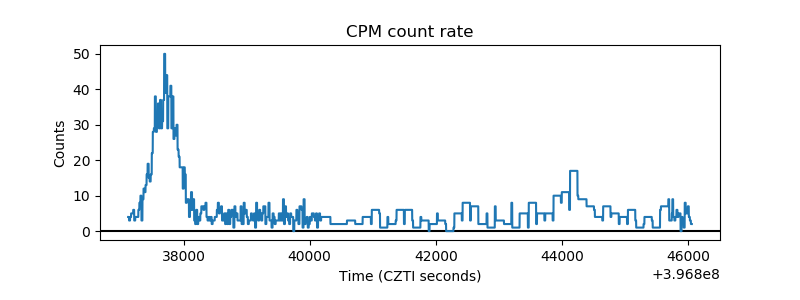 |
| CZT Counter | 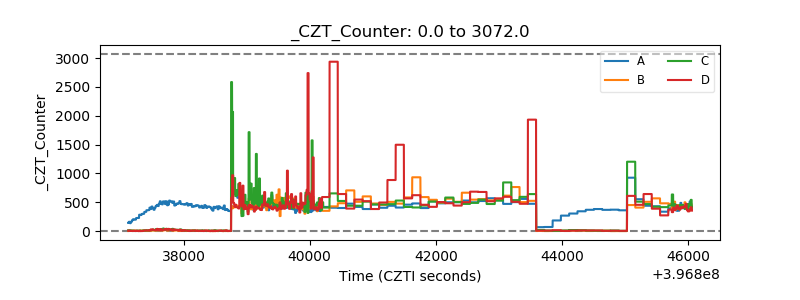 |
| +2.5 Volts monitor | 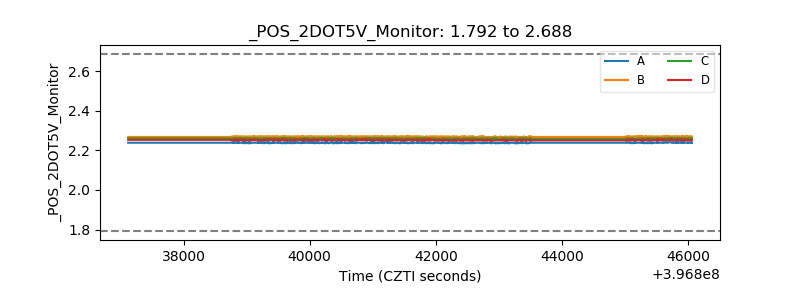 |
| +5 Volts monitor | 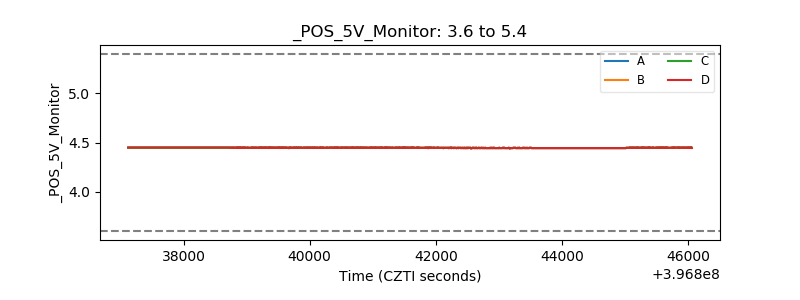 |
| _ROLL_ROT | 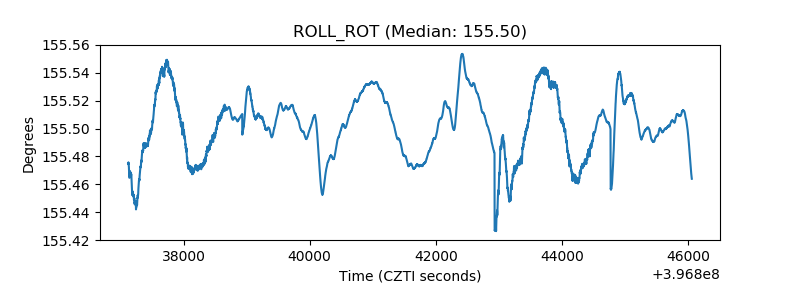 |
| _Roll_DEC | 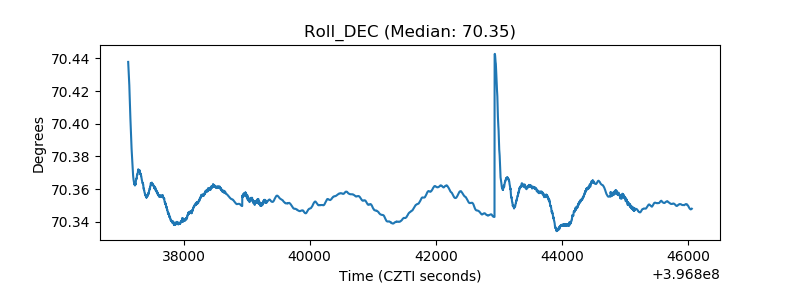 |
| _Roll_RA | 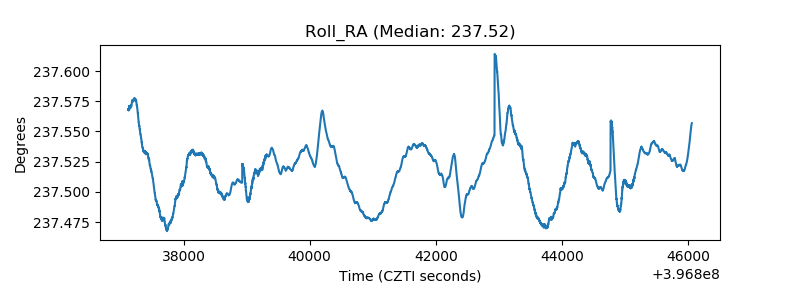 |
| Veto Counter | 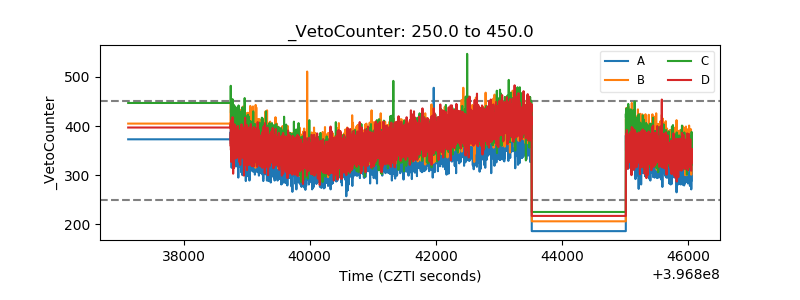 |