| Param | Original file | Final file |
|---|---|---|
| Filename | modeM0/AS1C07_001T10_9000005252_36961cztM0_level2.evt | modeM0/AS1C07_001T10_9000005252_36961cztM0_level2_quad_clean.evt |
| Size (bytes) | 397,336,320 | 83,568,960 |
| Size | 378.9 MB | 79.7 MB |
| Events in quadrant A | 2,824,872 | 539,792 |
| Events in quadrant B | 2,838,651 | 538,790 |
| Events in quadrant C | 2,944,677 | 535,949 |
| Events in quadrant D | 3,039,424 | 519,662 |
| Mode M0 | |||
|---|---|---|---|
| Quadrant | BADHDUFLAG | Total packets | Discarded packets |
| A | 0 | 12149 | 2 |
| B | 0 | 12191 | 1 |
| C | 0 | 12310 | 1 |
| D | 0 | 12959 | 1 |
| Mode SS | |||
|---|---|---|---|
| Quadrant | BADHDUFLAG | Total packets | Discarded packets |
| A | 0 | 116 | 0 |
| B | 0 | 116 | 0 |
| C | 0 | 116 | 0 |
| D | 0 | 116 | 0 |
| Mode M9 | |||
|---|---|---|---|
| Quadrant | BADHDUFLAG | Total packets | Discarded packets |
| A | 0 | 13 | 0 |
| B | 0 | 13 | 0 |
| C | 0 | 13 | 0 |
| D | 0 | 13 | 0 |
| Quadrant | Total seconds | Saturated seconds | Saturation percentage |
|---|---|---|---|
| A | 5667 | 36 | 0.635257% |
| B | 5667 | 31 | 0.547027% |
| C | 5667 | 41 | 0.723487% |
| D | 5667 | 59 | 1.041115% |
Noise dominated data is calculated using 1-second bins in cleaned event files. If a bin has >2000 counts, and if more than 50% of those come from <1% of pixels, then it is considered to be noise-dominated and hence unusable.
| Quadrant | # 1 sec bins | Bins with >0 counts | Bins with >2000 counts | High rate bins dominated by noise | Noise dominated (total time) | Noise dominated (detector-on time) | Marked lightcurve |
|---|---|---|---|---|---|---|---|
| A | 6981 | 5668 | 24 | 24 | 0.34% | 0.42% | 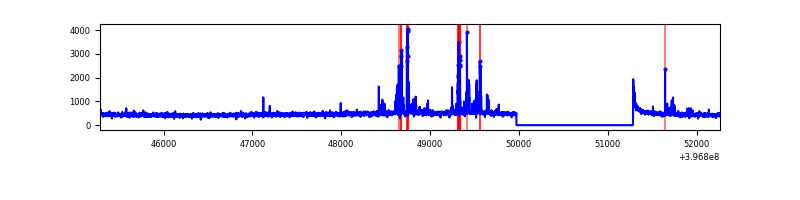 |
| B | 6981 | 5668 | 17 | 17 | 0.24% | 0.30% | 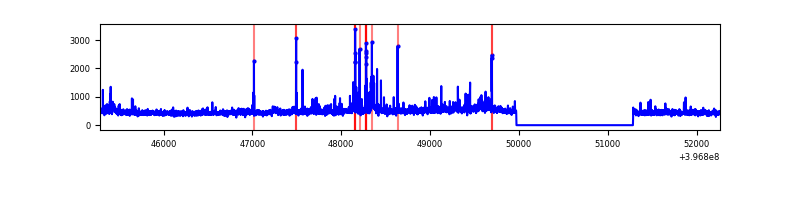 |
| C | 6981 | 5668 | 30 | 30 | 0.43% | 0.53% | 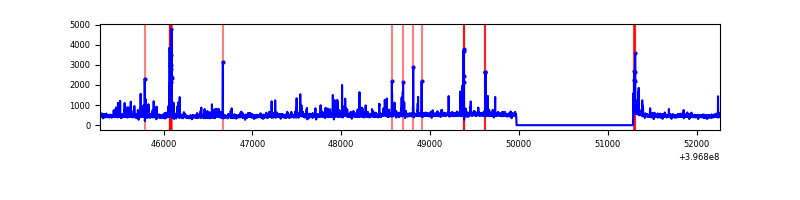 |
| D | 6981 | 5668 | 54 | 54 | 0.77% | 0.95% | 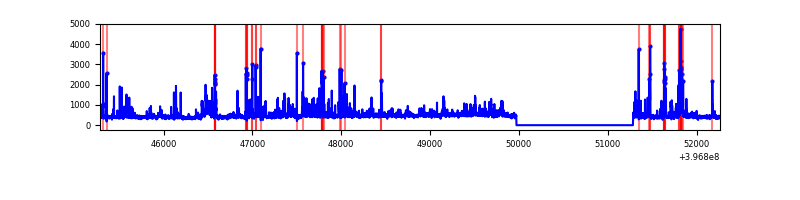 |
Top three noisy pixels from each quadrant. If the there are fewer than three noisy pixels in the level2.evt file, extra rows are filled as -1
| Pixel properties | Quadrant properties | ||||||
|---|---|---|---|---|---|---|---|
| Quadrant | DetID | PixID | Counts | Sigma | Mean | Median | Sigma |
| A | 10 | 83 | 201983 | 1599.27 | 617 | 603 | 125.9 |
| A | 7 | 16 | 147932 | 1170.02 | 617 | 603 | 125.9 |
| A | 15 | 237 | 56416 | 443.24 | 617 | 603 | 125.9 |
| B | 0 | 221 | 76026 | 639.61 | 616 | 600 | 117.9 |
| B | 5 | 255 | 60174 | 505.19 | 616 | 600 | 117.9 |
| B | 0 | 189 | 46106 | 385.89 | 616 | 600 | 117.9 |
| C | 15 | 214 | 243142 | 1725.2 | 603 | 606 | 140.6 |
| C | 14 | 254 | 128813 | 911.96 | 603 | 606 | 140.6 |
| C | 0 | 207 | 86159 | 608.55 | 603 | 606 | 140.6 |
| D | 12 | 17 | 256845 | 1751.55 | 604 | 586 | 146.3 |
| D | 2 | 250 | 105600 | 717.78 | 604 | 586 | 146.3 |
| D | 2 | 153 | 91664 | 622.52 | 604 | 586 | 146.3 |
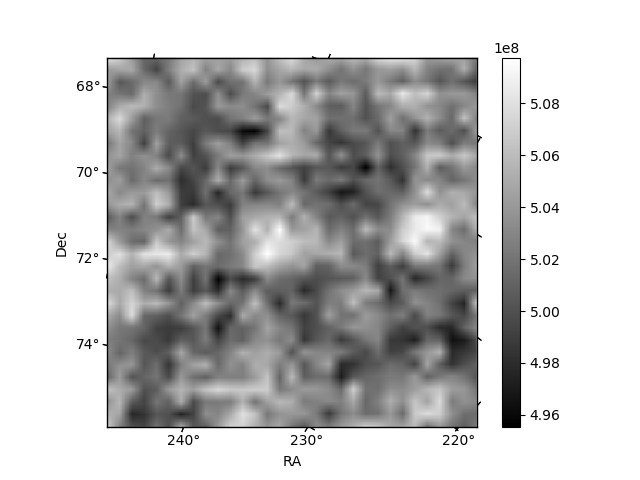
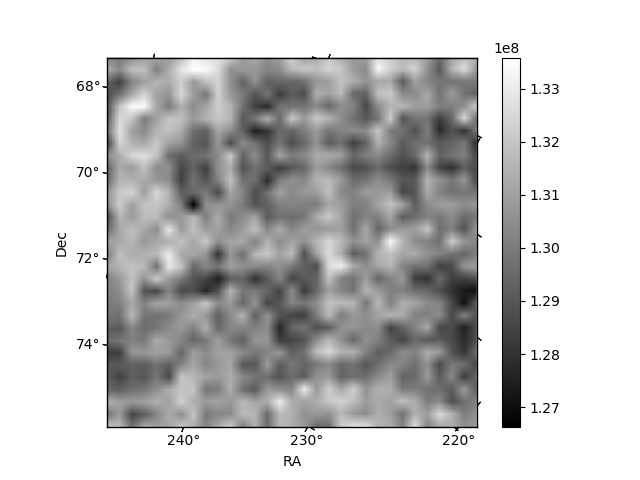
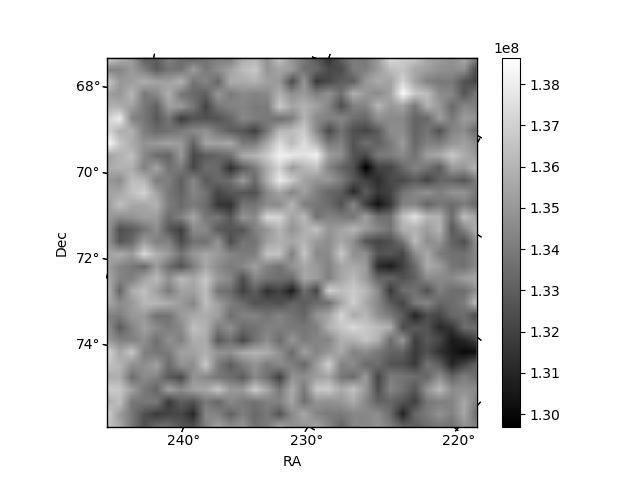
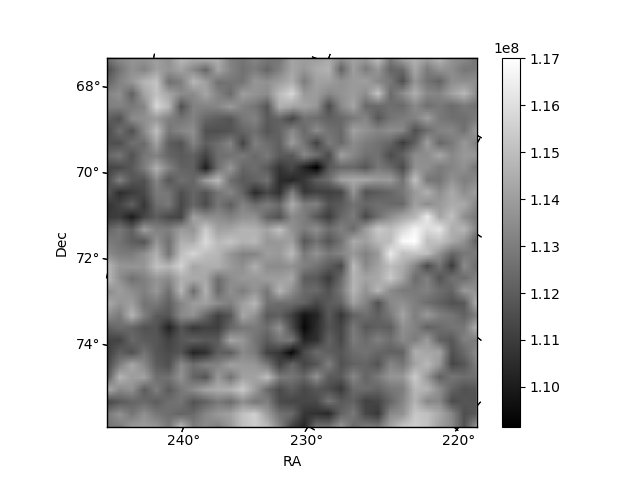
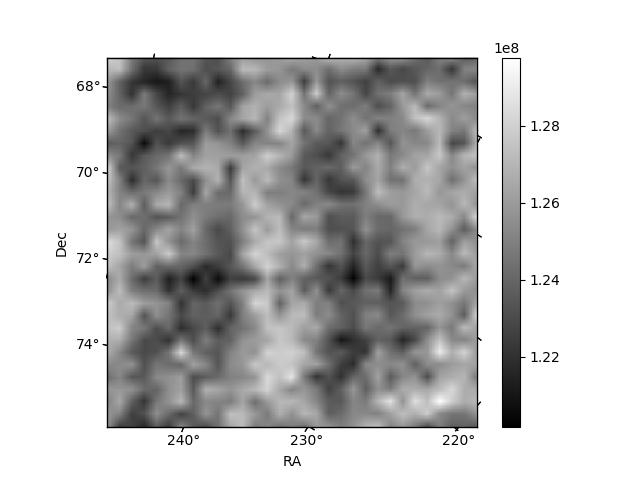
Histogram calculated using DETX and DETY for each event in the final _common_clean file
| Quadrant A | 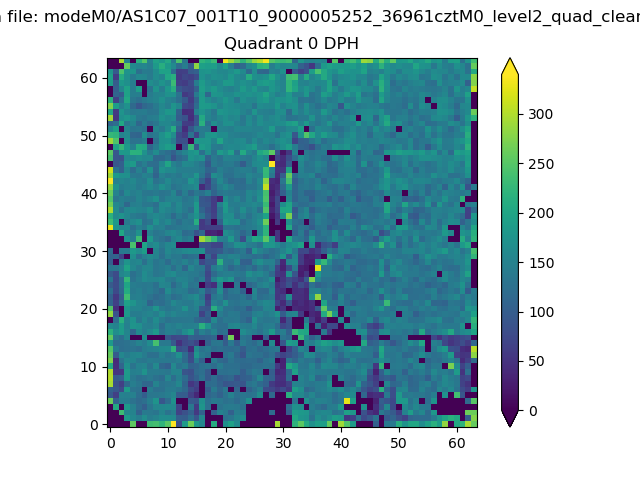 |
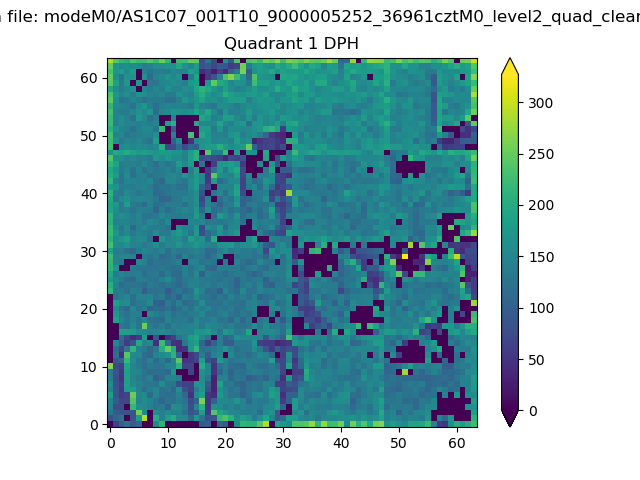 |
Quadrant B |
|---|---|---|---|
| Quadrant D | 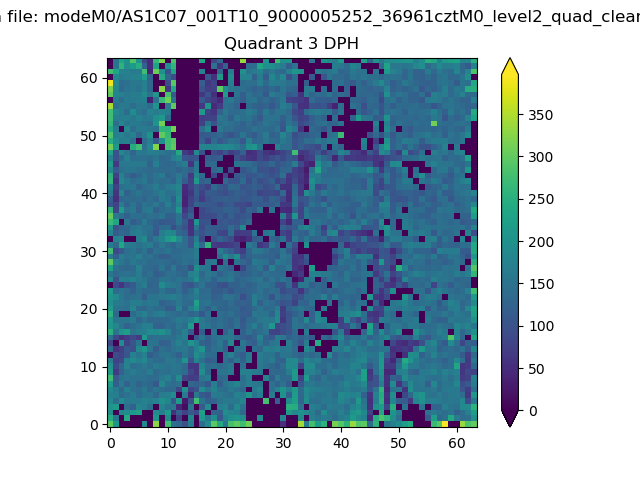 |
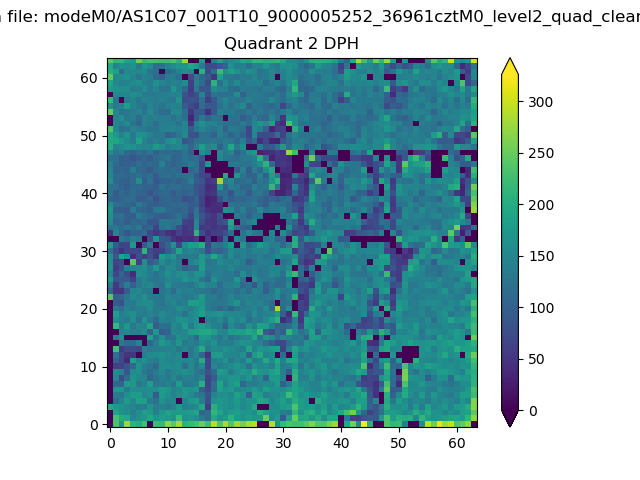 |
Quadrant C |
| Plot type | Count rate plots | Images |
|---|---|---|
| Comparison with Poisson distribution Blue bars denote a histogram of data divided into 1 sec bins. Red curve is a Poisson curve with rate = median count rate of data. |
 |
 |
| Quadrant-wise count rates Data is divided into 100 sec bins |
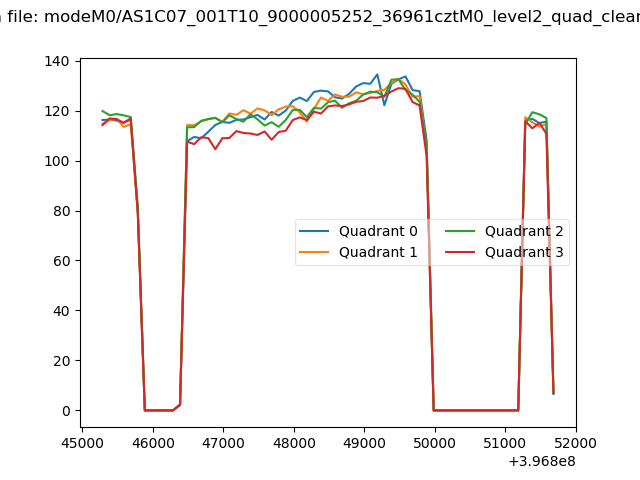 |
|
| Module-wise count rates for Quadrant A Data is divided into 100 sec bins |
 |
 |
| Module-wise count rates for Quadrant B Data is divided into 100 sec bins |
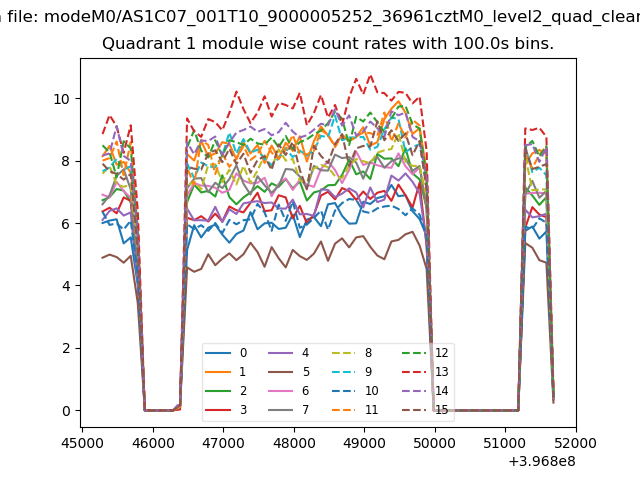 |
 |
| Module-wise count rates for Quadrant C Data is divided into 100 sec bins |
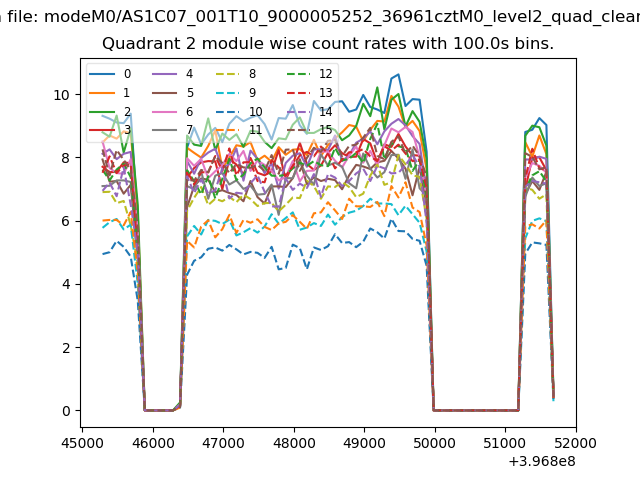 |
 |
| Module-wise count rates for Quadrant D Data is divided into 100 sec bins |
 |
 |
| Parameter | Plot |
|---|---|
| CZT HV Monitor | 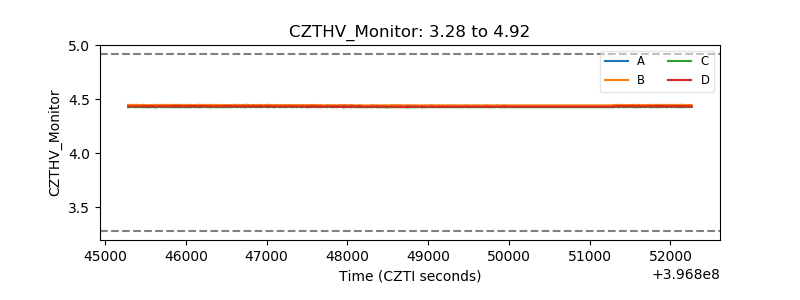 |
| D_VDD | 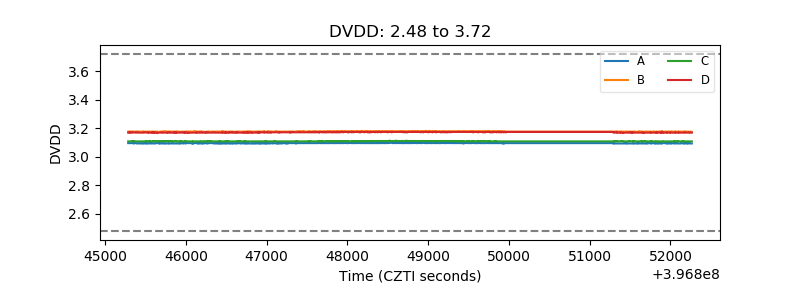 |
| Temperature 1 |  |
| Veto HV Monitor | 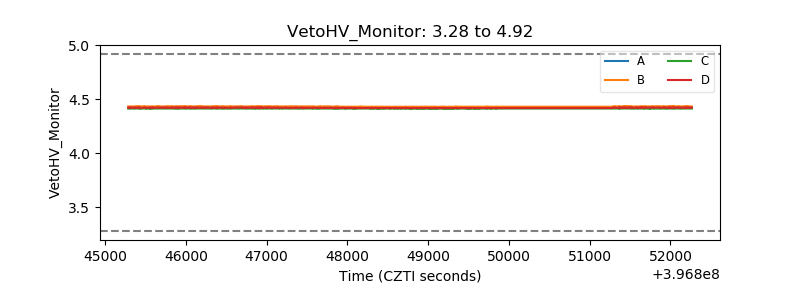 |
| Veto LLD | 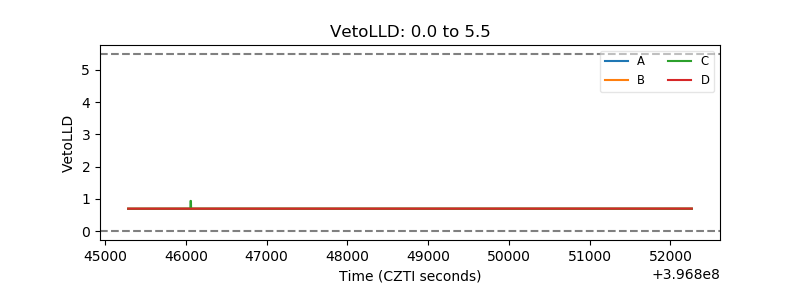 |
| Alpha Counter | 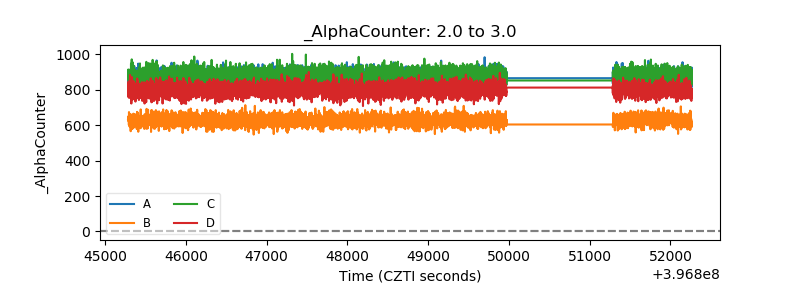 |
| _CPM_Rate | 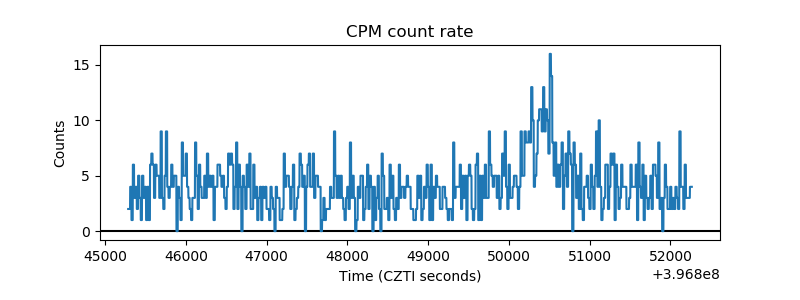 |
| CZT Counter | 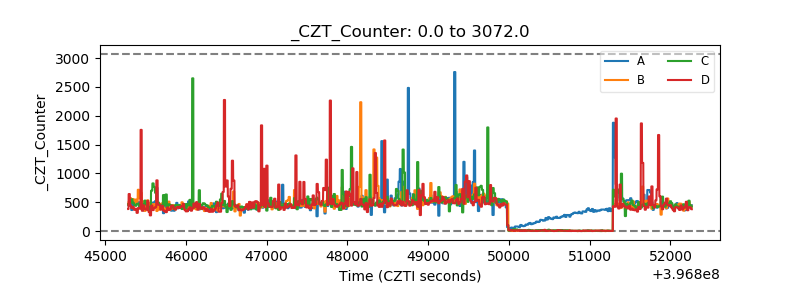 |
| +2.5 Volts monitor | 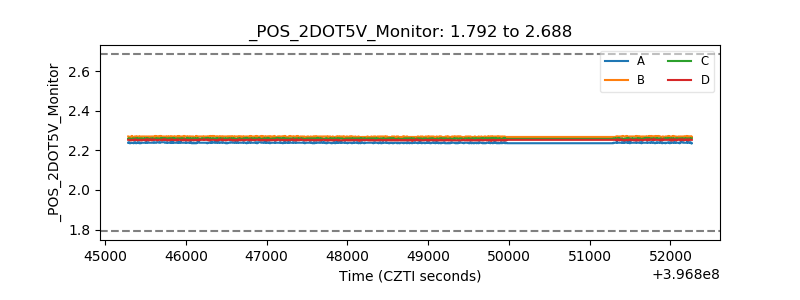 |
| +5 Volts monitor | 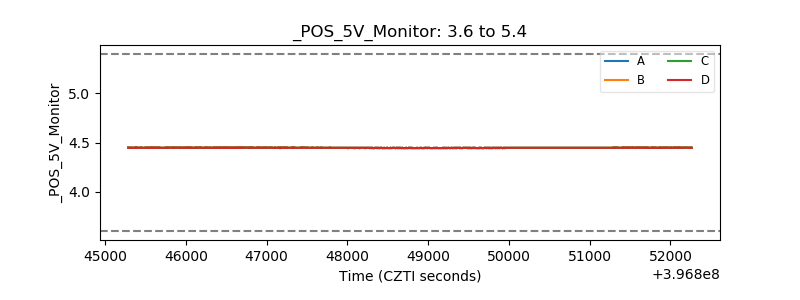 |
| _ROLL_ROT |  |
| _Roll_DEC |  |
| _Roll_RA | 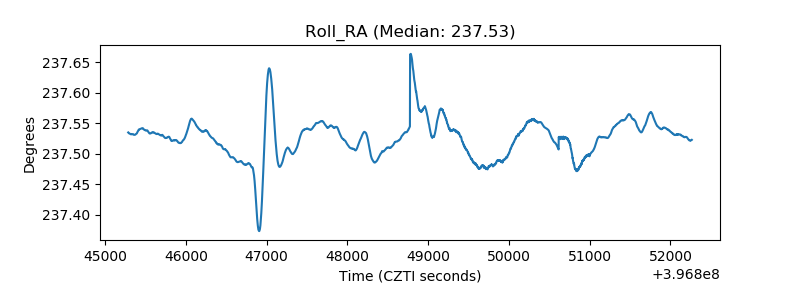 |
| Veto Counter | 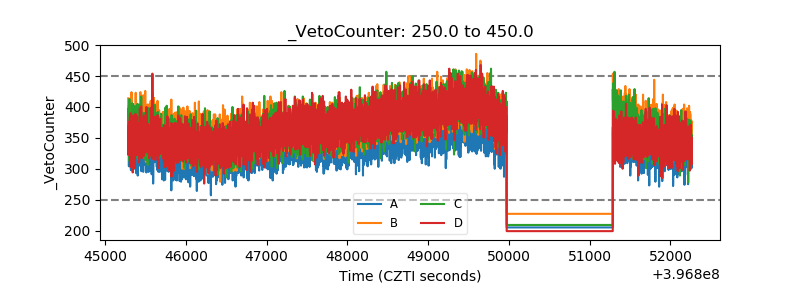 |