| Param | Original file | Final file |
|---|---|---|
| Filename | modeM0/AS1C07_001T10_9000005252_36962cztM0_level2.evt | modeM0/AS1C07_001T10_9000005252_36962cztM0_level2_quad_clean.evt |
| Size (bytes) | 496,425,600 | 86,025,600 |
| Size | 473.4 MB | 82.0 MB |
| Events in quadrant A | 3,306,006 | 559,667 |
| Events in quadrant B | 4,461,772 | 527,710 |
| Events in quadrant C | 3,199,114 | 559,920 |
| Events in quadrant D | 3,661,502 | 539,904 |
| Mode M0 | |||
|---|---|---|---|
| Quadrant | BADHDUFLAG | Total packets | Discarded packets |
| A | 0 | 13709 | 3 |
| B | 0 | 17298 | 2 |
| C | 0 | 13262 | 2 |
| D | 0 | 15128 | 2 |
| Mode SS | |||
|---|---|---|---|
| Quadrant | BADHDUFLAG | Total packets | Discarded packets |
| A | 0 | 122 | 0 |
| B | 0 | 122 | 0 |
| C | 0 | 122 | 0 |
| D | 0 | 122 | 0 |
| Mode M9 | |||
|---|---|---|---|
| Quadrant | BADHDUFLAG | Total packets | Discarded packets |
| A | 0 | 13 | 0 |
| B | 0 | 13 | 0 |
| C | 0 | 13 | 0 |
| D | 0 | 13 | 0 |
| Quadrant | Total seconds | Saturated seconds | Saturation percentage |
|---|---|---|---|
| A | 5977 | 92 | 1.539234% |
| B | 5977 | 728 | 12.180023% |
| C | 5977 | 53 | 0.886732% |
| D | 5977 | 190 | 3.178852% |
Noise dominated data is calculated using 1-second bins in cleaned event files. If a bin has >2000 counts, and if more than 50% of those come from <1% of pixels, then it is considered to be noise-dominated and hence unusable.
| Quadrant | # 1 sec bins | Bins with >0 counts | Bins with >2000 counts | High rate bins dominated by noise | Noise dominated (total time) | Noise dominated (detector-on time) | Marked lightcurve |
|---|---|---|---|---|---|---|---|
| A | 7291 | 5978 | 72 | 72 | 0.99% | 1.20% | 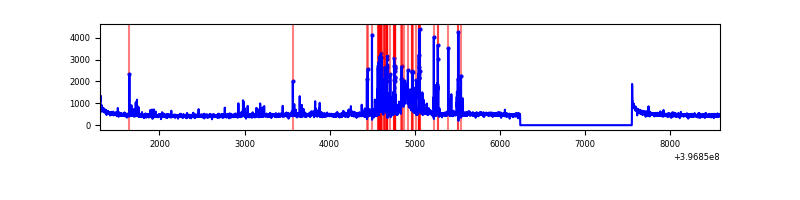 |
| B | 7291 | 5978 | 429 | 429 | 5.88% | 7.18% | 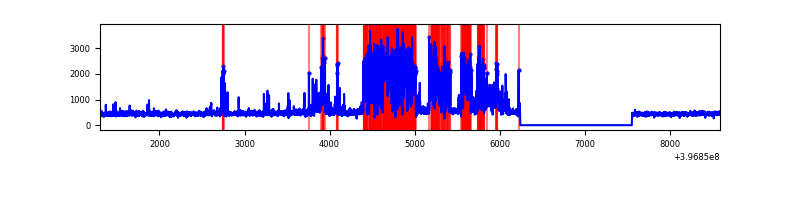 |
| C | 7291 | 5978 | 36 | 36 | 0.49% | 0.60% | 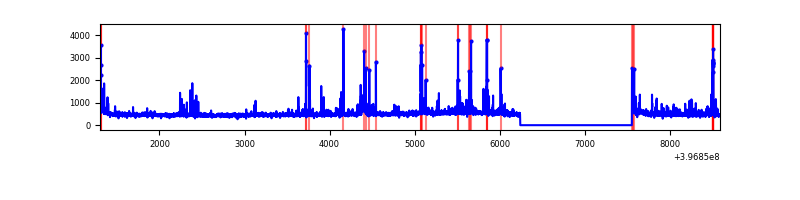 |
| D | 7291 | 5978 | 179 | 179 | 2.46% | 2.99% | 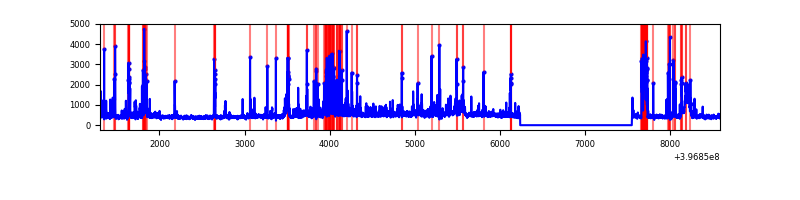 |
Top three noisy pixels from each quadrant. If the there are fewer than three noisy pixels in the level2.evt file, extra rows are filled as -1
| Pixel properties | Quadrant properties | ||||||
|---|---|---|---|---|---|---|---|
| Quadrant | DetID | PixID | Counts | Sigma | Mean | Median | Sigma |
| A | 15 | 237 | 429585 | 3198.64 | 653 | 640 | 134.1 |
| A | 10 | 83 | 247525 | 1841.02 | 653 | 640 | 134.1 |
| A | 7 | 16 | 65550 | 484.03 | 653 | 640 | 134.1 |
| B | 5 | 184 | 1609267 | 13528.86 | 625 | 609 | 118.9 |
| B | 0 | 221 | 83667 | 698.52 | 625 | 609 | 118.9 |
| B | 5 | 255 | 76988 | 642.35 | 625 | 609 | 118.9 |
| C | 15 | 214 | 261384 | 1762.24 | 637 | 642 | 148.0 |
| C | 1 | 23 | 170997 | 1151.35 | 637 | 642 | 148.0 |
| C | 14 | 254 | 89445 | 600.18 | 637 | 642 | 148.0 |
| D | 12 | 17 | 313176 | 2015.28 | 635 | 617 | 155.1 |
| D | 10 | 253 | 163015 | 1047.09 | 635 | 617 | 155.1 |
| D | 13 | 249 | 127777 | 819.89 | 635 | 617 | 155.1 |
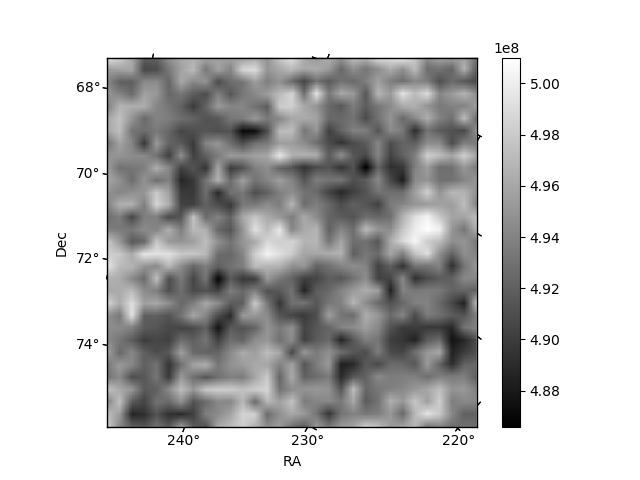
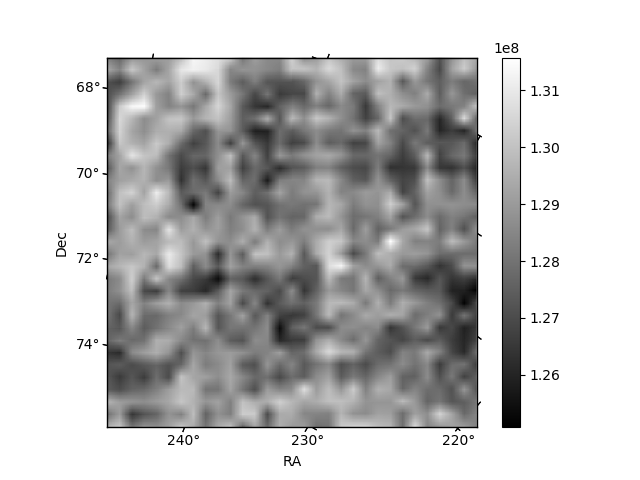
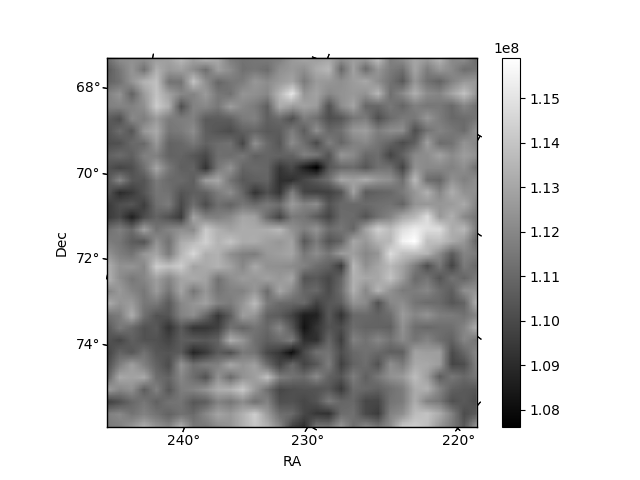
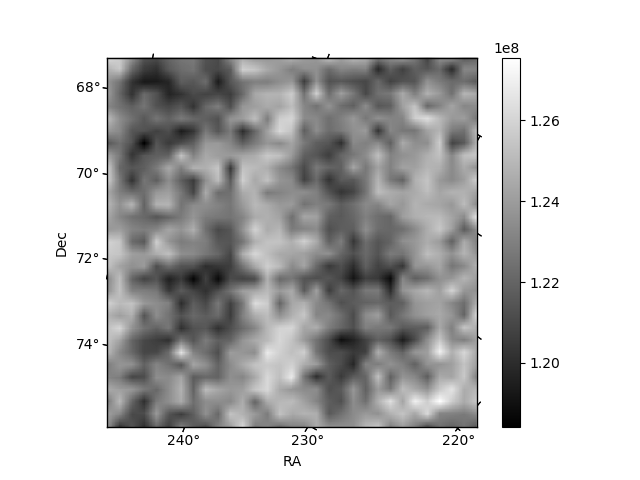
Histogram calculated using DETX and DETY for each event in the final _common_clean file
| Quadrant A | 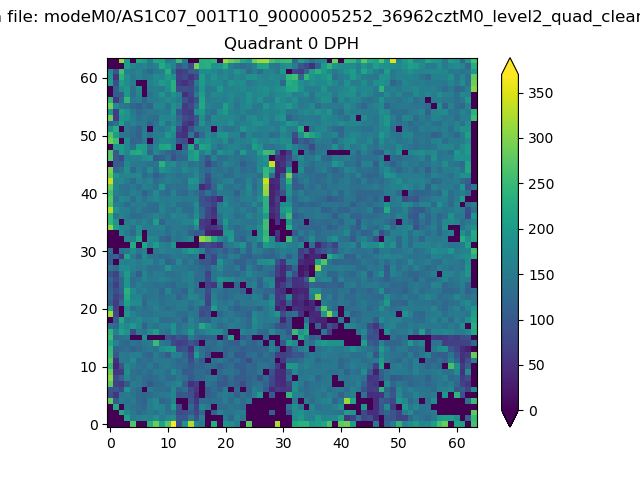 |
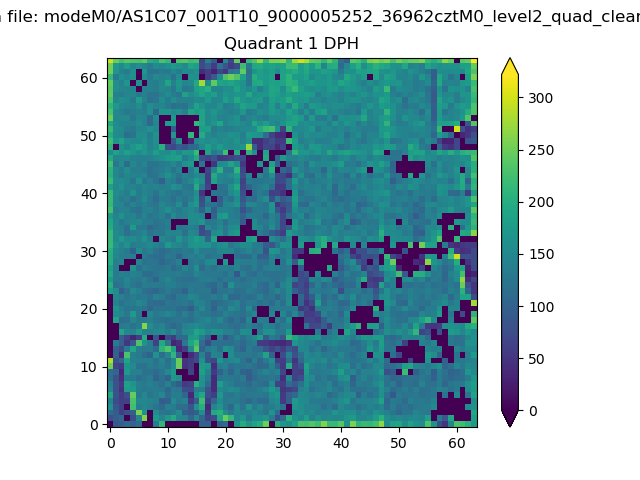 |
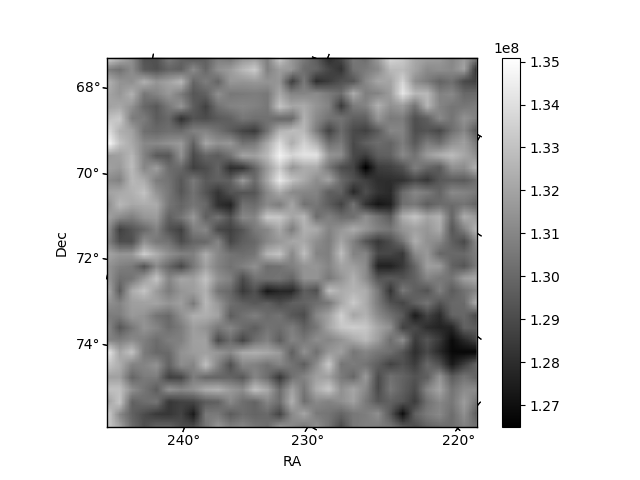
Quadrant B |
|---|---|---|---|
| Quadrant D | 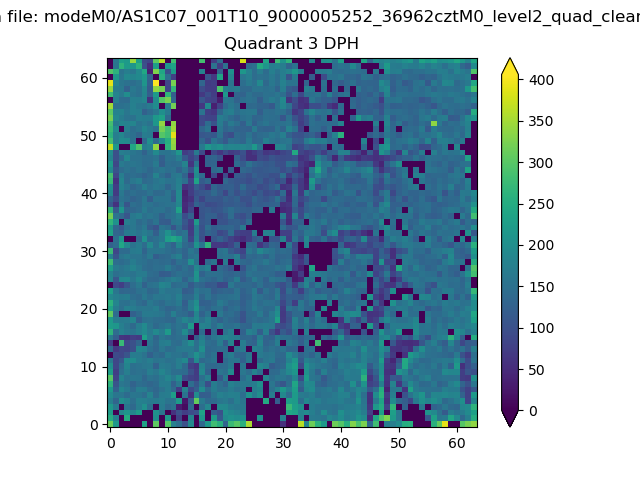 |
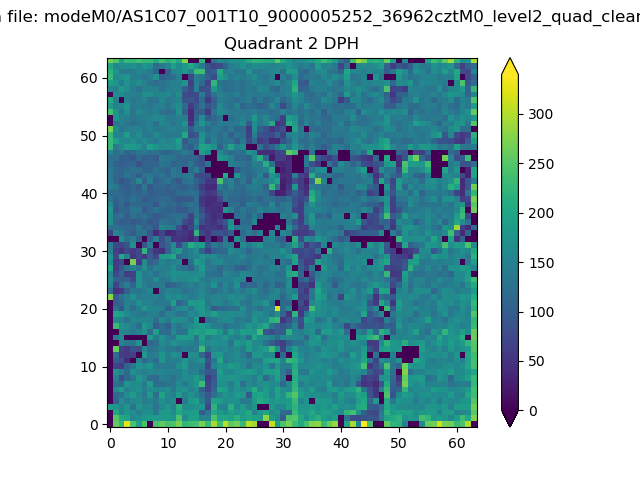 |
Quadrant C |
| Plot type | Count rate plots | Images |
|---|---|---|
| Comparison with Poisson distribution Blue bars denote a histogram of data divided into 1 sec bins. Red curve is a Poisson curve with rate = median count rate of data. |
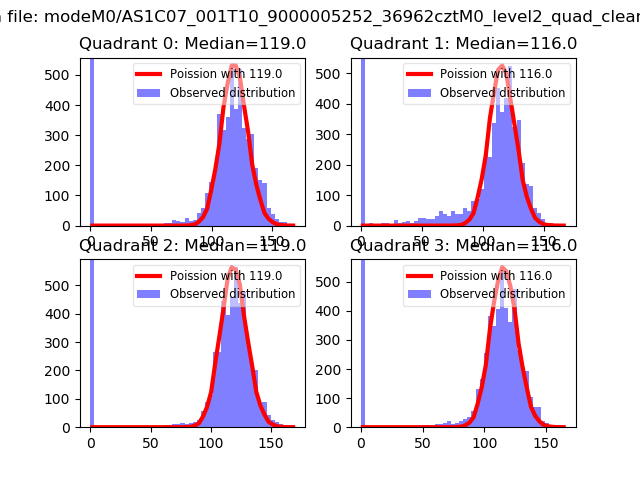 |
 |
| Quadrant-wise count rates Data is divided into 100 sec bins |
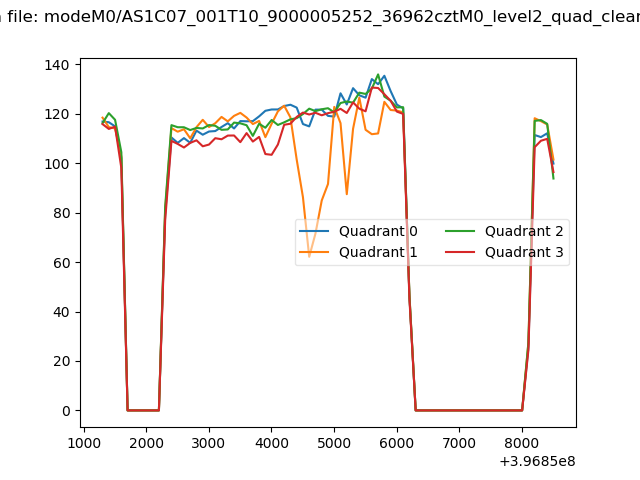 |
|
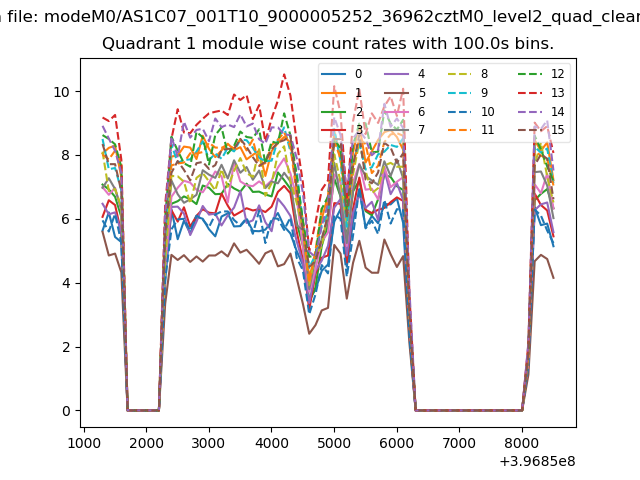
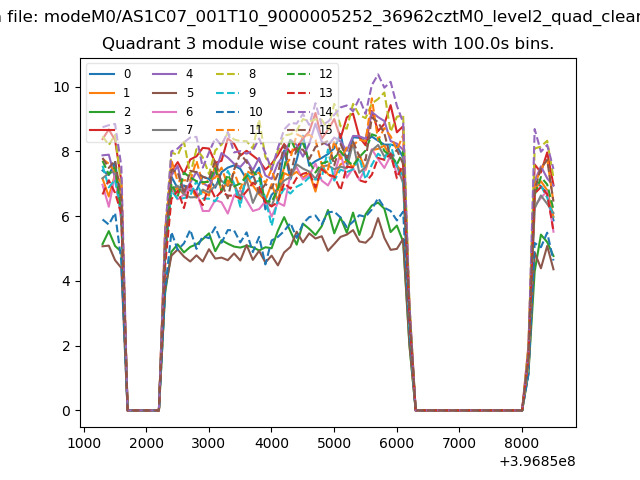
| Module-wise count rates for Quadrant A Data is divided into 100 sec bins |
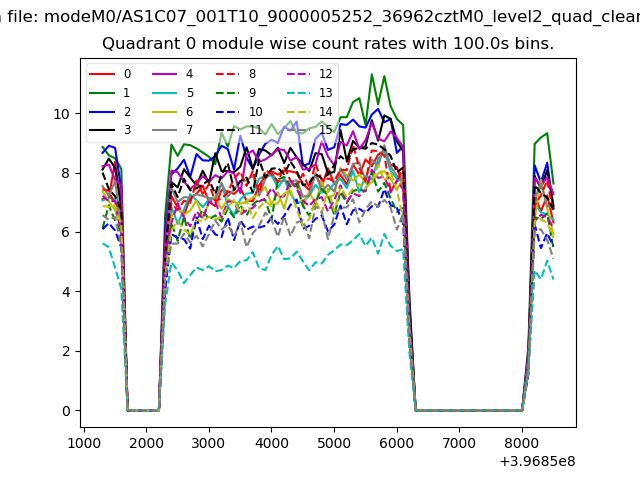 |
 |
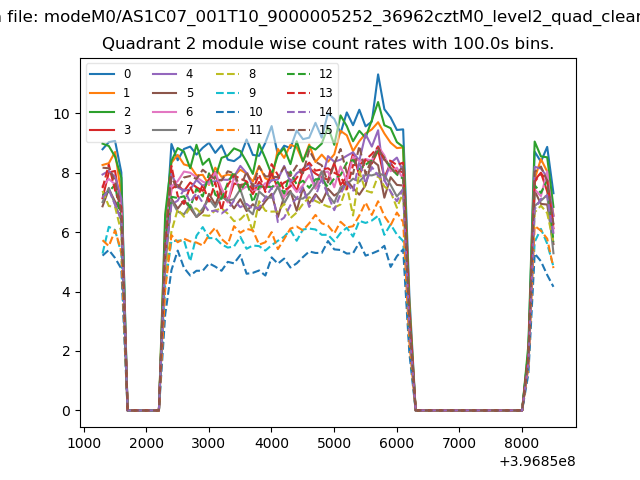
| Module-wise count rates for Quadrant B Data is divided into 100 sec bins |
 |
 |
| Module-wise count rates for Quadrant C Data is divided into 100 sec bins |
 |
 |
| Module-wise count rates for Quadrant D Data is divided into 100 sec bins |
 |
 |
| Parameter | Plot |
|---|---|
| CZT HV Monitor | 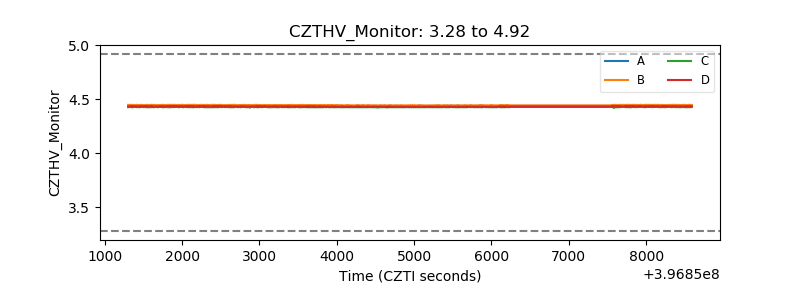 |
| D_VDD | 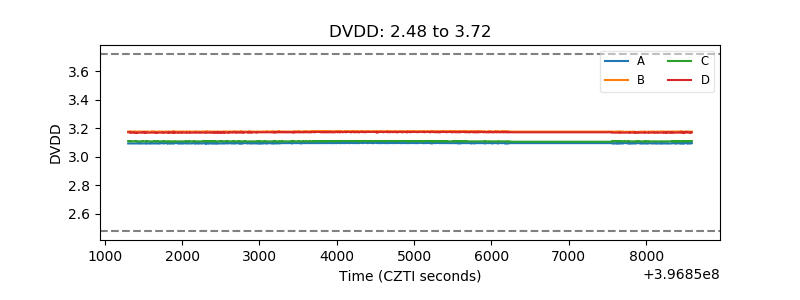 |
| Temperature 1 | 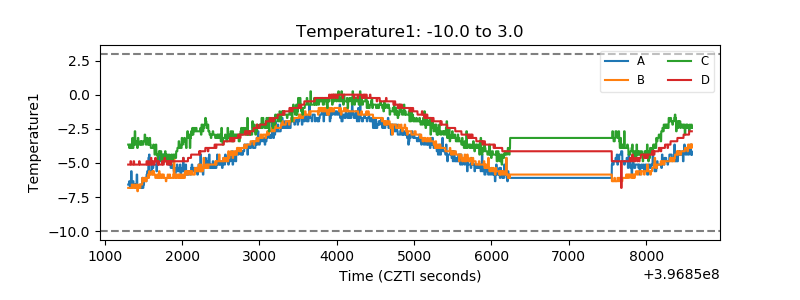 |
| Veto HV Monitor | 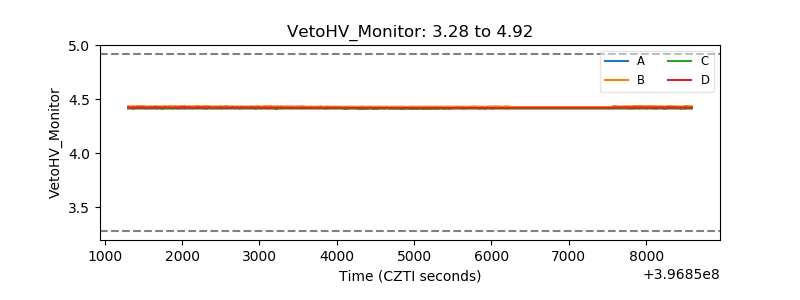 |
| Veto LLD | 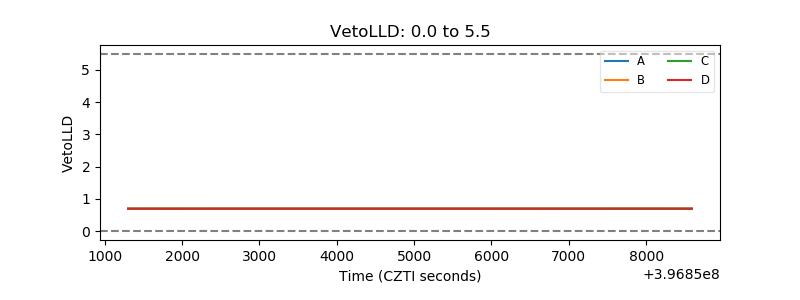 |
| Alpha Counter | 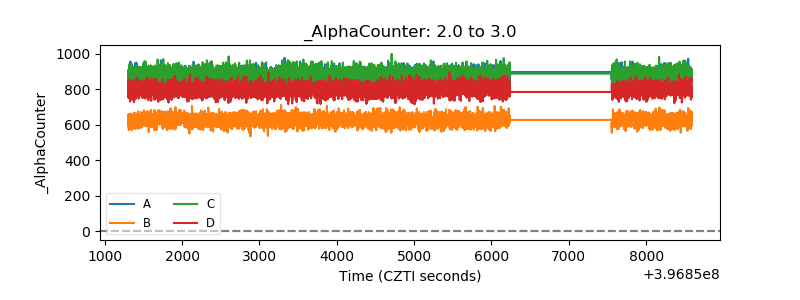 |
| _CPM_Rate | 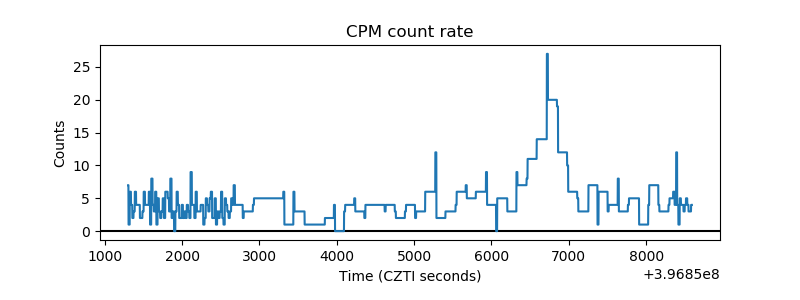 |
| CZT Counter | 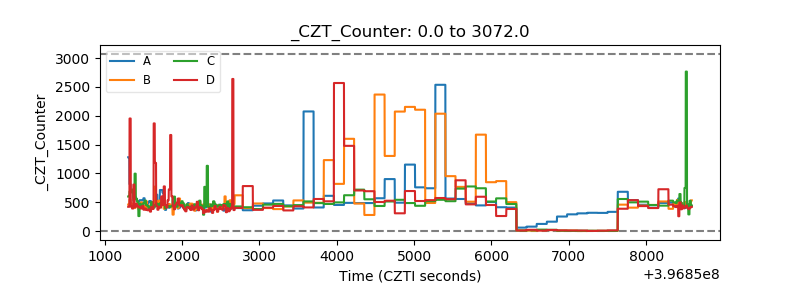 |
| +2.5 Volts monitor | 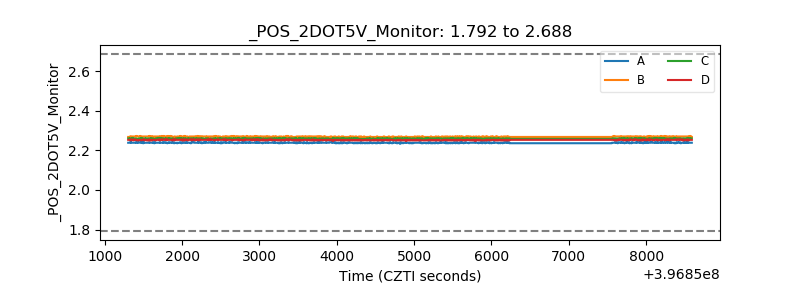 |
| +5 Volts monitor | 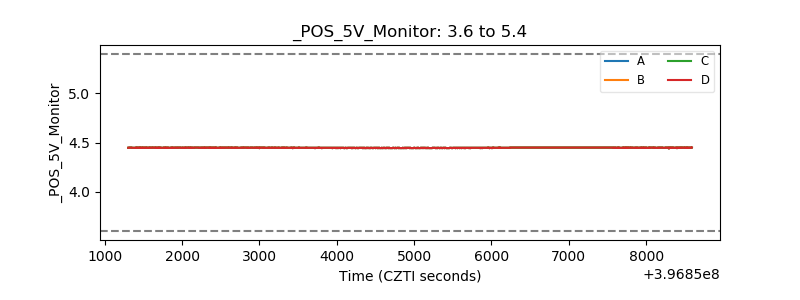 |
| _ROLL_ROT | 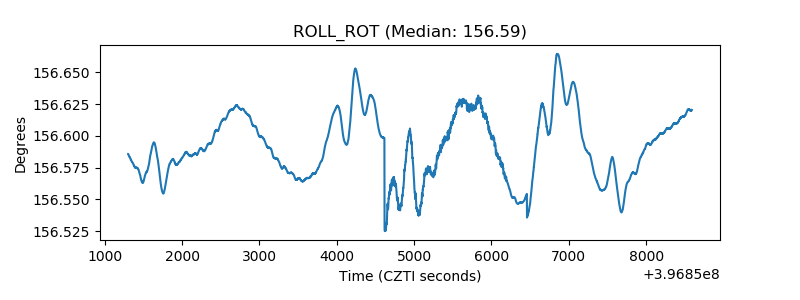 |
| _Roll_DEC | 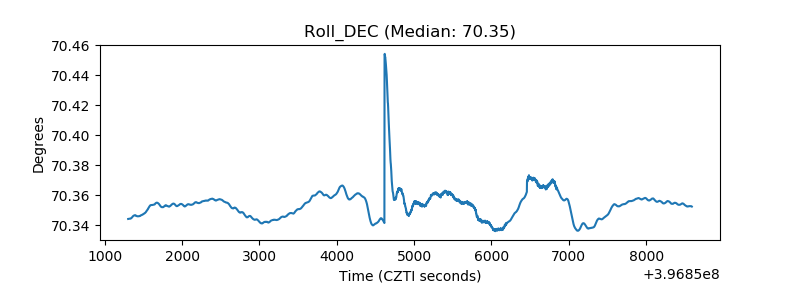 |
| _Roll_RA | 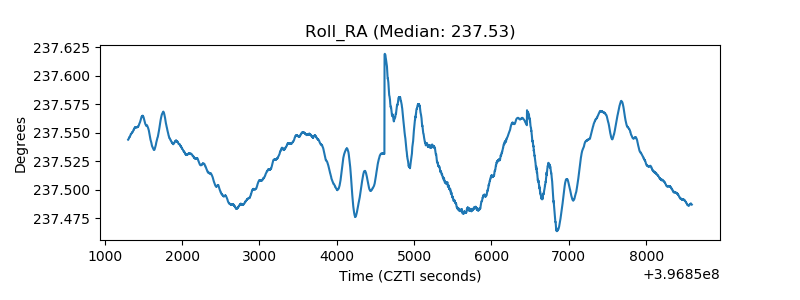 |
| Veto Counter | 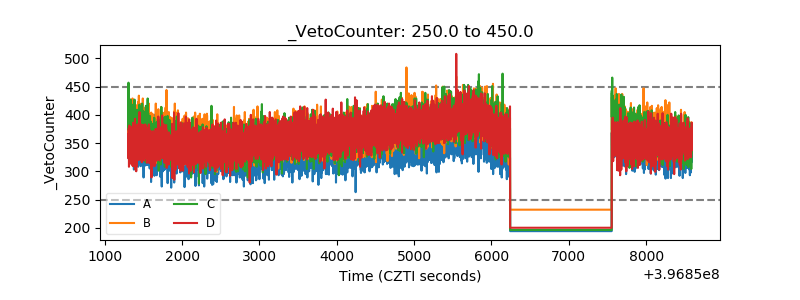 |