| Param | Original file | Final file |
|---|---|---|
| Filename | modeM0/AS1C07_001T10_9000005252_36964cztM0_level2.evt | modeM0/AS1C07_001T10_9000005252_36964cztM0_level2_quad_clean.evt |
| Size (bytes) | 828,017,280 | 177,701,760 |
| Size | 789.7 MB | 169.5 MB |
| Events in quadrant A | 5,692,136 | 1,181,297 |
| Events in quadrant B | 6,843,777 | 1,163,794 |
| Events in quadrant C | 5,818,109 | 1,167,874 |
| Events in quadrant D | 5,997,734 | 1,127,319 |
| Mode M0 | |||
|---|---|---|---|
| Quadrant | BADHDUFLAG | Total packets | Discarded packets |
| A | 0 | 23742 | 4 |
| B | 0 | 27329 | 3 |
| C | 0 | 23960 | 3 |
| D | 0 | 25153 | 3 |
| Mode SS | |||
|---|---|---|---|
| Quadrant | BADHDUFLAG | Total packets | Discarded packets |
| A | 0 | 218 | 0 |
| B | 0 | 218 | 0 |
| C | 0 | 218 | 0 |
| D | 0 | 218 | 0 |
| Mode M9 | |||
|---|---|---|---|
| Quadrant | BADHDUFLAG | Total packets | Discarded packets |
| A | 0 | 33 | 0 |
| B | 0 | 33 | 0 |
| C | 0 | 33 | 0 |
| D | 0 | 34 | 0 |
| Quadrant | Total seconds | Saturated seconds | Saturation percentage |
|---|---|---|---|
| A | 10713 | 90 | 0.840101% |
| B | 10713 | 540 | 5.040605% |
| C | 10713 | 106 | 0.989452% |
| D | 10713 | 204 | 1.904229% |
Noise dominated data is calculated using 1-second bins in cleaned event files. If a bin has >2000 counts, and if more than 50% of those come from <1% of pixels, then it is considered to be noise-dominated and hence unusable.
| Quadrant | # 1 sec bins | Bins with >0 counts | Bins with >2000 counts | High rate bins dominated by noise | Noise dominated (total time) | Noise dominated (detector-on time) | Marked lightcurve |
|---|---|---|---|---|---|---|---|
| A | 13579 | 10715 | 57 | 57 | 0.42% | 0.53% | 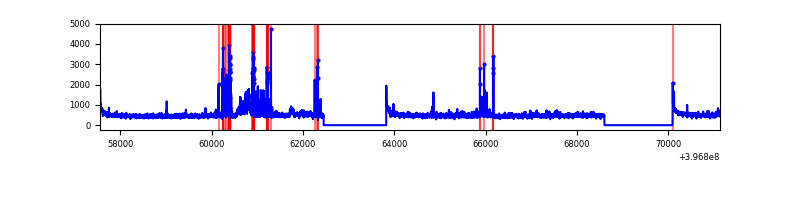 |
| B | 13579 | 10715 | 320 | 320 | 2.36% | 2.99% | 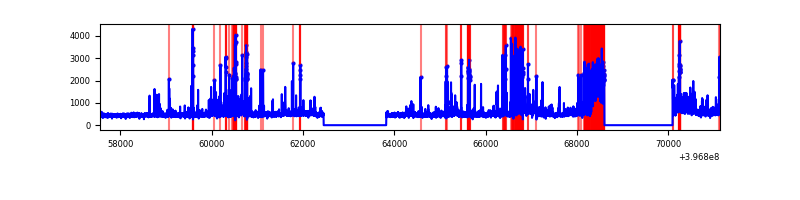 |
| C | 13579 | 10715 | 88 | 88 | 0.65% | 0.82% | 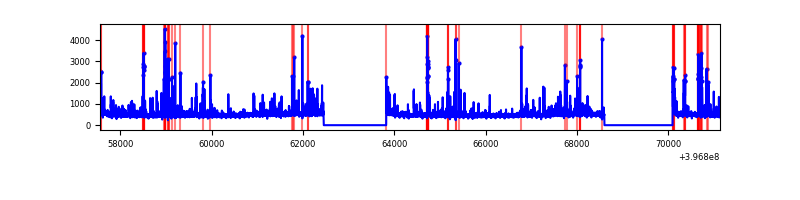 |
| D | 13579 | 10715 | 183 | 183 | 1.35% | 1.71% | 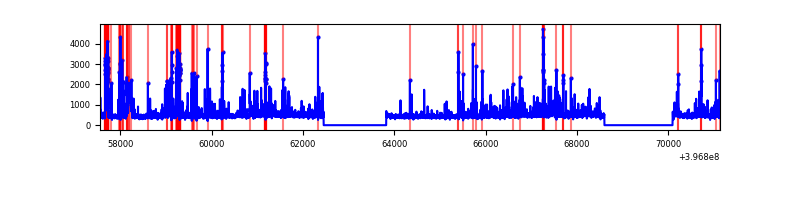 |
Top three noisy pixels from each quadrant. If the there are fewer than three noisy pixels in the level2.evt file, extra rows are filled as -1
| Pixel properties | Quadrant properties | ||||||
|---|---|---|---|---|---|---|---|
| Quadrant | DetID | PixID | Counts | Sigma | Mean | Median | Sigma |
| A | 15 | 237 | 484402 | 2027.72 | 1183 | 1160 | 238.3 |
| A | 10 | 83 | 441698 | 1848.53 | 1183 | 1160 | 238.3 |
| A | 12 | 189 | 108795 | 451.64 | 1183 | 1160 | 238.3 |
| B | 5 | 184 | 1490698 | 6762.33 | 1162 | 1133 | 220.3 |
| B | 0 | 221 | 111865 | 502.7 | 1162 | 1133 | 220.3 |
| B | 4 | 171 | 103707 | 465.67 | 1162 | 1133 | 220.3 |
| C | 15 | 214 | 468862 | 1759.03 | 1150 | 1157 | 265.9 |
| C | 1 | 23 | 277353 | 1038.77 | 1150 | 1157 | 265.9 |
| C | 0 | 10 | 187271 | 699.97 | 1150 | 1157 | 265.9 |
| D | 10 | 253 | 273380 | 985.31 | 1150 | 1118 | 276.3 |
| D | 2 | 249 | 199332 | 717.33 | 1150 | 1118 | 276.3 |
| D | 13 | 249 | 133475 | 479.0 | 1150 | 1118 | 276.3 |
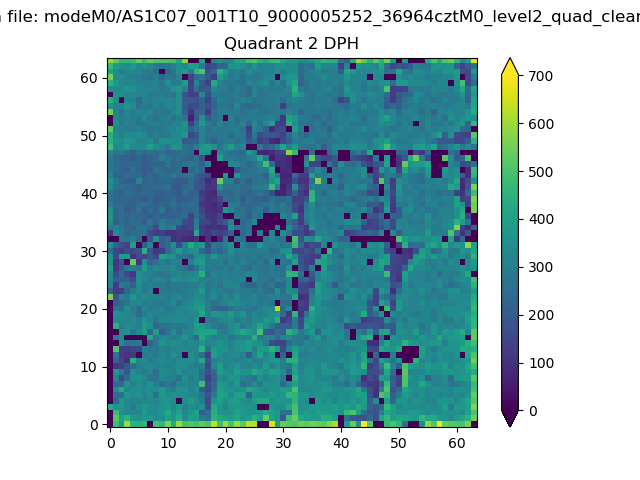
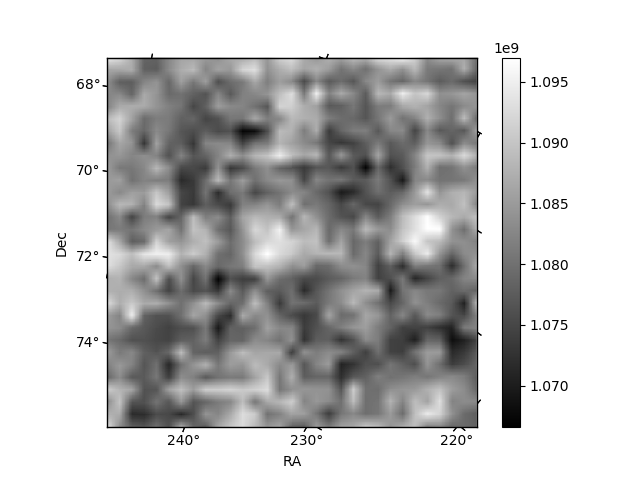
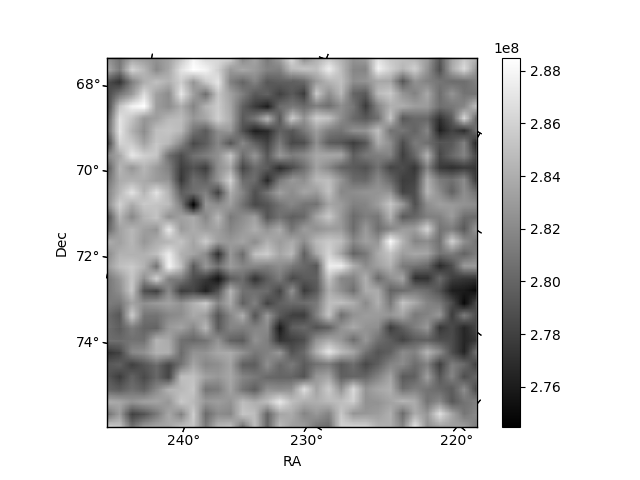
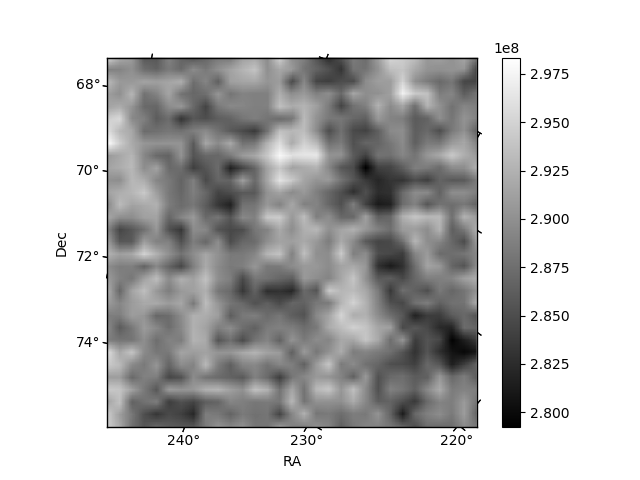
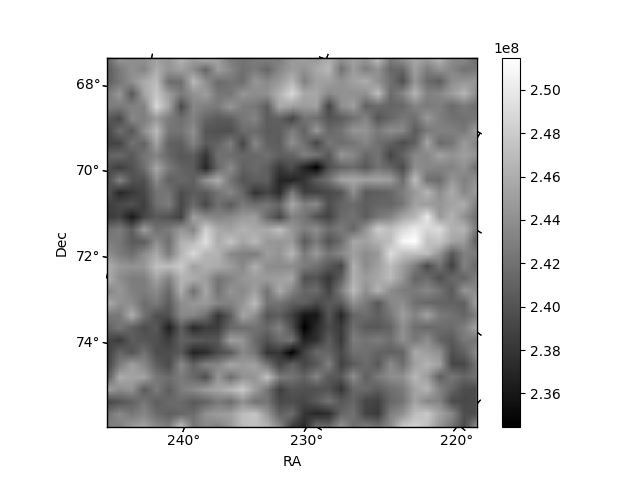
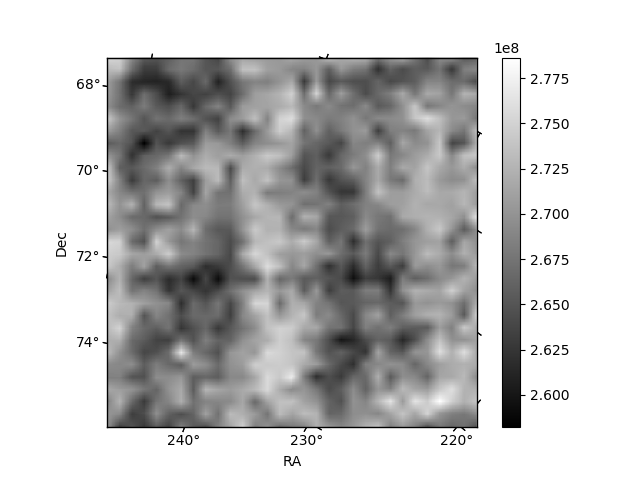
Histogram calculated using DETX and DETY for each event in the final _common_clean file
| Quadrant A | 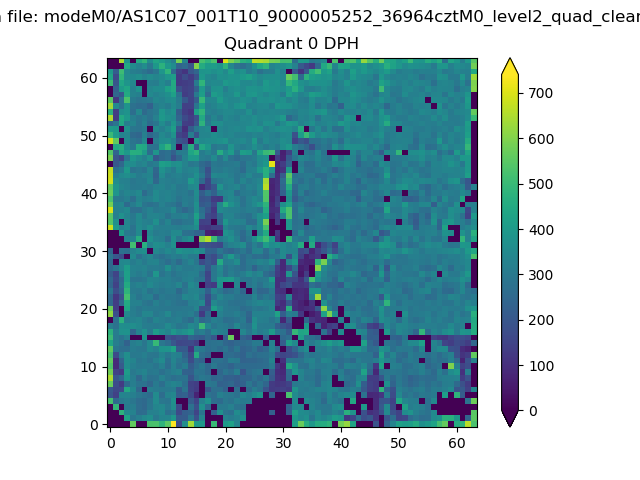 |
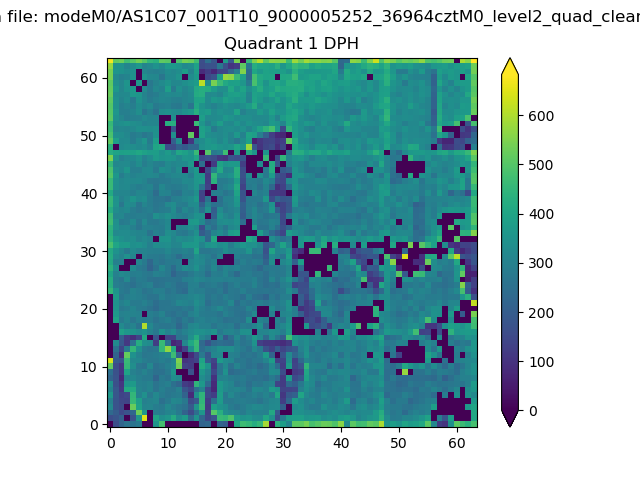 |
Quadrant B |
|---|---|---|---|
| Quadrant D | 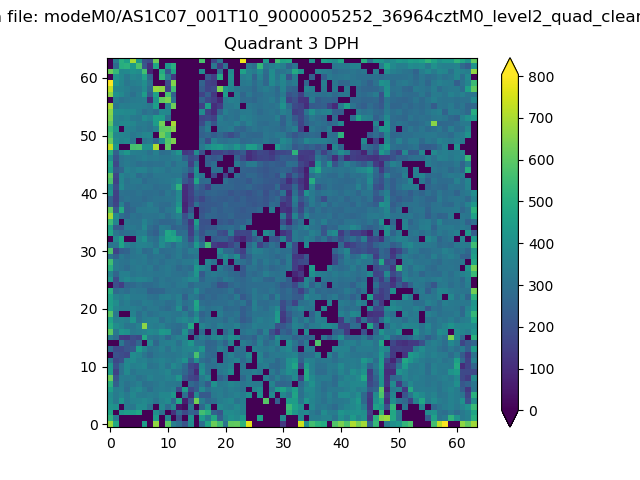 |
 |
Quadrant C |
| Plot type | Count rate plots | Images |
|---|---|---|
| Comparison with Poisson distribution Blue bars denote a histogram of data divided into 1 sec bins. Red curve is a Poisson curve with rate = median count rate of data. |
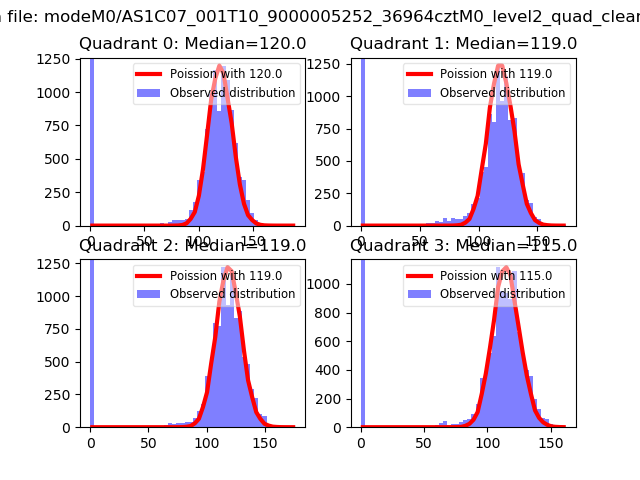 |
 |
| Quadrant-wise count rates Data is divided into 100 sec bins |
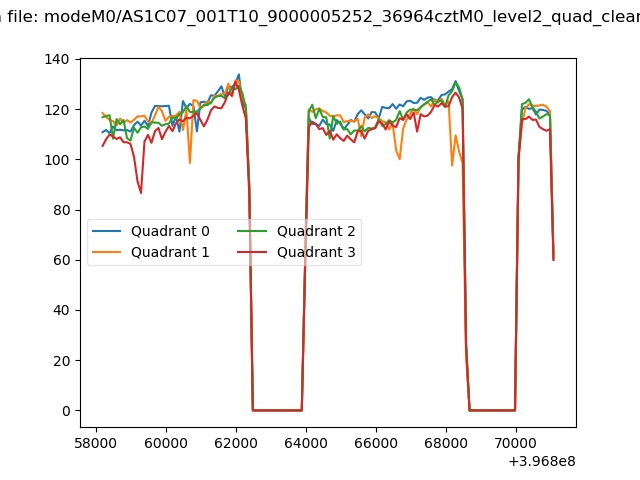 |
|
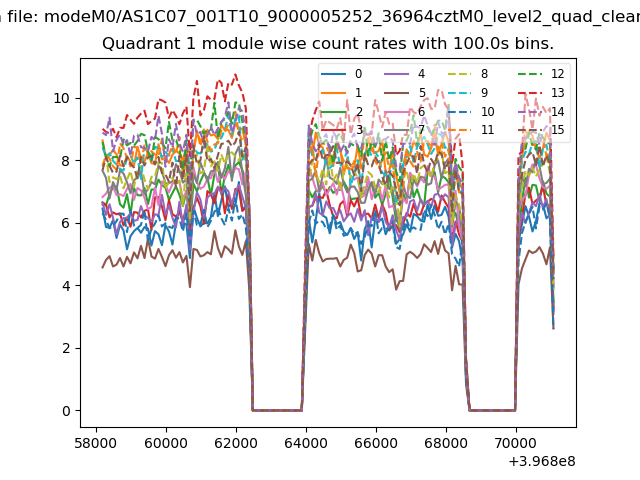
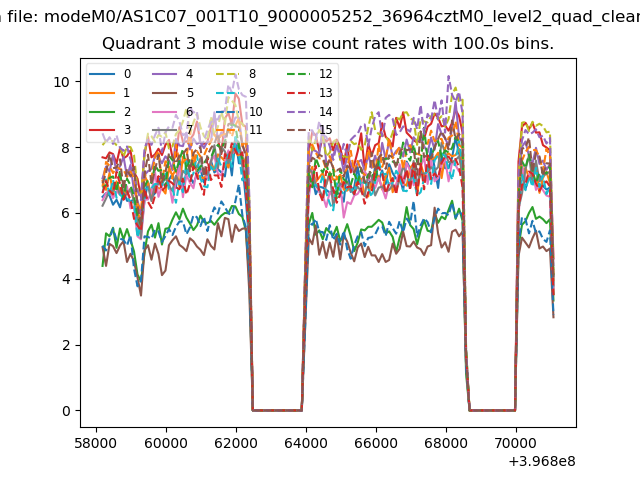
| Module-wise count rates for Quadrant A Data is divided into 100 sec bins |
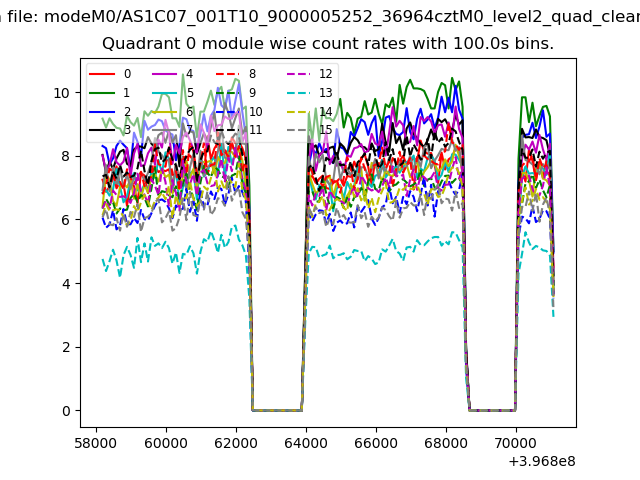 |
 |
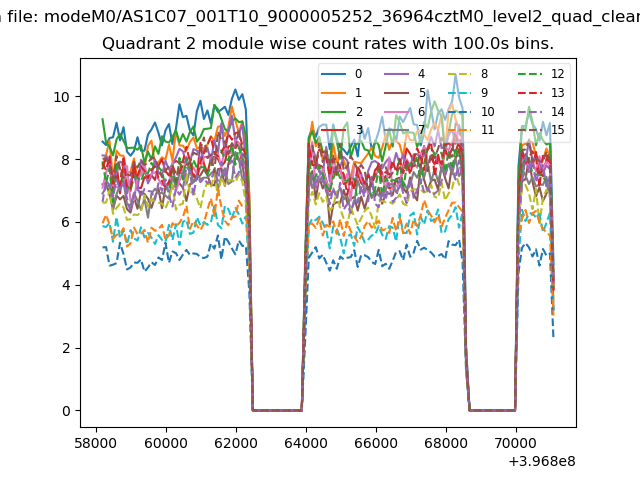
| Module-wise count rates for Quadrant B Data is divided into 100 sec bins |
 |
 |
| Module-wise count rates for Quadrant C Data is divided into 100 sec bins |
 |
 |
| Module-wise count rates for Quadrant D Data is divided into 100 sec bins |
 |
 |
| Parameter | Plot |
|---|---|
| CZT HV Monitor | 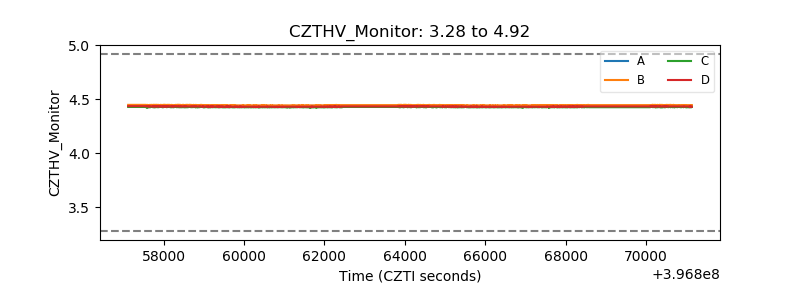 |
| D_VDD | 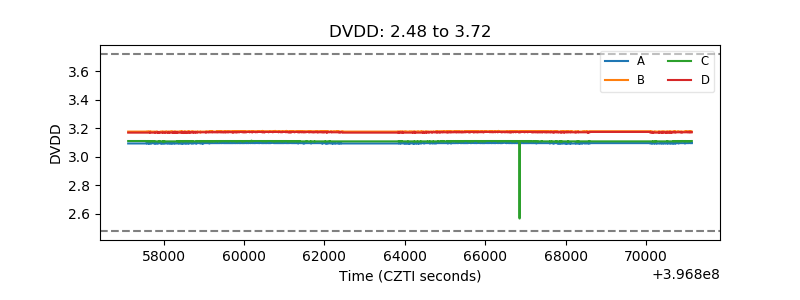 |
| Temperature 1 | 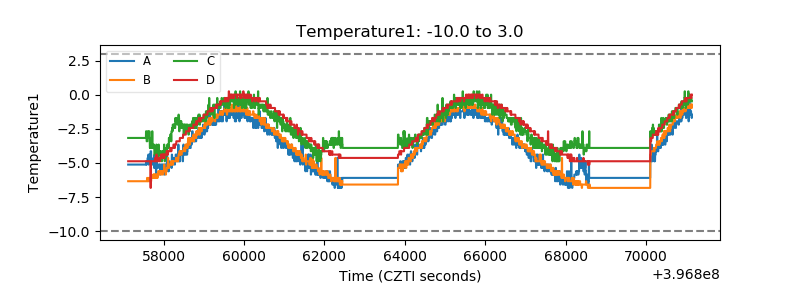 |
| Veto HV Monitor | 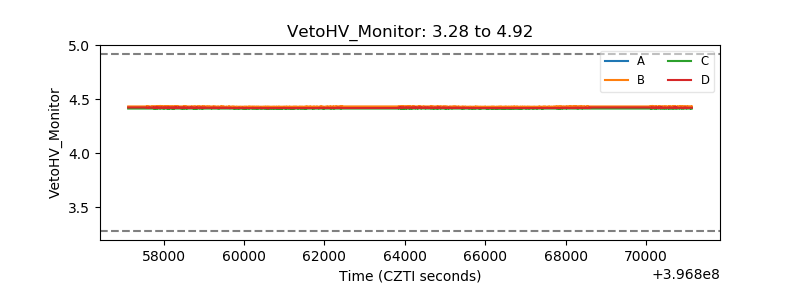 |
| Veto LLD | 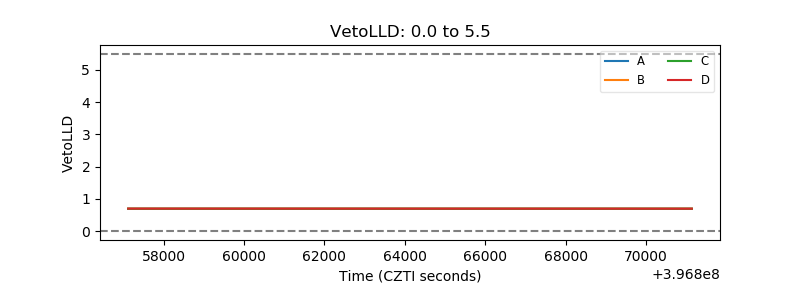 |
| Alpha Counter | 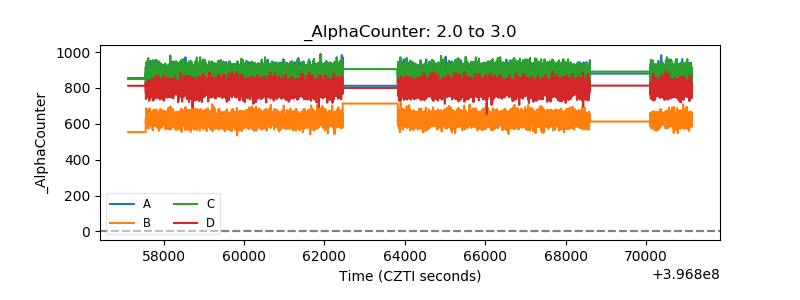 |
| _CPM_Rate | 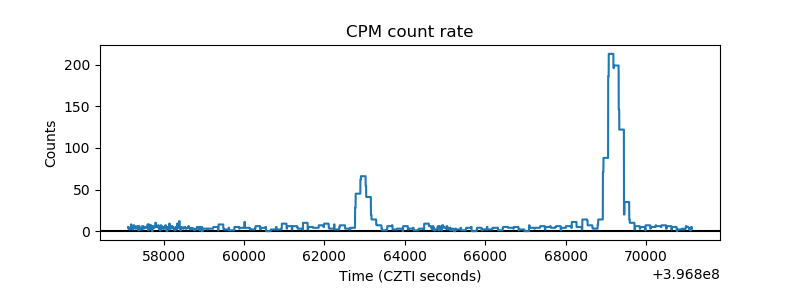 |
| CZT Counter | 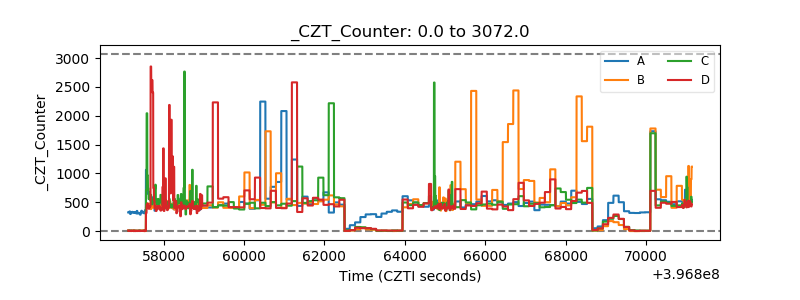 |
| +2.5 Volts monitor | 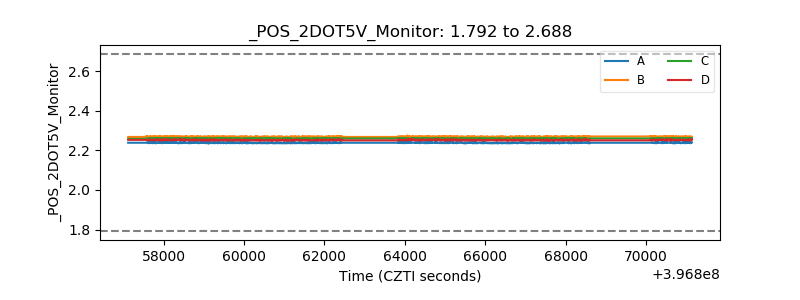 |
| +5 Volts monitor | 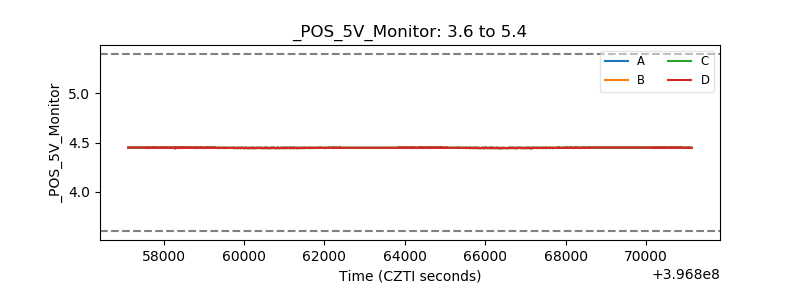 |
| _ROLL_ROT | 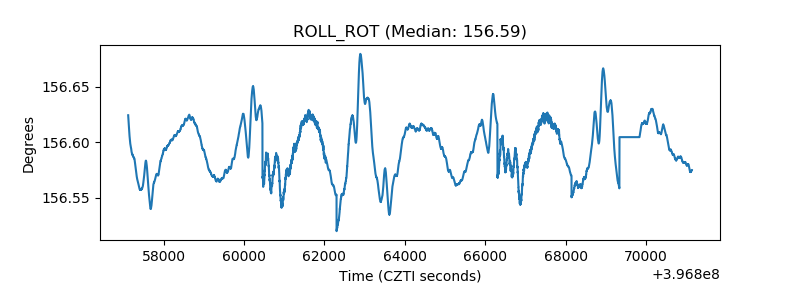 |
| _Roll_DEC | 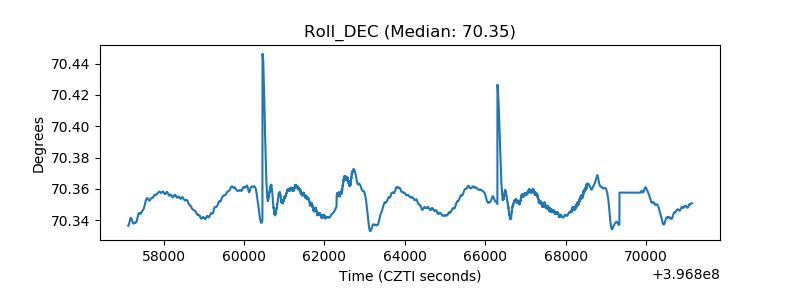 |
| _Roll_RA | 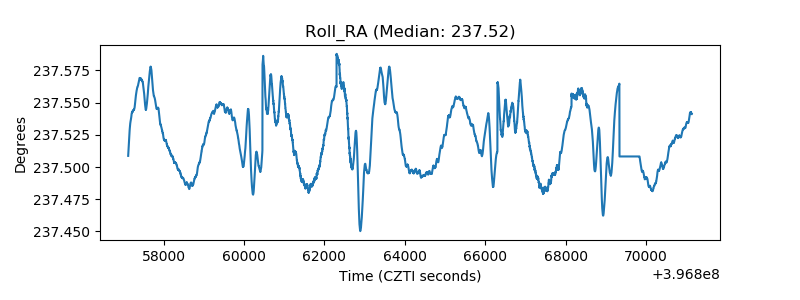 |
| Veto Counter | 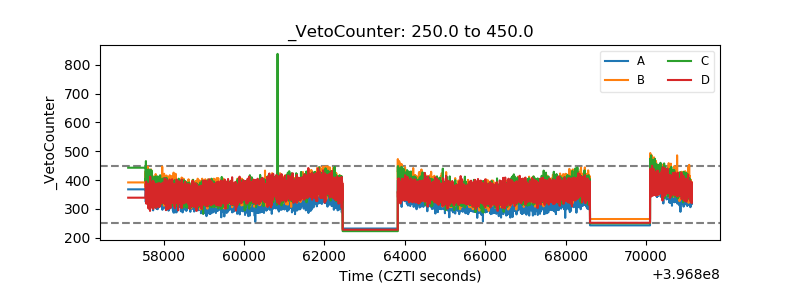 |