| Param | Original file | Final file |
|---|---|---|
| Filename | modeM0/AS1C07_001T10_9000005252_36965cztM0_level2.evt | modeM0/AS1C07_001T10_9000005252_36965cztM0_level2_quad_clean.evt |
| Size (bytes) | 472,167,360 | 102,657,600 |
| Size | 450.3 MB | 97.9 MB |
| Events in quadrant A | 2,834,593 | 697,945 |
| Events in quadrant B | 4,721,656 | 665,434 |
| Events in quadrant C | 3,151,659 | 682,286 |
| Events in quadrant D | 3,204,930 | 664,814 |
| Mode M0 | |||
|---|---|---|---|
| Quadrant | BADHDUFLAG | Total packets | Discarded packets |
| A | 0 | 12034 | 3 |
| B | 0 | 17929 | 2 |
| C | 0 | 12873 | 2 |
| D | 0 | 13328 | 2 |
| Mode SS | |||
|---|---|---|---|
| Quadrant | BADHDUFLAG | Total packets | Discarded packets |
| A | 0 | 116 | 0 |
| B | 0 | 116 | 0 |
| C | 0 | 116 | 0 |
| D | 0 | 116 | 0 |
| Mode M9 | |||
|---|---|---|---|
| Quadrant | BADHDUFLAG | Total packets | Discarded packets |
| A | 0 | 17 | 0 |
| B | 0 | 17 | 0 |
| C | 0 | 17 | 0 |
| D | 0 | 18 | 0 |
| Quadrant | Total seconds | Saturated seconds | Saturation percentage |
|---|---|---|---|
| A | 5698 | 8 | 0.140400% |
| B | 5698 | 528 | 9.266409% |
| C | 5698 | 49 | 0.859951% |
| D | 5698 | 75 | 1.316251% |
Noise dominated data is calculated using 1-second bins in cleaned event files. If a bin has >2000 counts, and if more than 50% of those come from <1% of pixels, then it is considered to be noise-dominated and hence unusable.
| Quadrant | # 1 sec bins | Bins with >0 counts | Bins with >2000 counts | High rate bins dominated by noise | Noise dominated (total time) | Noise dominated (detector-on time) | Marked lightcurve |
|---|---|---|---|---|---|---|---|
| A | 7311 | 5699 | 1 | 1 | 0.01% | 0.02% | 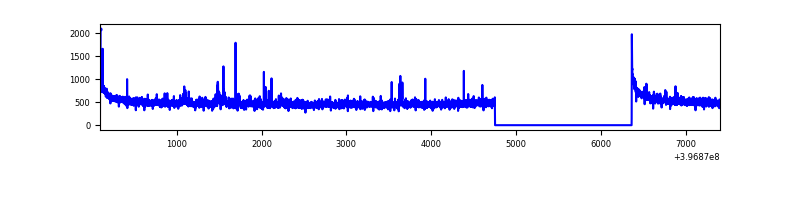 |
| B | 7311 | 5699 | 376 | 376 | 5.14% | 6.60% | 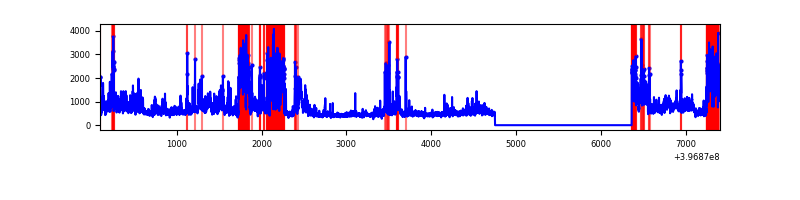 |
| C | 7311 | 5699 | 47 | 47 | 0.64% | 0.82% | 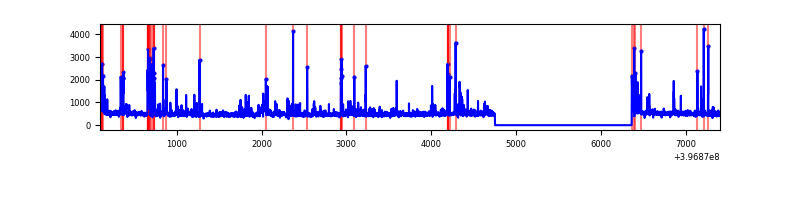 |
| D | 7311 | 5699 | 57 | 57 | 0.78% | 1.00% | 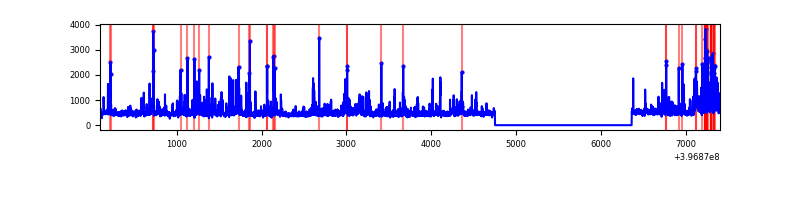 |
Top three noisy pixels from each quadrant. If the there are fewer than three noisy pixels in the level2.evt file, extra rows are filled as -1
| Pixel properties | Quadrant properties | ||||||
|---|---|---|---|---|---|---|---|
| Quadrant | DetID | PixID | Counts | Sigma | Mean | Median | Sigma |
| A | 10 | 83 | 258185 | 1980.98 | 637 | 623 | 130.0 |
| A | 12 | 189 | 56012 | 426.01 | 637 | 623 | 130.0 |
| A | 13 | 6 | 18154 | 134.84 | 637 | 623 | 130.0 |
| B | 5 | 184 | 1765773 | 15310.92 | 611 | 595 | 115.3 |
| B | 0 | 229 | 78555 | 676.21 | 611 | 595 | 115.3 |
| B | 4 | 81 | 76978 | 662.54 | 611 | 595 | 115.3 |
| C | 15 | 214 | 250288 | 1743.23 | 616 | 620 | 143.2 |
| C | 0 | 207 | 106786 | 741.27 | 616 | 620 | 143.2 |
| C | 14 | 254 | 104486 | 725.21 | 616 | 620 | 143.2 |
| D | 1 | 52 | 245966 | 1615.63 | 620 | 603 | 151.9 |
| D | 12 | 233 | 80193 | 524.07 | 620 | 603 | 151.9 |
| D | 2 | 249 | 69599 | 454.31 | 620 | 603 | 151.9 |
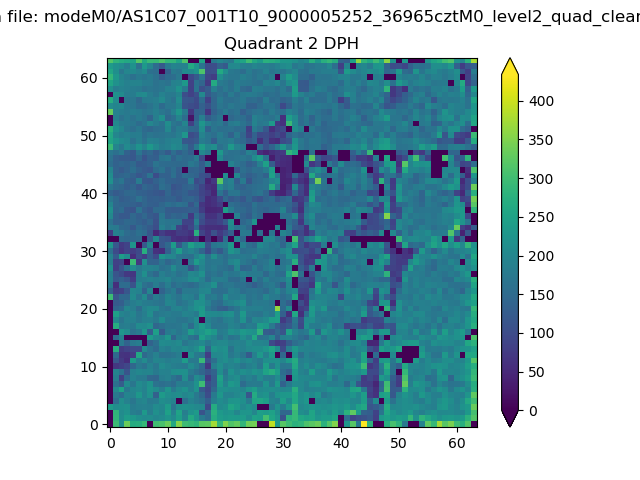
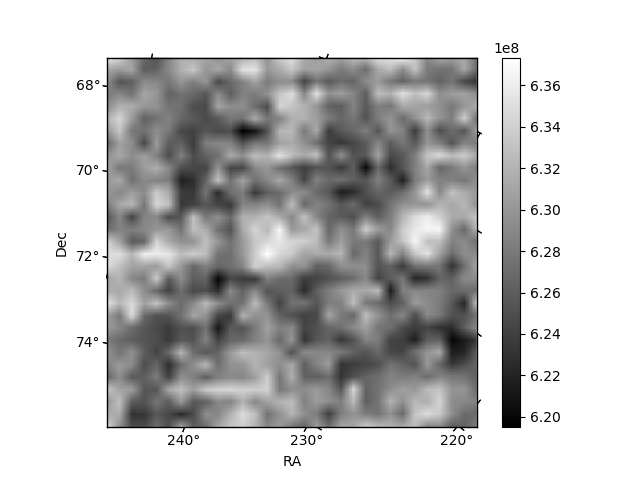
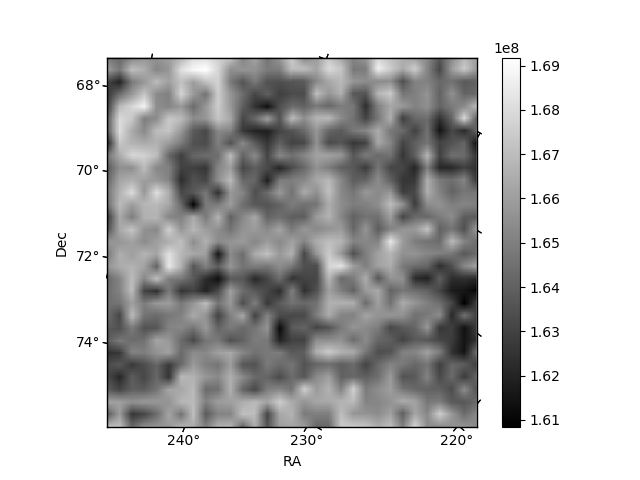
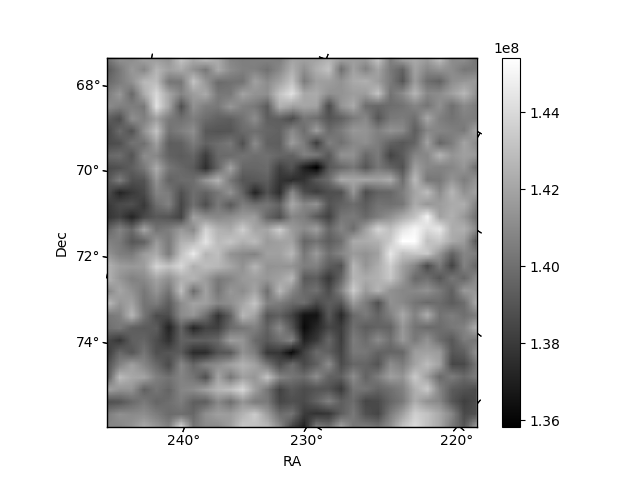
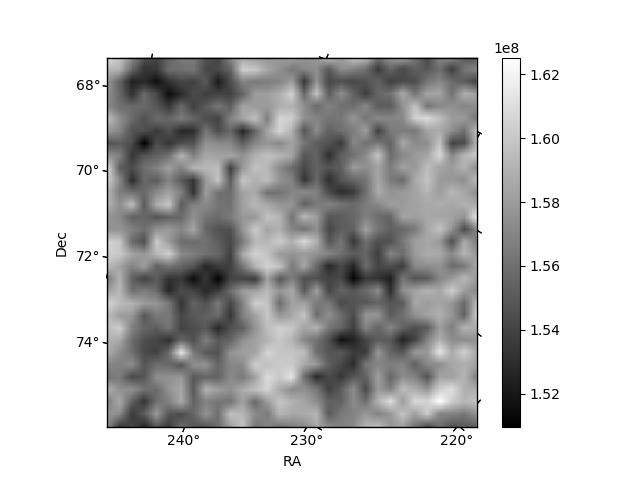
Histogram calculated using DETX and DETY for each event in the final _common_clean file
| Quadrant A | 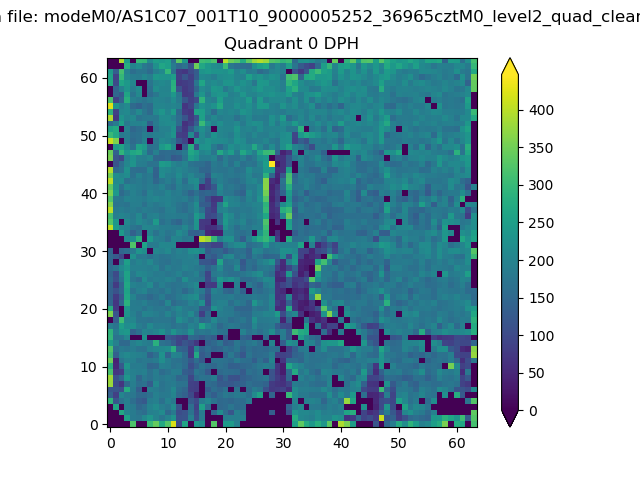 |
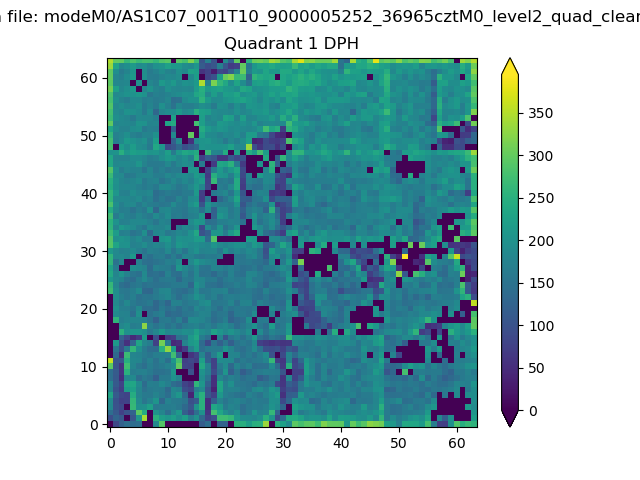 |
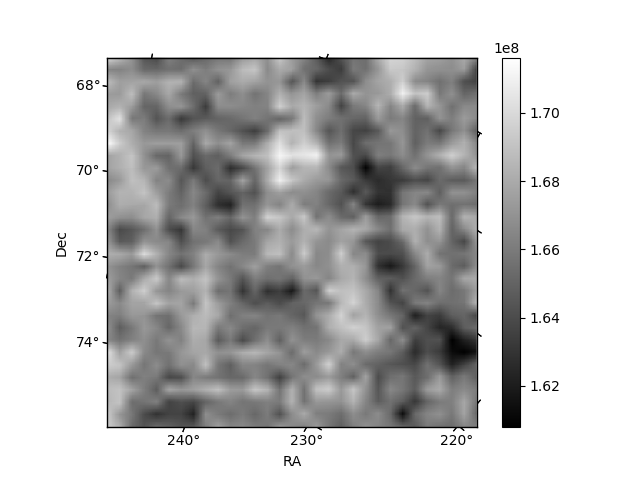
Quadrant B |
|---|---|---|---|
| Quadrant D | 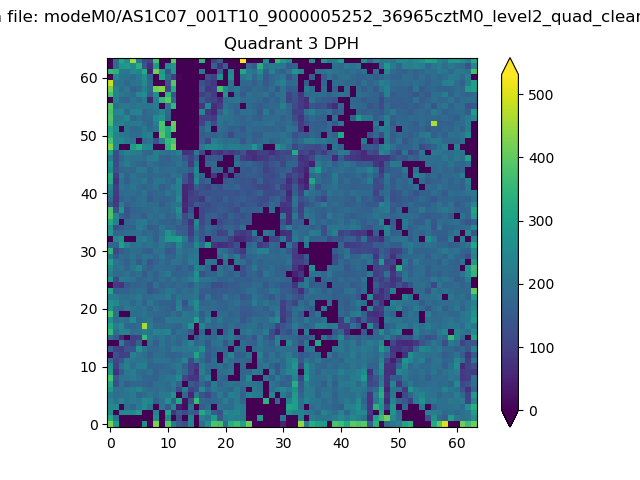 |
 |
Quadrant C |
| Plot type | Count rate plots | Images |
|---|---|---|
| Comparison with Poisson distribution Blue bars denote a histogram of data divided into 1 sec bins. Red curve is a Poisson curve with rate = median count rate of data. |
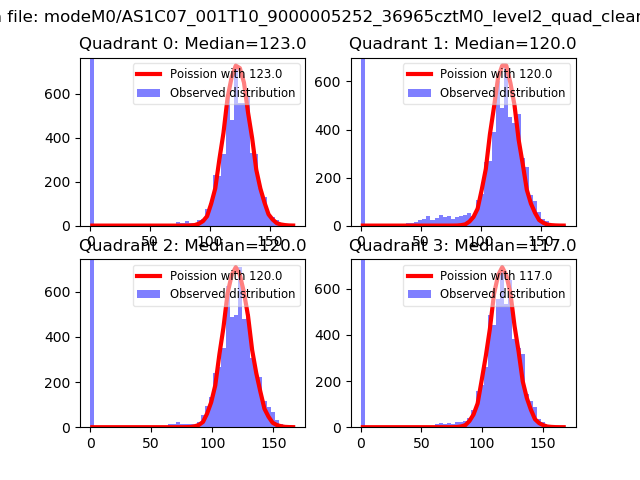 |
 |
| Quadrant-wise count rates Data is divided into 100 sec bins |
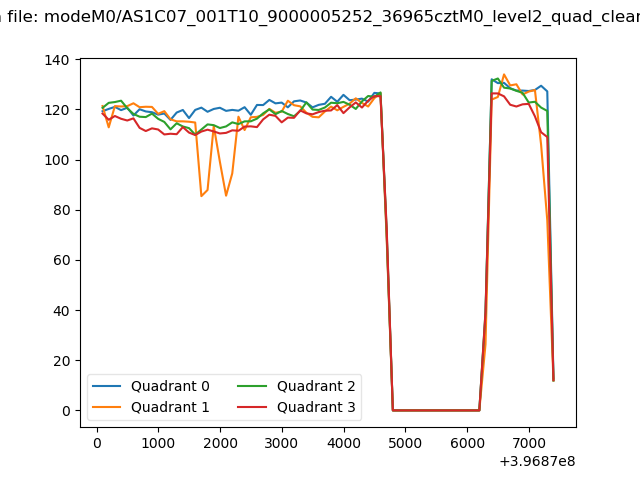 |
|
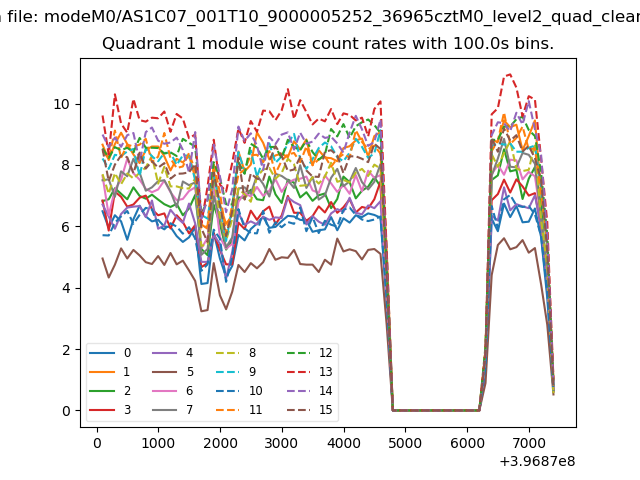
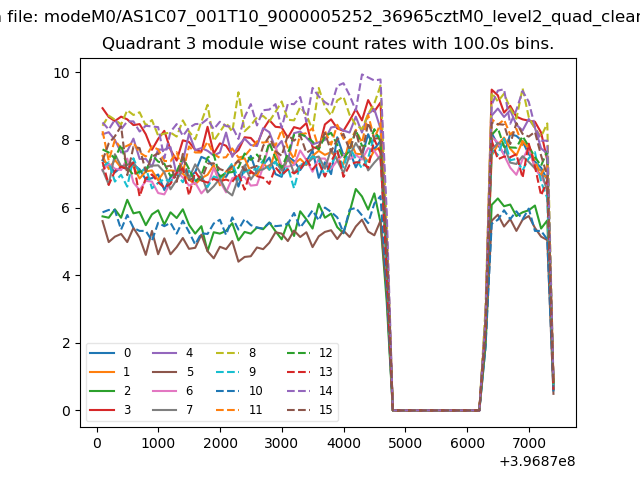
| Module-wise count rates for Quadrant A Data is divided into 100 sec bins |
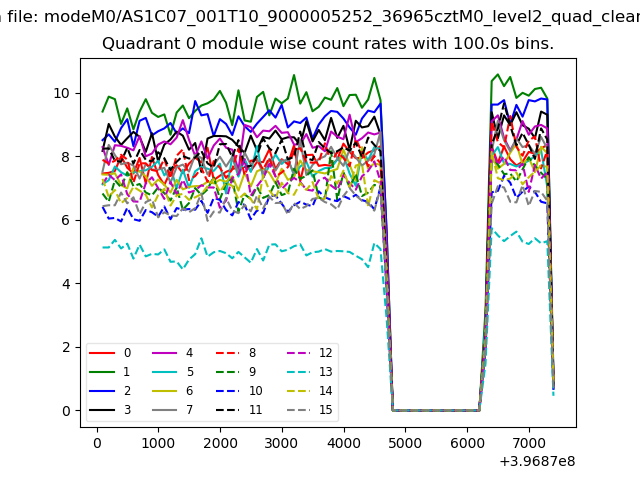 |
 |
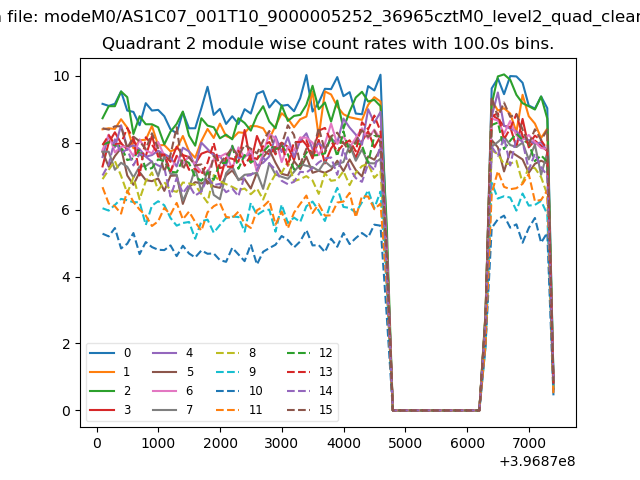
| Module-wise count rates for Quadrant B Data is divided into 100 sec bins |
 |
 |
| Module-wise count rates for Quadrant C Data is divided into 100 sec bins |
 |
 |
| Module-wise count rates for Quadrant D Data is divided into 100 sec bins |
 |
 |
| Parameter | Plot |
|---|---|
| CZT HV Monitor | 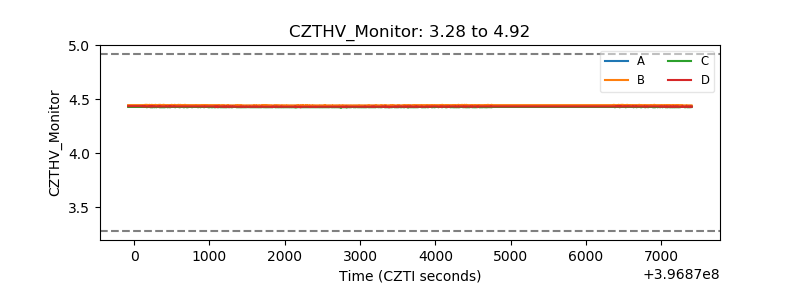 |
| D_VDD | 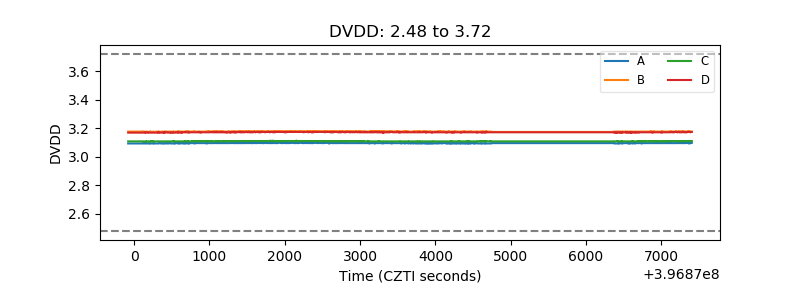 |
| Temperature 1 | 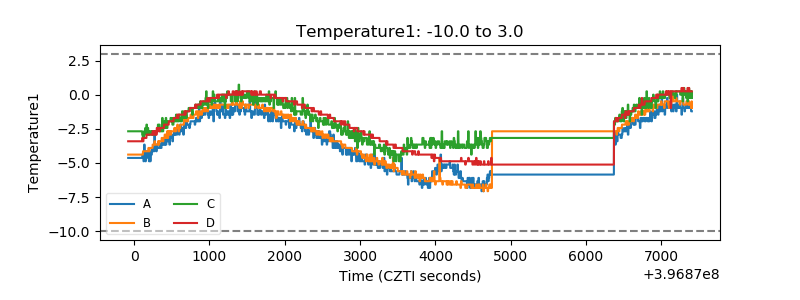 |
| Veto HV Monitor | 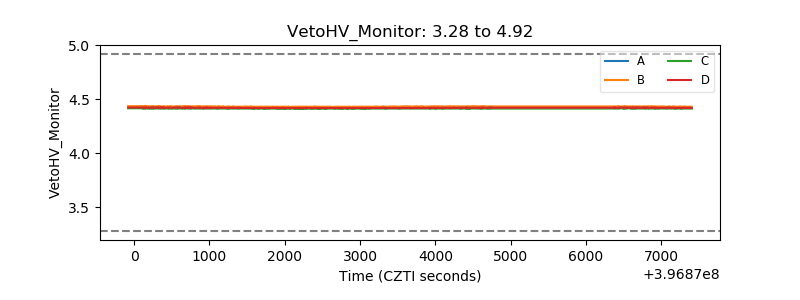 |
| Veto LLD | 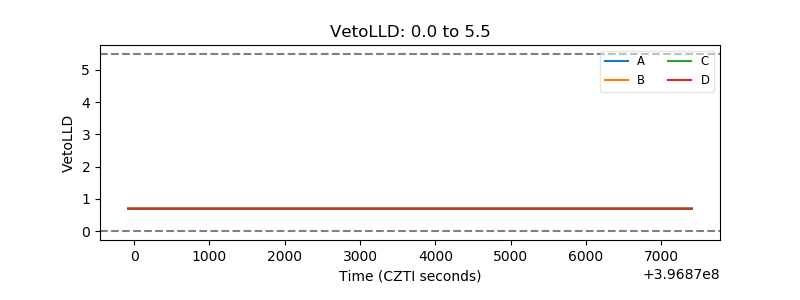 |
| Alpha Counter | 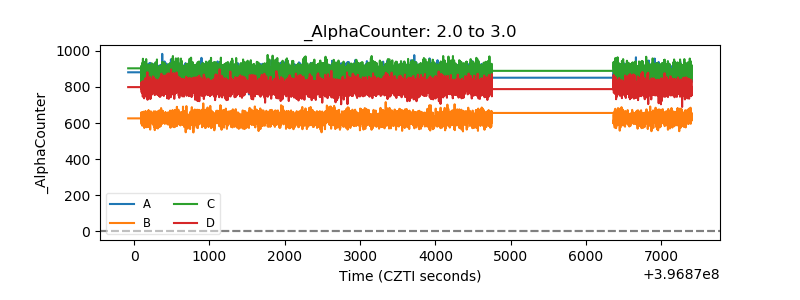 |
| _CPM_Rate |  |
| CZT Counter | 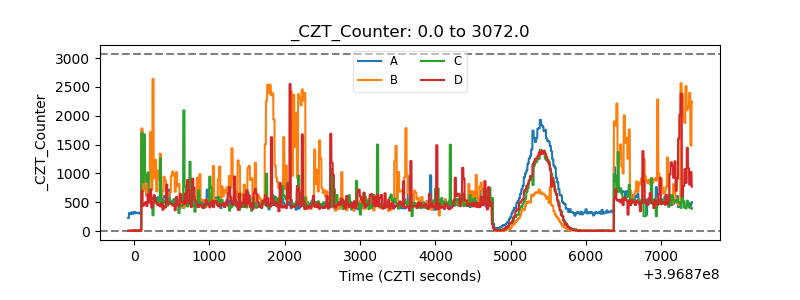 |
| +2.5 Volts monitor | 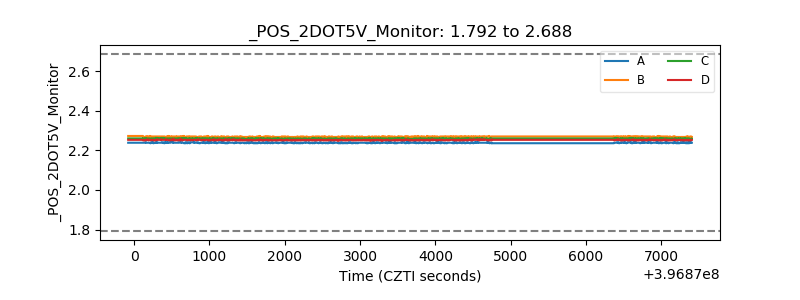 |
| +5 Volts monitor | 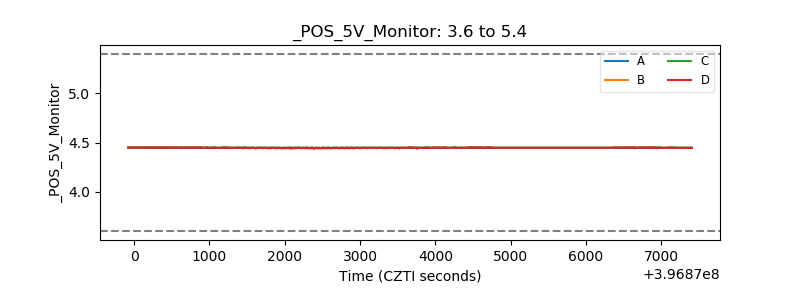 |
| _ROLL_ROT | 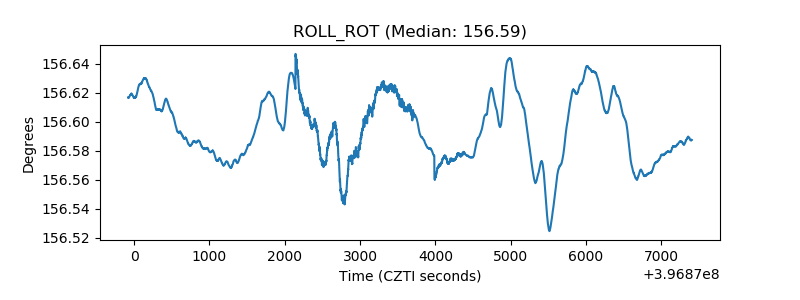 |
| _Roll_DEC | 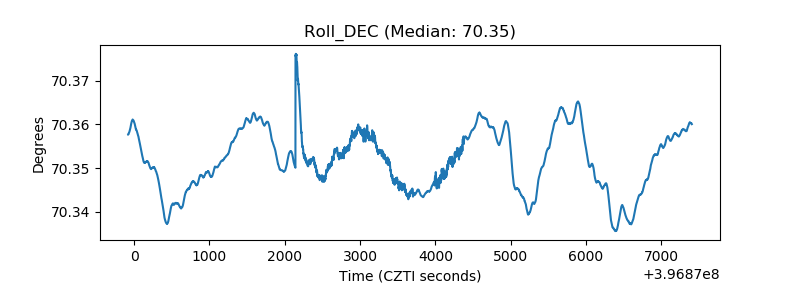 |
| _Roll_RA | 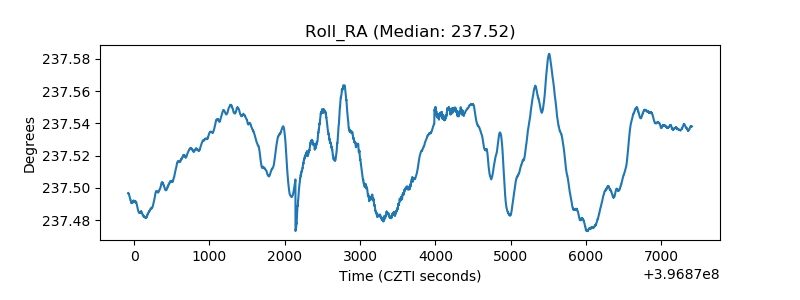 |
| Veto Counter | 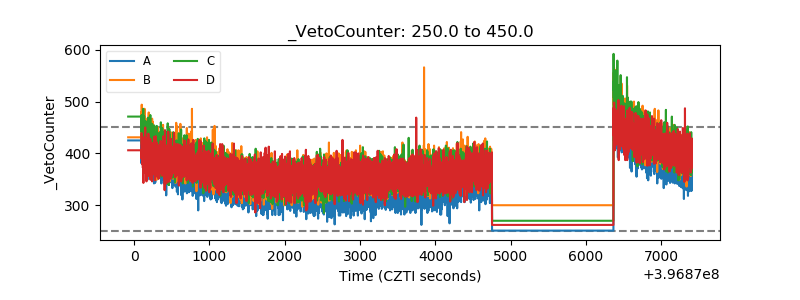 |