| Param | Original file | Final file |
|---|---|---|
| Filename | modeM0/AS1C07_001T10_9000005252_36966cztM0_level2.evt | modeM0/AS1C07_001T10_9000005252_36966cztM0_level2_quad_clean.evt |
| Size (bytes) | 523,477,440 | 95,702,400 |
| Size | 499.2 MB | 91.3 MB |
| Events in quadrant A | 2,737,522 | 668,781 |
| Events in quadrant B | 5,241,399 | 614,424 |
| Events in quadrant C | 2,857,651 | 649,108 |
| Events in quadrant D | 4,661,425 | 597,911 |
| Mode M0 | |||
|---|---|---|---|
| Quadrant | BADHDUFLAG | Total packets | Discarded packets |
| A | 0 | 11503 | 2 |
| B | 0 | 19157 | 1 |
| C | 0 | 11733 | 1 |
| D | 0 | 17363 | 1 |
| Mode SS | |||
|---|---|---|---|
| Quadrant | BADHDUFLAG | Total packets | Discarded packets |
| A | 0 | 108 | 0 |
| B | 0 | 108 | 0 |
| C | 0 | 108 | 0 |
| D | 0 | 108 | 0 |
| Mode M9 | |||
|---|---|---|---|
| Quadrant | BADHDUFLAG | Total packets | Discarded packets |
| A | 0 | 17 | 0 |
| B | 0 | 17 | 0 |
| C | 0 | 17 | 0 |
| D | 0 | 17 | 0 |
| Quadrant | Total seconds | Saturated seconds | Saturation percentage |
|---|---|---|---|
| A | 5244 | 9 | 0.171625% |
| B | 5244 | 787 | 15.007628% |
| C | 5244 | 46 | 0.877193% |
| D | 5244 | 521 | 9.935164% |
Noise dominated data is calculated using 1-second bins in cleaned event files. If a bin has >2000 counts, and if more than 50% of those come from <1% of pixels, then it is considered to be noise-dominated and hence unusable.
| Quadrant | # 1 sec bins | Bins with >0 counts | Bins with >2000 counts | High rate bins dominated by noise | Noise dominated (total time) | Noise dominated (detector-on time) | Marked lightcurve |
|---|---|---|---|---|---|---|---|
| A | 6946 | 5245 | 0 | 0 | 0.00% | 0.00% | 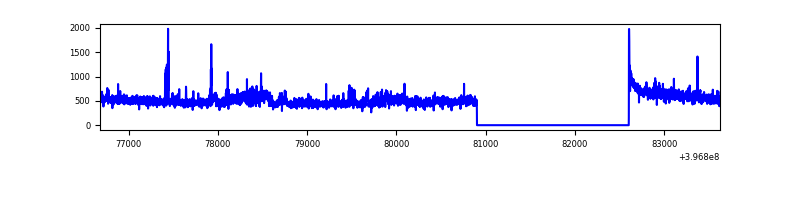 |
| B | 6946 | 5245 | 623 | 623 | 8.97% | 11.88% | 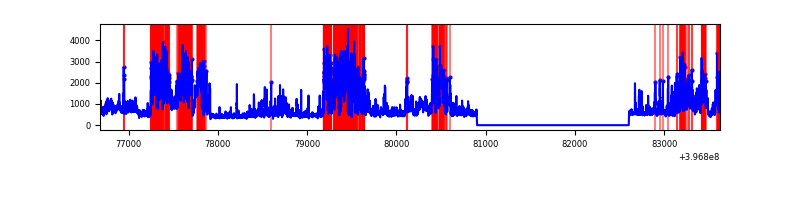 |
| C | 6946 | 5245 | 33 | 33 | 0.48% | 0.63% | 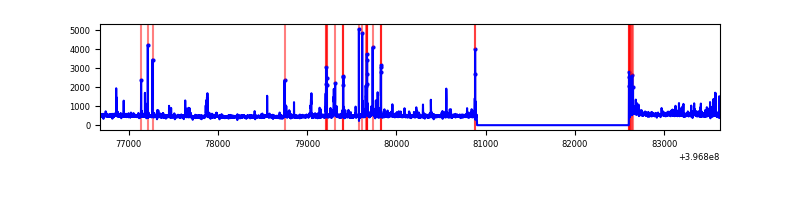 |
| D | 6946 | 5245 | 475 | 475 | 6.84% | 9.06% | 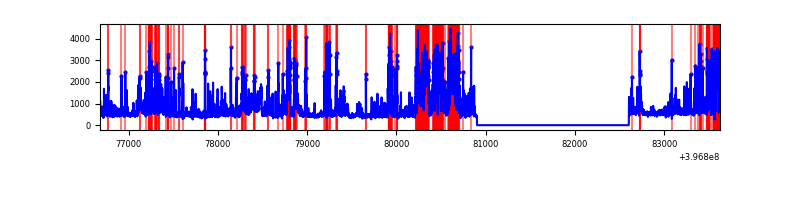 |
Top three noisy pixels from each quadrant. If the there are fewer than three noisy pixels in the level2.evt file, extra rows are filled as -1
| Pixel properties | Quadrant properties | ||||||
|---|---|---|---|---|---|---|---|
| Quadrant | DetID | PixID | Counts | Sigma | Mean | Median | Sigma |
| A | 10 | 83 | 205524 | 1701.53 | 593 | 580 | 120.4 |
| A | 12 | 189 | 180441 | 1493.28 | 593 | 580 | 120.4 |
| A | 13 | 6 | 20195 | 162.85 | 593 | 580 | 120.4 |
| B | 5 | 184 | 1933634 | 18419.42 | 555 | 541 | 104.9 |
| B | 4 | 171 | 449421 | 4277.14 | 555 | 541 | 104.9 |
| B | 5 | 172 | 241644 | 2297.34 | 555 | 541 | 104.9 |
| C | 15 | 214 | 226939 | 1699.23 | 575 | 579 | 133.2 |
| C | 14 | 254 | 133526 | 998.0 | 575 | 579 | 133.2 |
| C | 0 | 10 | 100033 | 746.58 | 575 | 579 | 133.2 |
| D | 12 | 17 | 1212677 | 9037.58 | 556 | 540 | 134.1 |
| D | 2 | 250 | 446010 | 3321.38 | 556 | 540 | 134.1 |
| D | 1 | 52 | 278852 | 2075.07 | 556 | 540 | 134.1 |
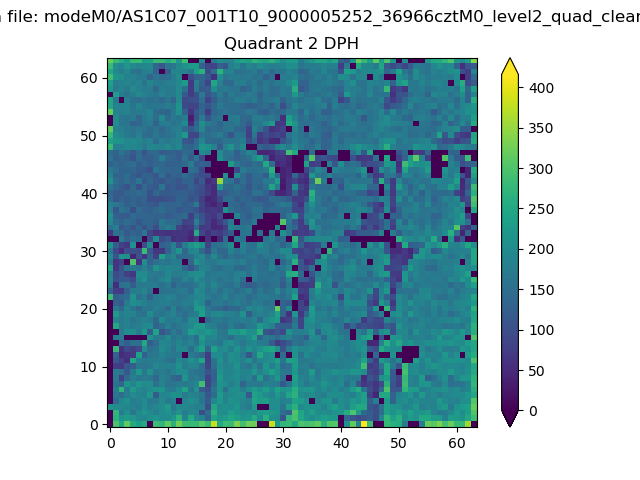
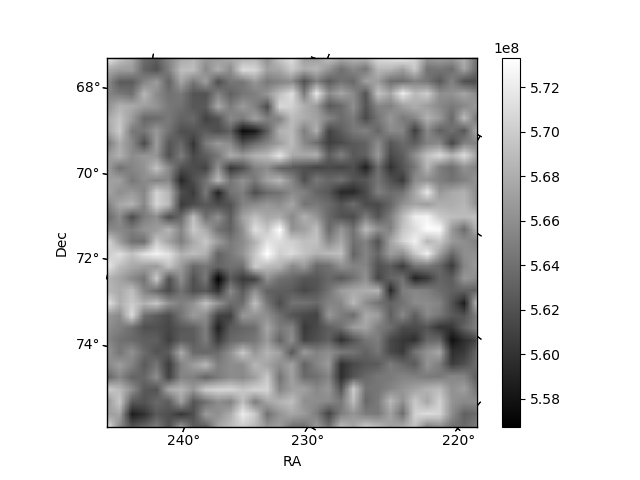
Histogram calculated using DETX and DETY for each event in the final _common_clean file
| Quadrant A | 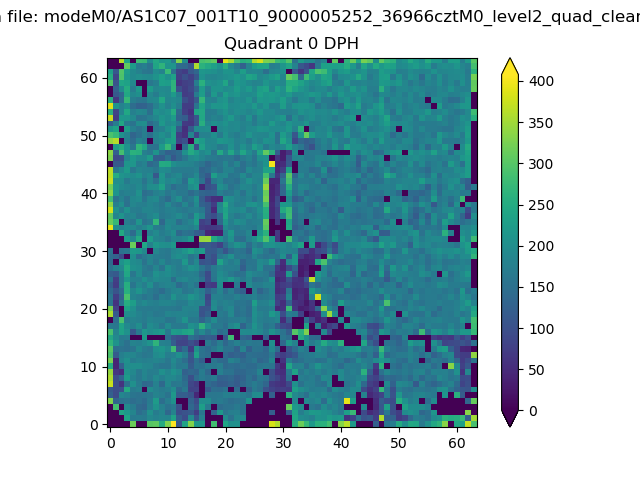 |
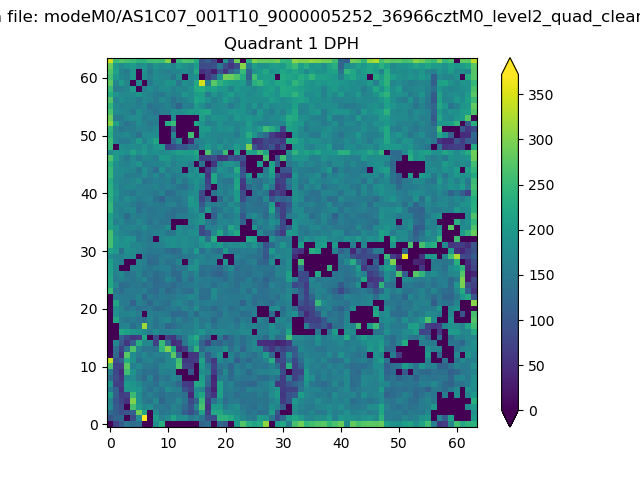 |
Quadrant B |
|---|---|---|---|
| Quadrant D | 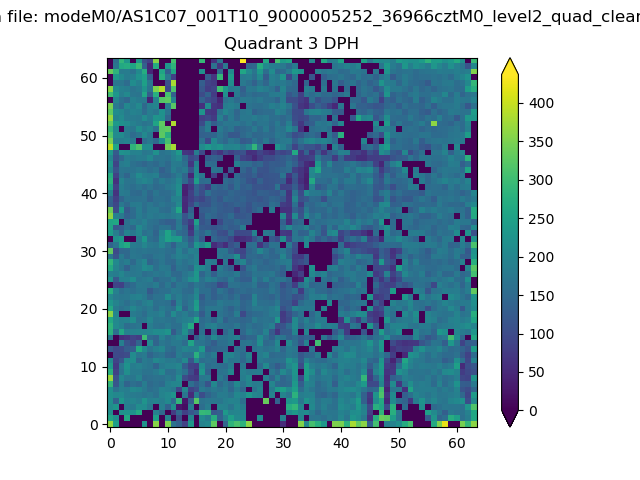 |
 |
Quadrant C |
| Plot type | Count rate plots | Images |
|---|---|---|
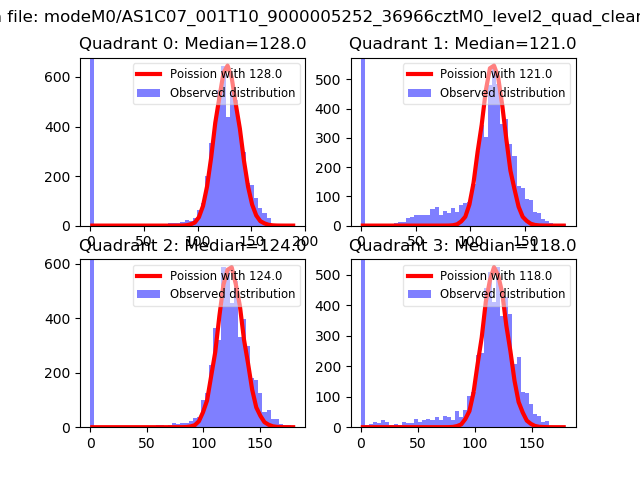
| Comparison with Poisson distribution Blue bars denote a histogram of data divided into 1 sec bins. Red curve is a Poisson curve with rate = median count rate of data. |
 |
 |
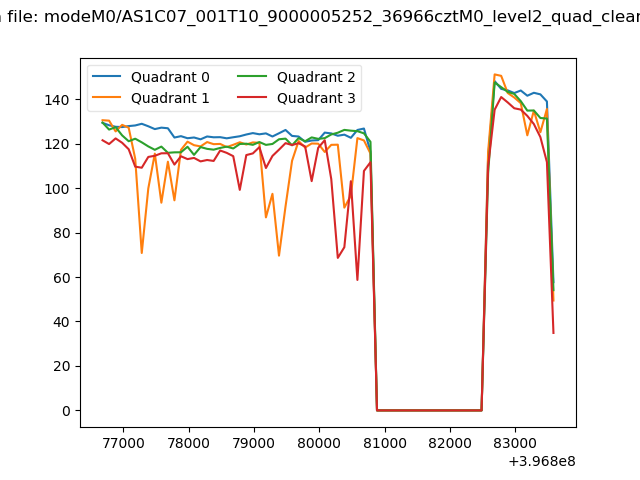
| Quadrant-wise count rates Data is divided into 100 sec bins |
 |
|
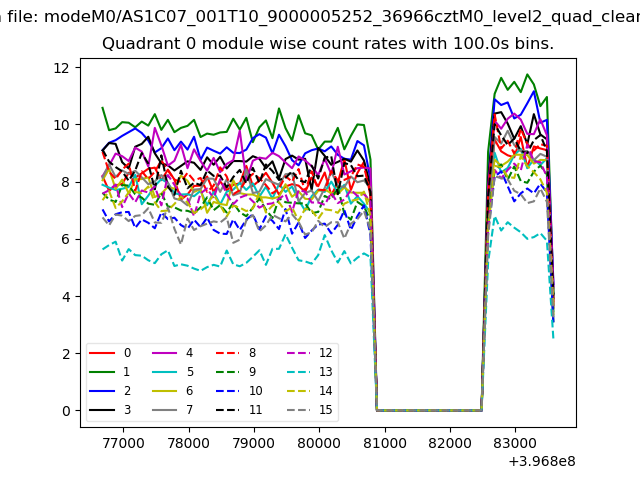
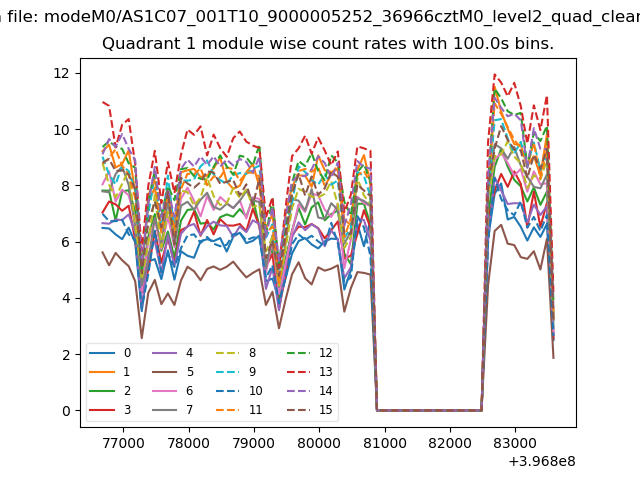
| Module-wise count rates for Quadrant A Data is divided into 100 sec bins |
 |
 |
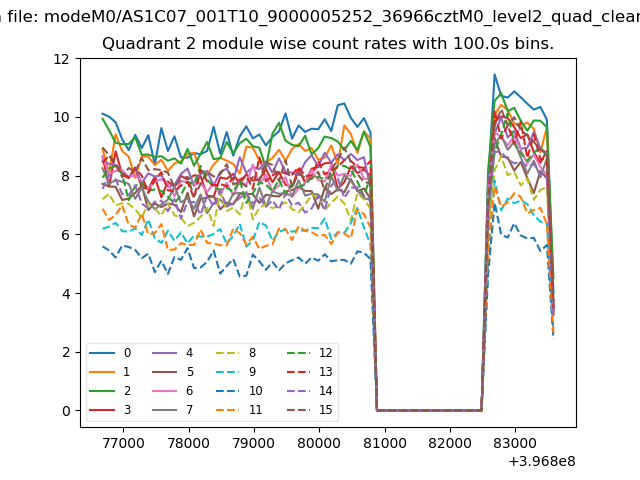
| Module-wise count rates for Quadrant B Data is divided into 100 sec bins |
 |
 |
| Module-wise count rates for Quadrant C Data is divided into 100 sec bins |
 |
 |
| Module-wise count rates for Quadrant D Data is divided into 100 sec bins |
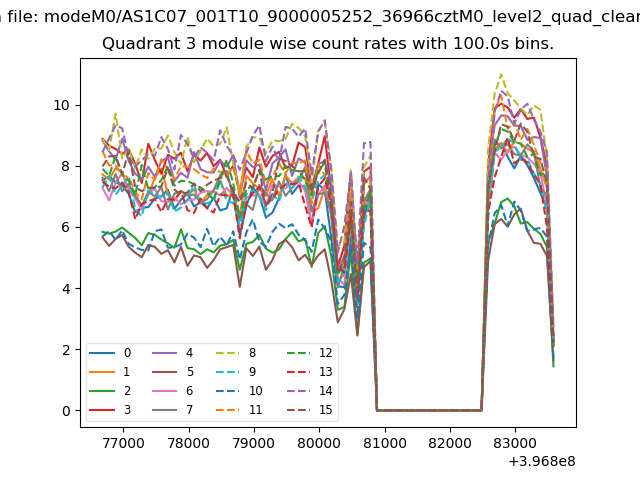 |
 |
| Parameter | Plot |
|---|---|
| CZT HV Monitor | 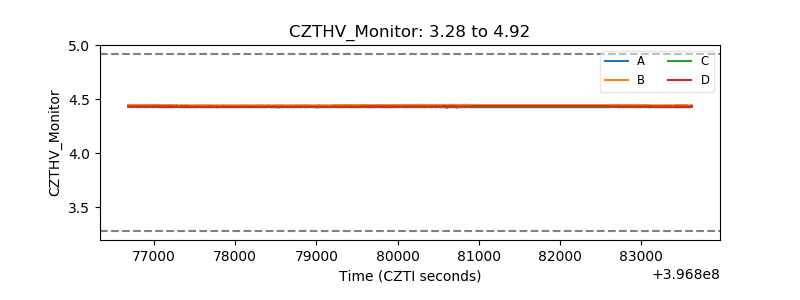 |
| D_VDD | 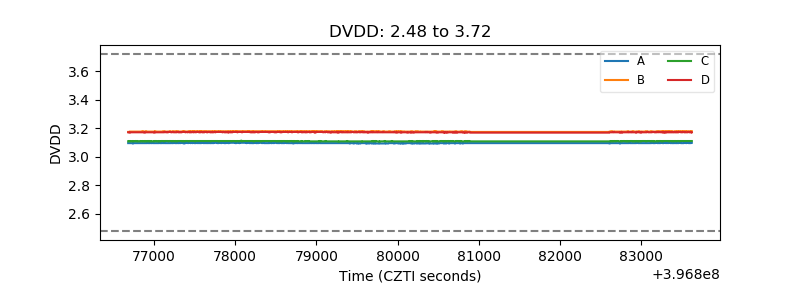 |
| Temperature 1 | 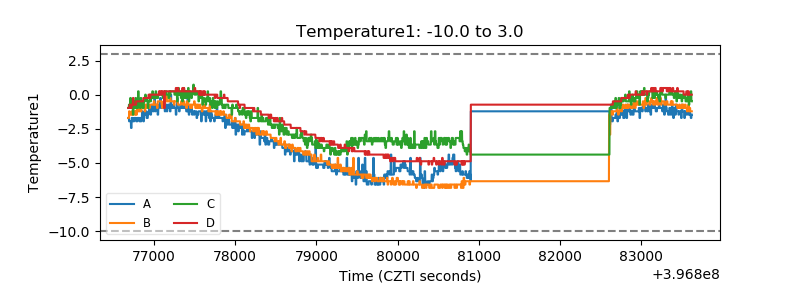 |
| Veto HV Monitor |  |
| Veto LLD | 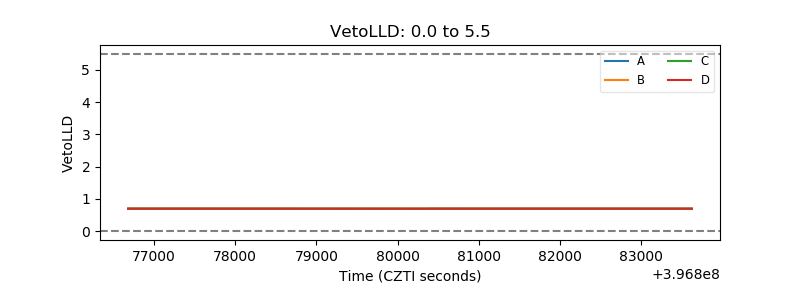 |
| Alpha Counter | 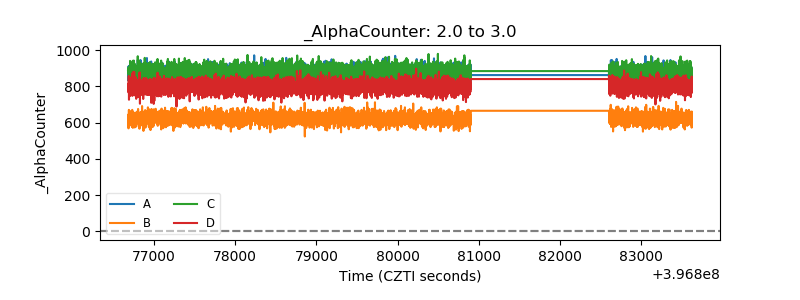 |
| _CPM_Rate | 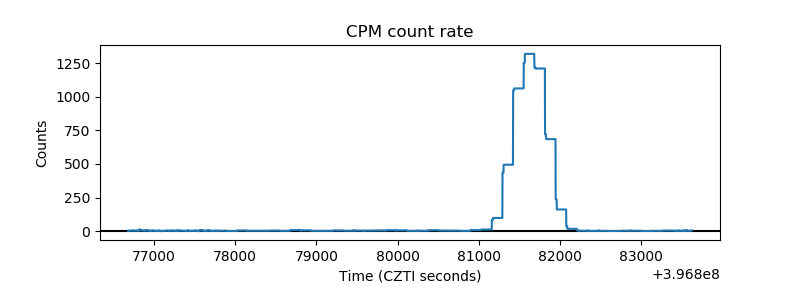 |
| CZT Counter | 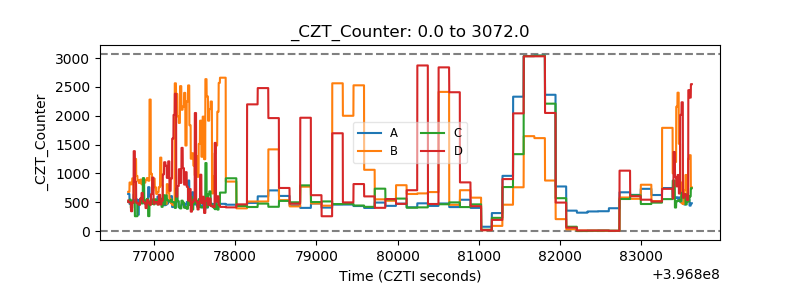 |
| +2.5 Volts monitor | 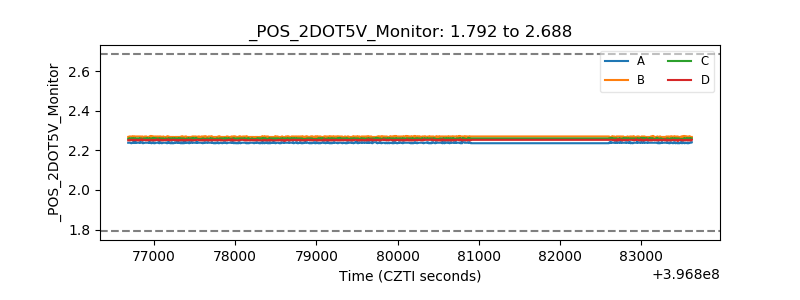 |
| +5 Volts monitor | 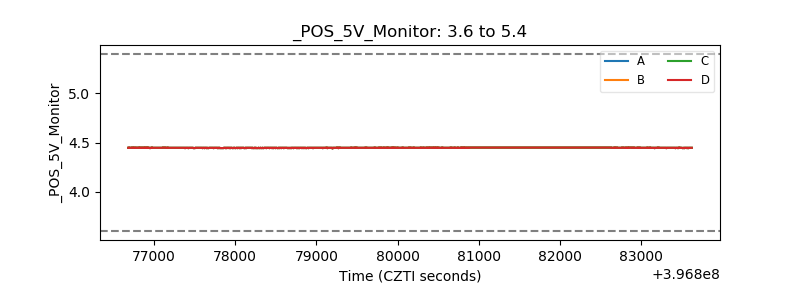 |
| _ROLL_ROT | 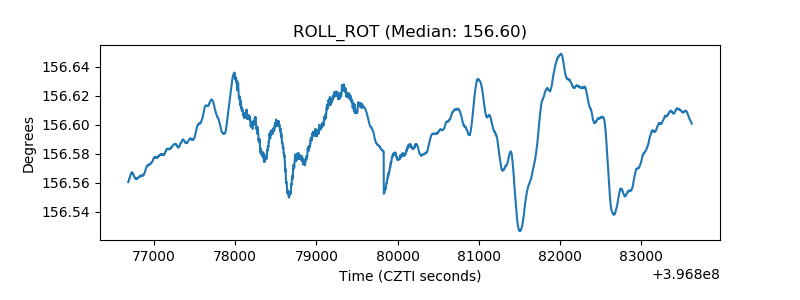 |
| _Roll_DEC | 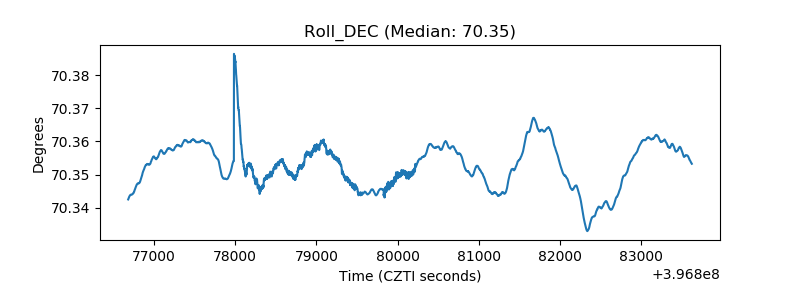 |
| _Roll_RA | 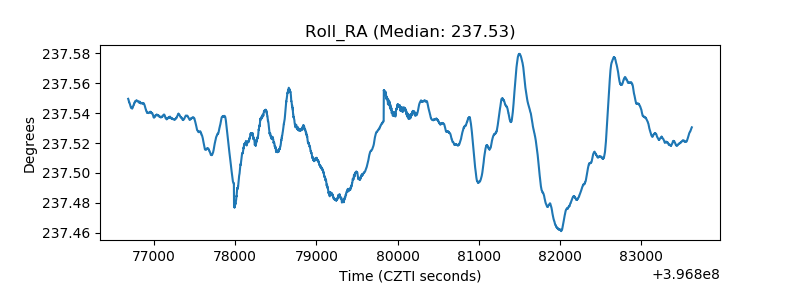 |
| Veto Counter | 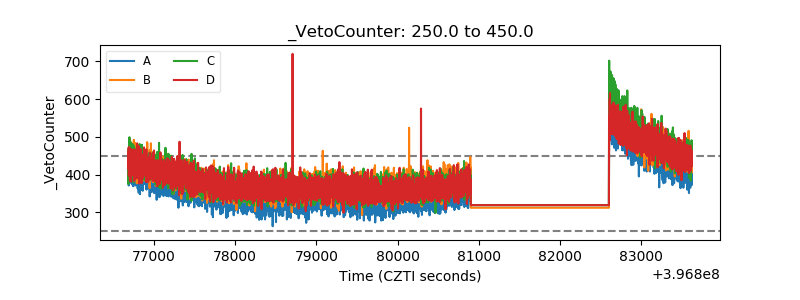 |