| Param | Original file | Final file |
|---|---|---|
| Filename | modeM0/AS1C07_001T10_9000005252_36968cztM0_level2.evt | modeM0/AS1C07_001T10_9000005252_36968cztM0_level2_quad_clean.evt |
| Size (bytes) | 489,337,920 | 99,800,640 |
| Size | 466.7 MB | 95.2 MB |
| Events in quadrant A | 3,063,089 | 682,864 |
| Events in quadrant B | 3,928,128 | 664,541 |
| Events in quadrant C | 2,880,233 | 675,984 |
| Events in quadrant D | 4,585,406 | 624,306 |
| Mode M0 | |||
|---|---|---|---|
| Quadrant | BADHDUFLAG | Total packets | Discarded packets |
| A | 0 | 12755 | 3 |
| B | 0 | 15322 | 2 |
| C | 0 | 11854 | 2 |
| D | 0 | 17240 | 2 |
| Mode SS | |||
|---|---|---|---|
| Quadrant | BADHDUFLAG | Total packets | Discarded packets |
| A | 0 | 110 | 0 |
| B | 0 | 110 | 0 |
| C | 0 | 110 | 0 |
| D | 0 | 110 | 0 |
| Mode M9 | |||
|---|---|---|---|
| Quadrant | BADHDUFLAG | Total packets | Discarded packets |
| A | 0 | 18 | 0 |
| B | 0 | 18 | 0 |
| C | 0 | 18 | 0 |
| D | 0 | 18 | 0 |
| Quadrant | Total seconds | Saturated seconds | Saturation percentage |
|---|---|---|---|
| A | 5347 | 83 | 1.552272% |
| B | 5347 | 206 | 3.852628% |
| C | 5347 | 27 | 0.504956% |
| D | 5348 | 587 | 10.976066% |
Noise dominated data is calculated using 1-second bins in cleaned event files. If a bin has >2000 counts, and if more than 50% of those come from <1% of pixels, then it is considered to be noise-dominated and hence unusable.
| Quadrant | # 1 sec bins | Bins with >0 counts | Bins with >2000 counts | High rate bins dominated by noise | Noise dominated (total time) | Noise dominated (detector-on time) | Marked lightcurve |
|---|---|---|---|---|---|---|---|
| A | 7200 | 5348 | 50 | 50 | 0.69% | 0.93% | 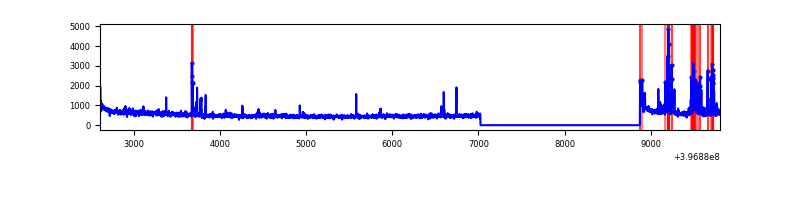 |
| B | 7200 | 5348 | 139 | 139 | 1.93% | 2.60% | 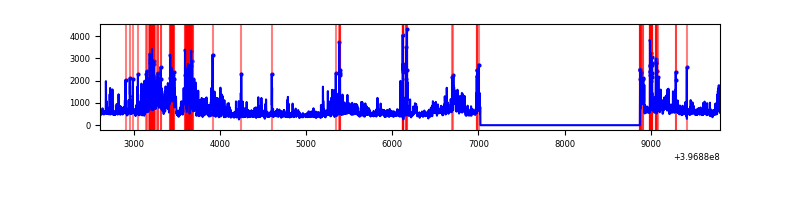 |
| C | 7200 | 5348 | 13 | 13 | 0.18% | 0.24% | 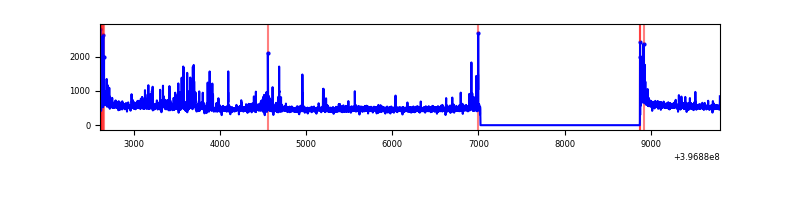 |
| D | 7201 | 5349 | 542 | 542 | 7.53% | 10.13% | 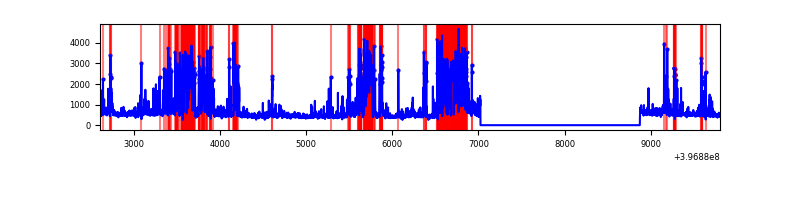 |
Top three noisy pixels from each quadrant. If the there are fewer than three noisy pixels in the level2.evt file, extra rows are filled as -1
| Pixel properties | Quadrant properties | ||||||
|---|---|---|---|---|---|---|---|
| Quadrant | DetID | PixID | Counts | Sigma | Mean | Median | Sigma |
| A | 10 | 83 | 262885 | 2094.45 | 622 | 611 | 125.2 |
| A | 12 | 189 | 135438 | 1076.69 | 622 | 611 | 125.2 |
| A | 13 | 248 | 130984 | 1041.13 | 622 | 611 | 125.2 |
| B | 5 | 184 | 654009 | 5772.15 | 607 | 592 | 113.2 |
| B | 4 | 171 | 242462 | 2136.63 | 607 | 592 | 113.2 |
| B | 0 | 213 | 128183 | 1127.11 | 607 | 592 | 113.2 |
| C | 15 | 214 | 232922 | 1655.12 | 610 | 613 | 140.4 |
| C | 0 | 10 | 141518 | 1003.9 | 610 | 613 | 140.4 |
| C | 1 | 23 | 39876 | 279.73 | 610 | 613 | 140.4 |
| D | 12 | 17 | 1660205 | 11849.68 | 587 | 574 | 140.1 |
| D | 2 | 250 | 171410 | 1219.76 | 587 | 574 | 140.1 |
| D | 2 | 120 | 121944 | 866.58 | 587 | 574 | 140.1 |
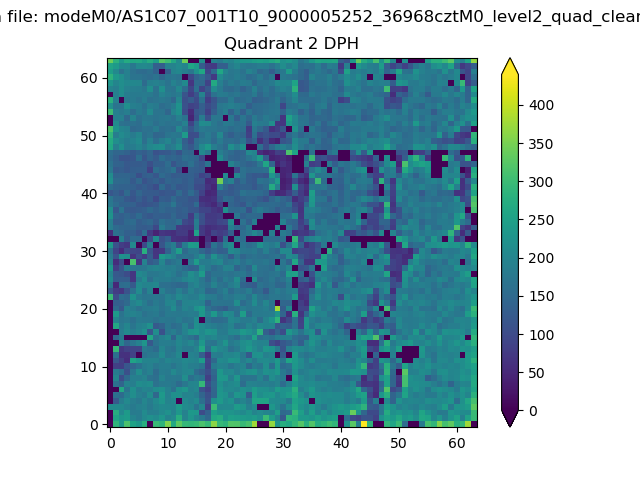
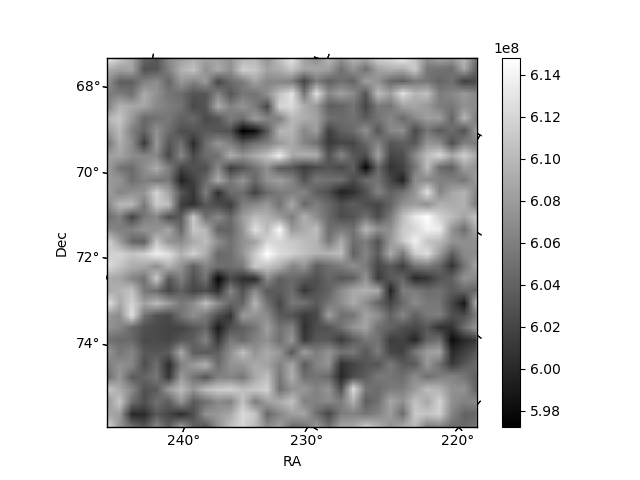
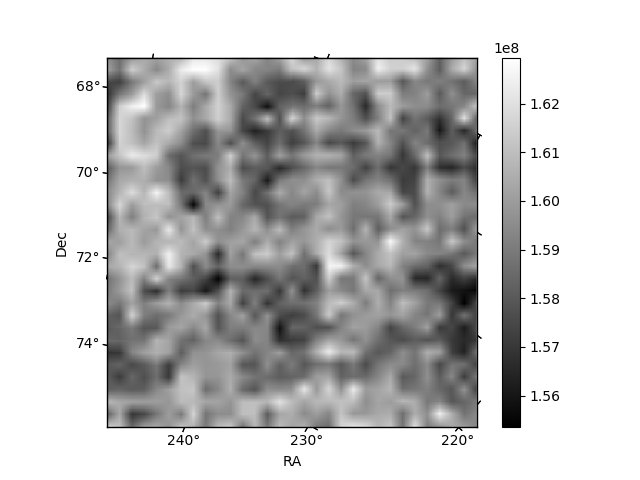
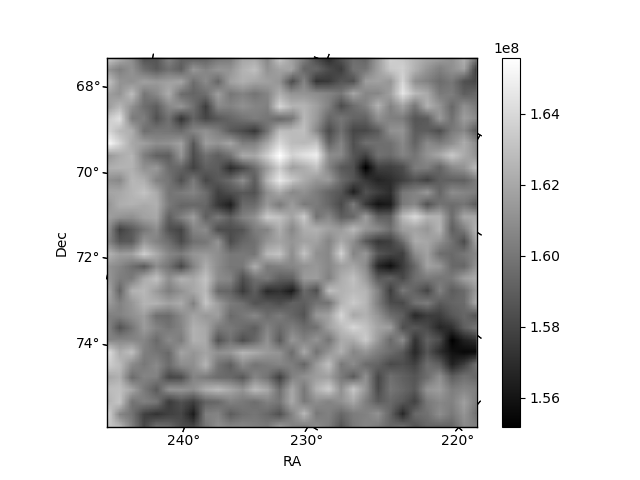
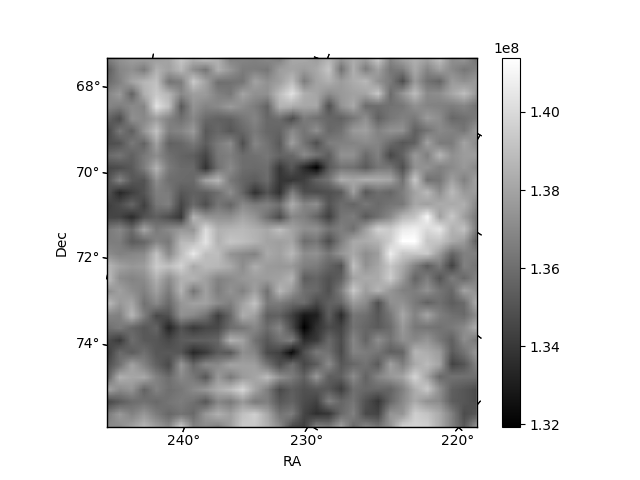
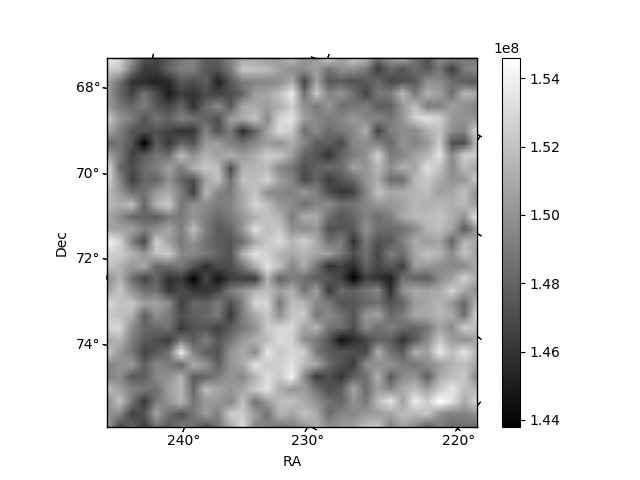
Histogram calculated using DETX and DETY for each event in the final _common_clean file
| Quadrant A | 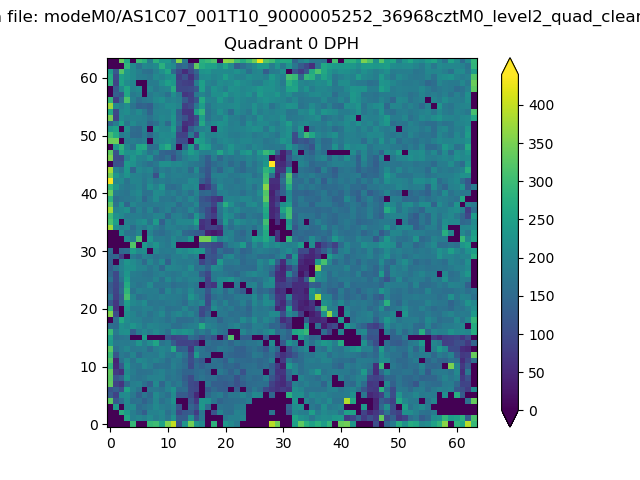 |
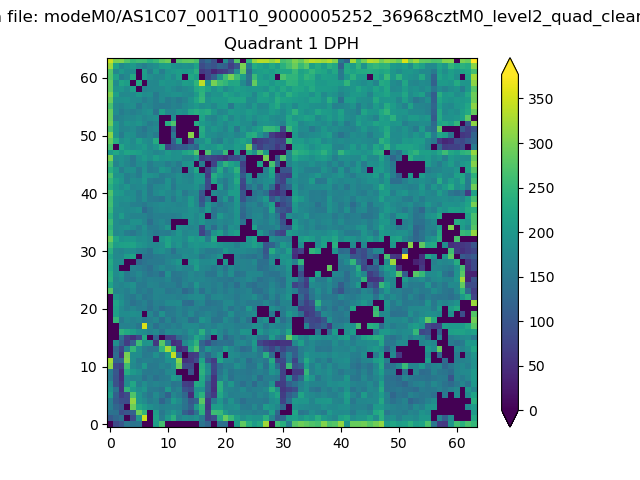 |
Quadrant B |
|---|---|---|---|
| Quadrant D | 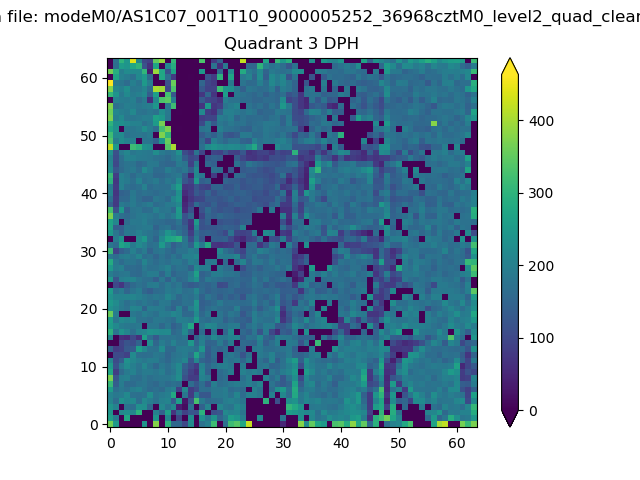 |
 |
Quadrant C |
| Plot type | Count rate plots | Images |
|---|---|---|
| Comparison with Poisson distribution Blue bars denote a histogram of data divided into 1 sec bins. Red curve is a Poisson curve with rate = median count rate of data. |
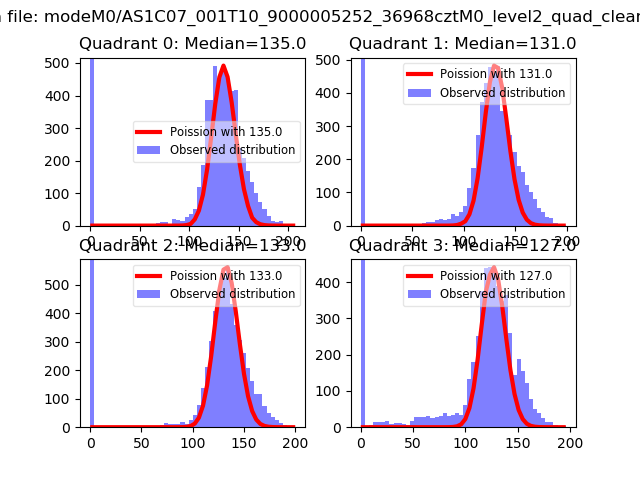 |
 |
| Quadrant-wise count rates Data is divided into 100 sec bins |
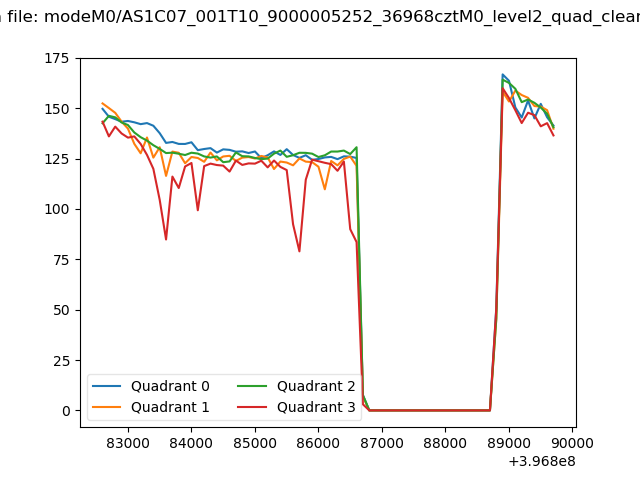 |
|
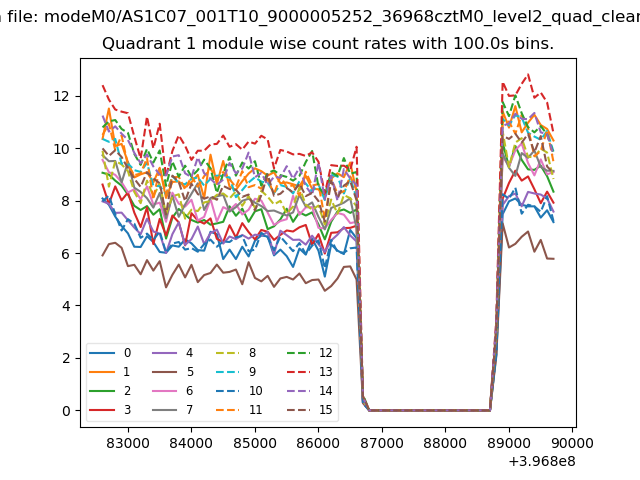
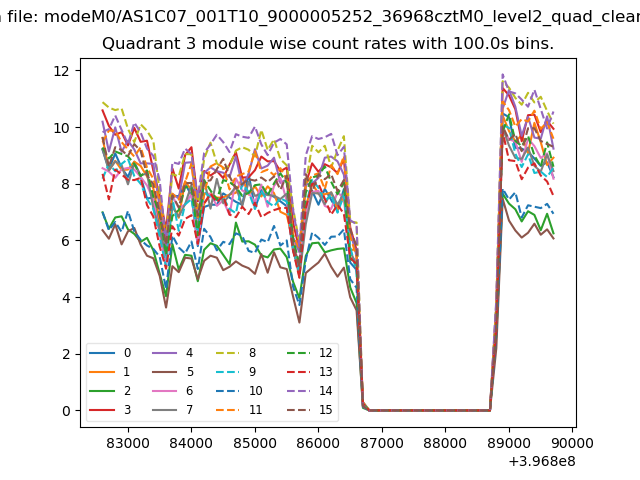
| Module-wise count rates for Quadrant A Data is divided into 100 sec bins |
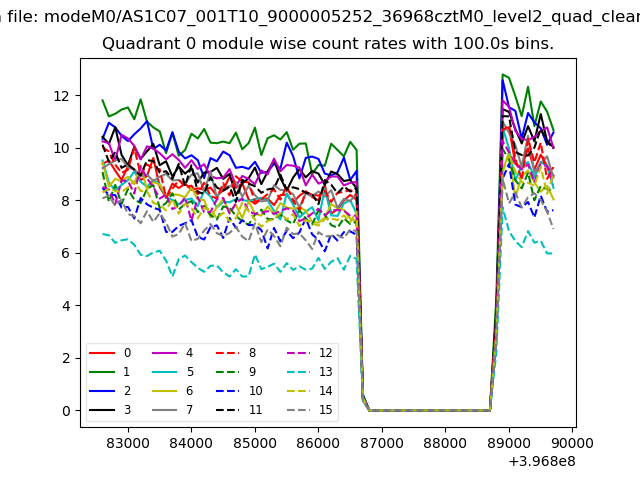 |
 |
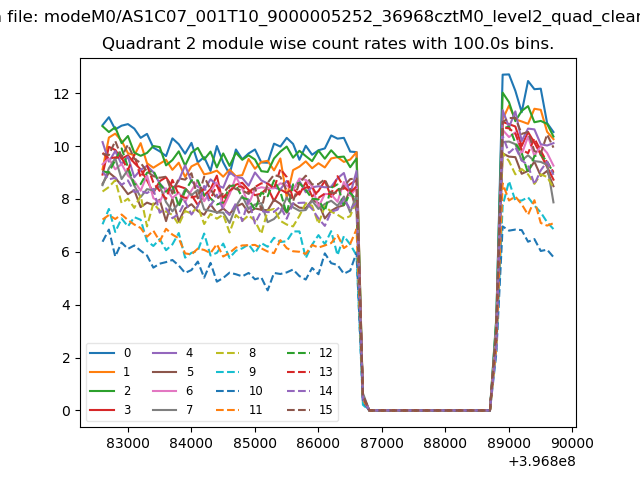
| Module-wise count rates for Quadrant B Data is divided into 100 sec bins |
 |
 |
| Module-wise count rates for Quadrant C Data is divided into 100 sec bins |
 |
 |
| Module-wise count rates for Quadrant D Data is divided into 100 sec bins |
 |
 |
| Parameter | Plot |
|---|---|
| CZT HV Monitor | 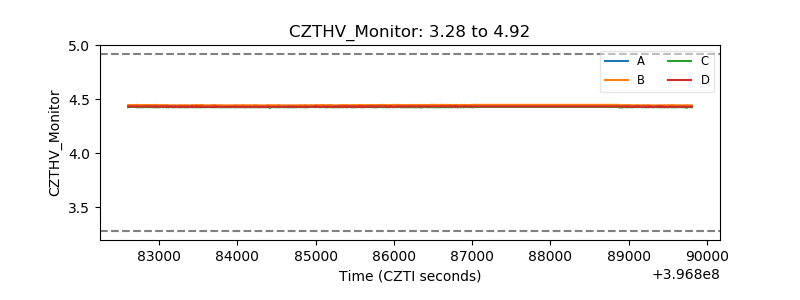 |
| D_VDD | 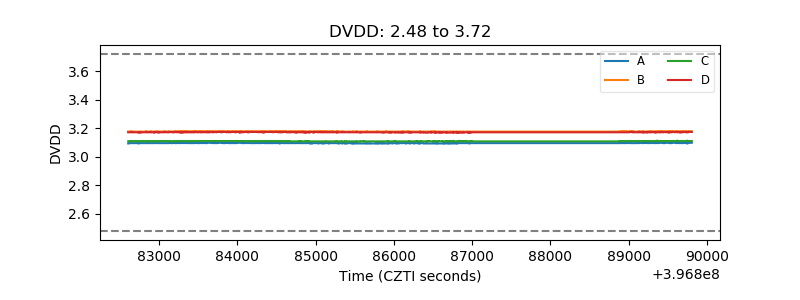 |
| Temperature 1 | 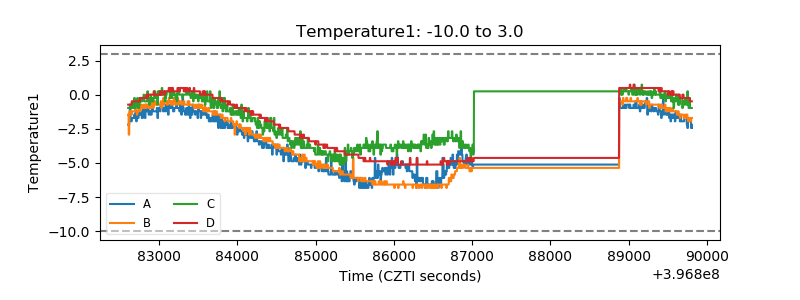 |
| Veto HV Monitor | 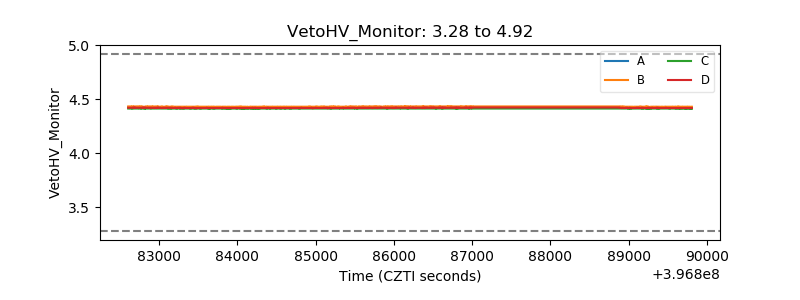 |
| Veto LLD | 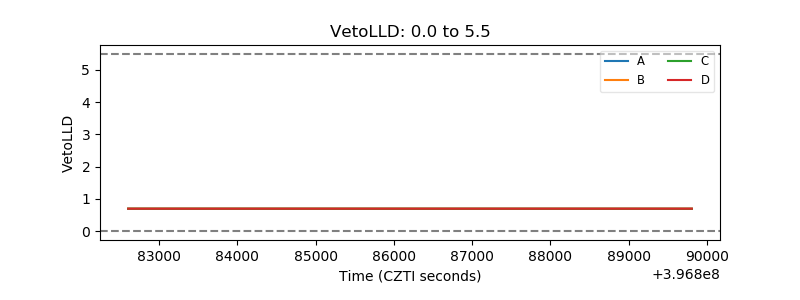 |
| Alpha Counter | 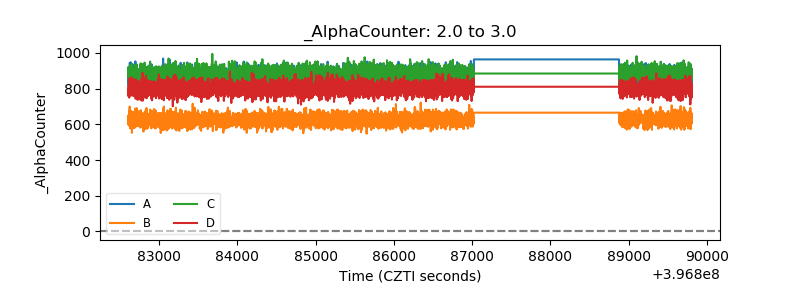 |
| _CPM_Rate | 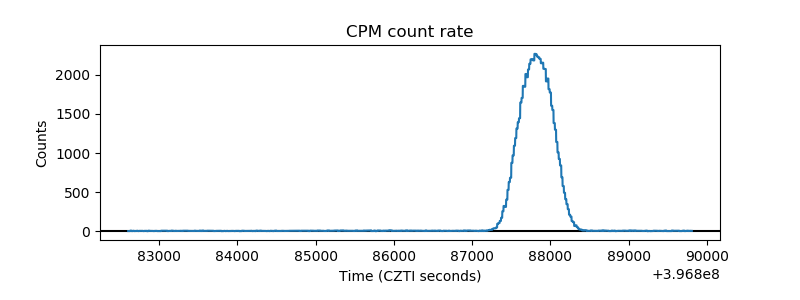 |
| CZT Counter | 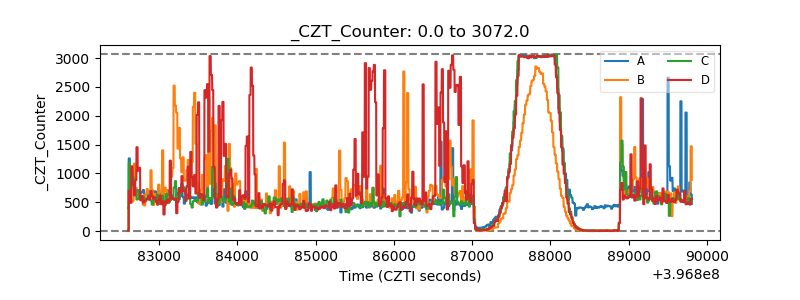 |
| +2.5 Volts monitor | 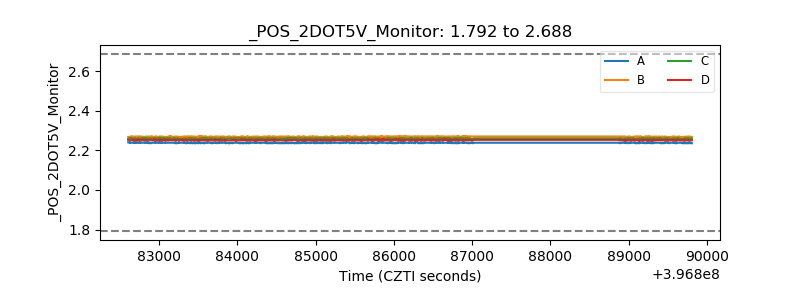 |
| +5 Volts monitor | 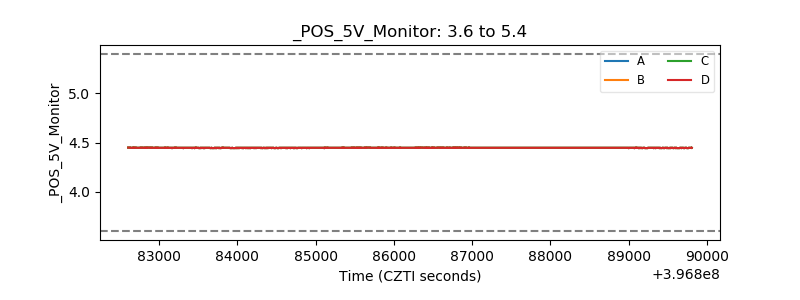 |
| _ROLL_ROT | 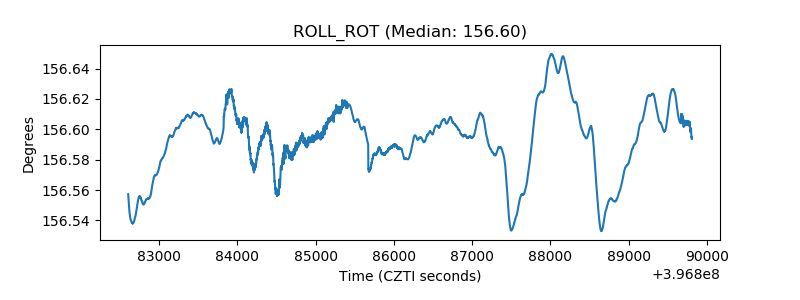 |
| _Roll_DEC | 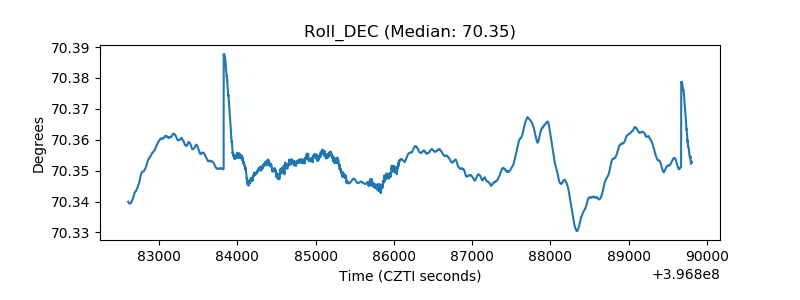 |
| _Roll_RA | 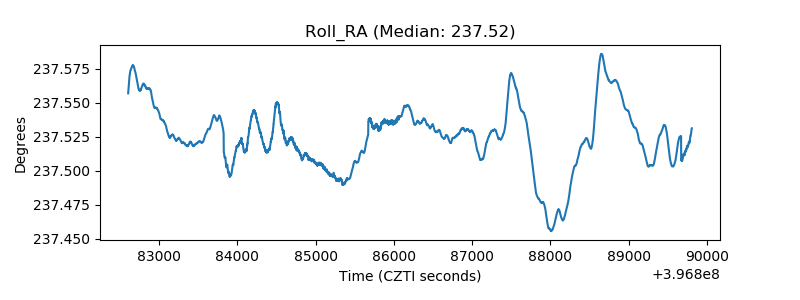 |
| Veto Counter | 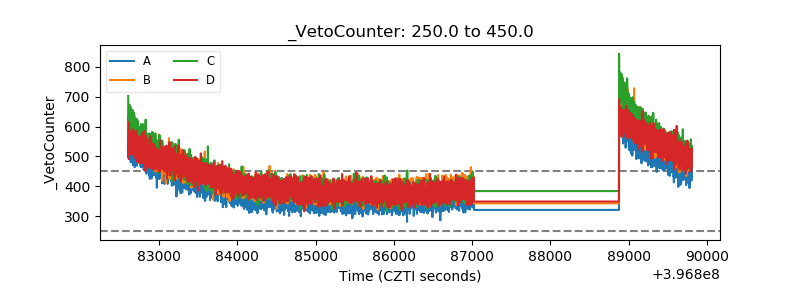 |