| Param | Original file | Final file |
|---|---|---|
| Filename | modeM0/AS1C07_001T10_9000005252_36970cztM0_level2.evt | modeM0/AS1C07_001T10_9000005252_36970cztM0_level2_quad_clean.evt |
| Size (bytes) | 838,739,520 | 155,537,280 |
| Size | 799.9 MB | 148.3 MB |
| Events in quadrant A | 4,957,018 | 1,057,016 |
| Events in quadrant B | 7,686,535 | 978,981 |
| Events in quadrant C | 5,091,004 | 1,064,641 |
| Events in quadrant D | 7,065,931 | 992,269 |
| Mode M0 | |||
|---|---|---|---|
| Quadrant | BADHDUFLAG | Total packets | Discarded packets |
| A | 0 | 20502 | 3 |
| B | 0 | 28777 | 2 |
| C | 0 | 20428 | 2 |
| D | 0 | 26862 | 2 |
| Mode SS | |||
|---|---|---|---|
| Quadrant | BADHDUFLAG | Total packets | Discarded packets |
| A | 0 | 182 | 0 |
| B | 0 | 182 | 0 |
| C | 0 | 182 | 0 |
| D | 0 | 182 | 0 |
| Mode M9 | |||
|---|---|---|---|
| Quadrant | BADHDUFLAG | Total packets | Discarded packets |
| A | 0 | 40 | 0 |
| B | 0 | 40 | 0 |
| C | 0 | 40 | 0 |
| D | 0 | 40 | 0 |
| Quadrant | Total seconds | Saturated seconds | Saturation percentage |
|---|---|---|---|
| A | 8895 | 120 | 1.349073% |
| B | 8895 | 920 | 10.342889% |
| C | 8895 | 116 | 1.304103% |
| D | 8895 | 786 | 8.836425% |
Noise dominated data is calculated using 1-second bins in cleaned event files. If a bin has >2000 counts, and if more than 50% of those come from <1% of pixels, then it is considered to be noise-dominated and hence unusable.
| Quadrant | # 1 sec bins | Bins with >0 counts | Bins with >2000 counts | High rate bins dominated by noise | Noise dominated (total time) | Noise dominated (detector-on time) | Marked lightcurve |
|---|---|---|---|---|---|---|---|
| A | 12931 | 8897 | 91 | 91 | 0.70% | 1.02% | 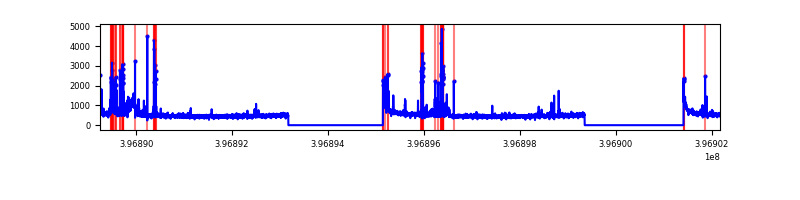 |
| B | 12931 | 8897 | 748 | 748 | 5.78% | 8.41% | 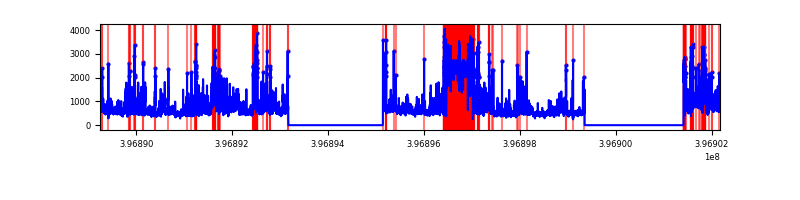 |
| C | 12931 | 8897 | 93 | 93 | 0.72% | 1.05% | 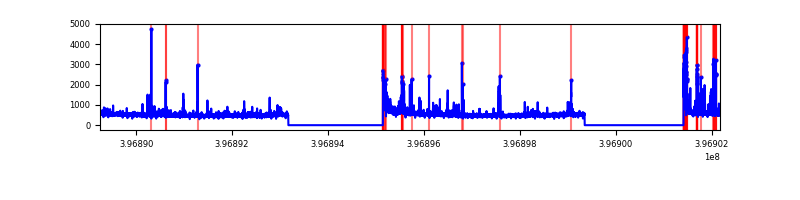 |
| D | 12931 | 8897 | 691 | 691 | 5.34% | 7.77% | 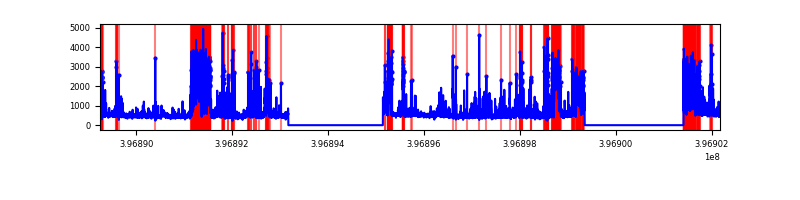 |
Top three noisy pixels from each quadrant. If the there are fewer than three noisy pixels in the level2.evt file, extra rows are filled as -1
| Pixel properties | Quadrant properties | ||||||
|---|---|---|---|---|---|---|---|
| Quadrant | DetID | PixID | Counts | Sigma | Mean | Median | Sigma |
| A | 10 | 83 | 362815 | 1769.66 | 1030 | 1013 | 204.4 |
| A | 13 | 248 | 232773 | 1133.59 | 1030 | 1013 | 204.4 |
| A | 12 | 189 | 189757 | 923.19 | 1030 | 1013 | 204.4 |
| B | 5 | 184 | 2955572 | 16700.47 | 977 | 954 | 176.9 |
| B | 0 | 221 | 187278 | 1053.16 | 977 | 954 | 176.9 |
| B | 0 | 229 | 143836 | 807.62 | 977 | 954 | 176.9 |
| C | 15 | 214 | 382985 | 1631.31 | 1029 | 1040 | 234.1 |
| C | 0 | 10 | 240438 | 1022.48 | 1029 | 1040 | 234.1 |
| C | 14 | 254 | 139967 | 593.36 | 1029 | 1040 | 234.1 |
| D | 12 | 17 | 1866488 | 7086.95 | 983 | 965 | 263.2 |
| D | 13 | 171 | 391379 | 1483.15 | 983 | 965 | 263.2 |
| D | 13 | 200 | 291986 | 1105.56 | 983 | 965 | 263.2 |
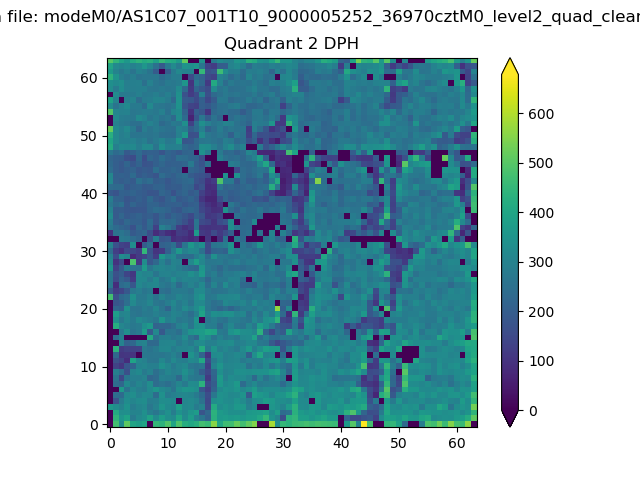
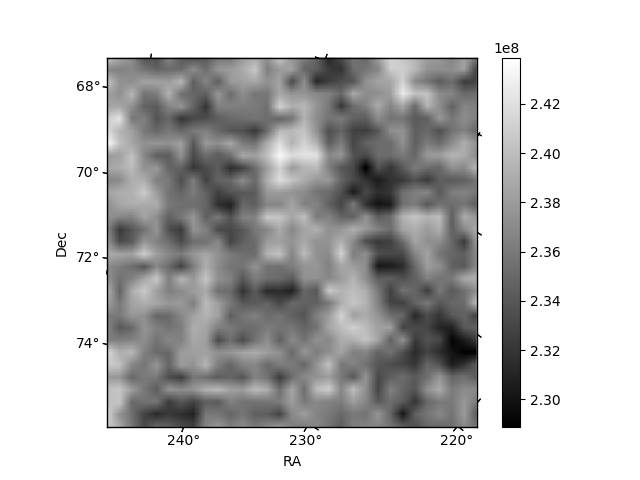
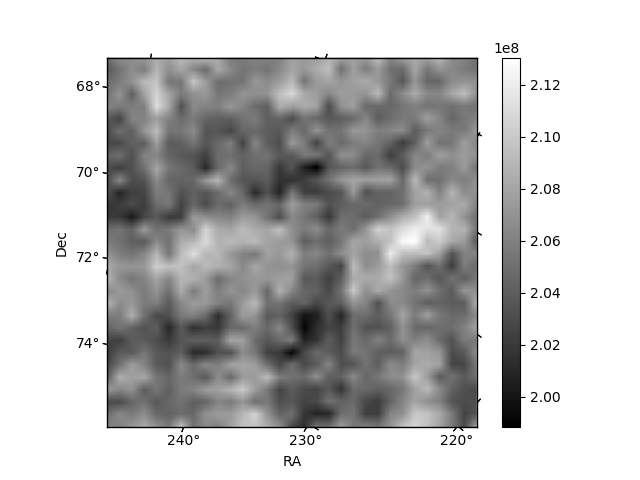
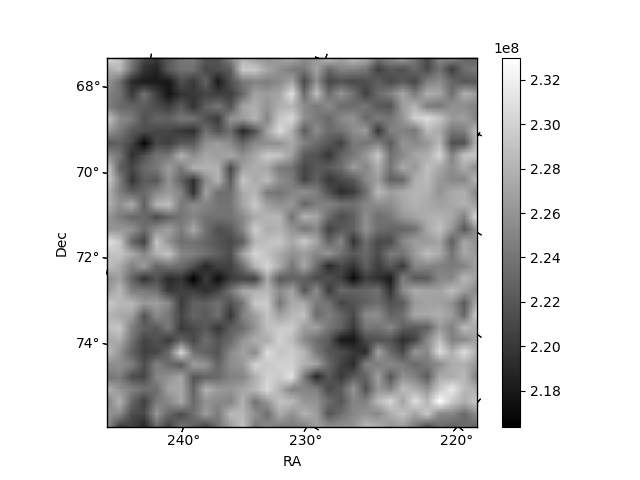
Histogram calculated using DETX and DETY for each event in the final _common_clean file
| Quadrant A |  |
 |
Quadrant B |
|---|---|---|---|
| Quadrant D | 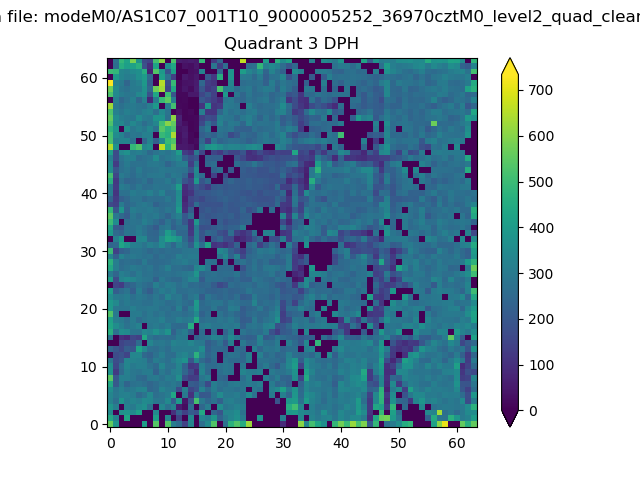 |
 |
Quadrant C |
| Plot type | Count rate plots | Images |
|---|---|---|
| Comparison with Poisson distribution Blue bars denote a histogram of data divided into 1 sec bins. Red curve is a Poisson curve with rate = median count rate of data. |
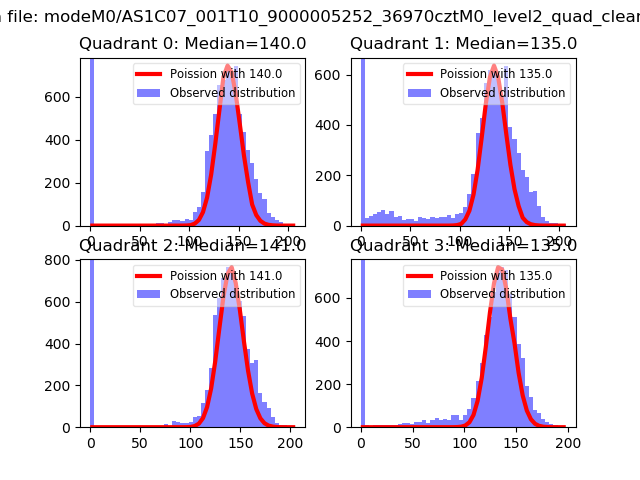 |
 |
| Quadrant-wise count rates Data is divided into 100 sec bins |
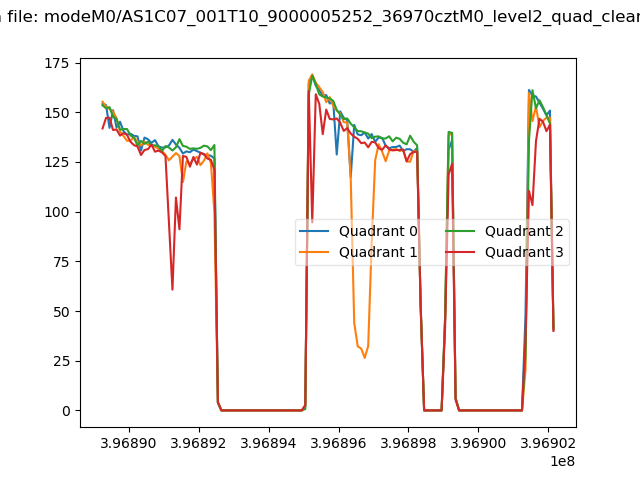 |
|
| Module-wise count rates for Quadrant A Data is divided into 100 sec bins |
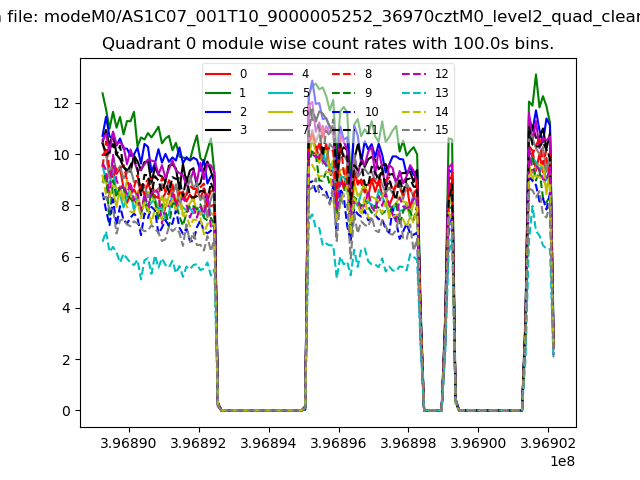 |
 |
| Module-wise count rates for Quadrant B Data is divided into 100 sec bins |
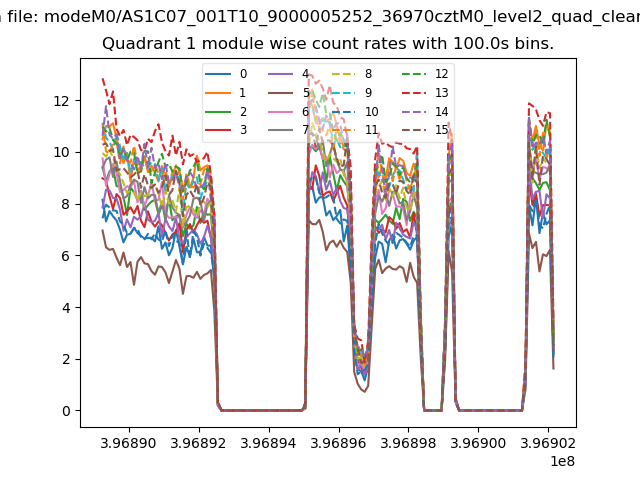 |
 |
| Module-wise count rates for Quadrant C Data is divided into 100 sec bins |
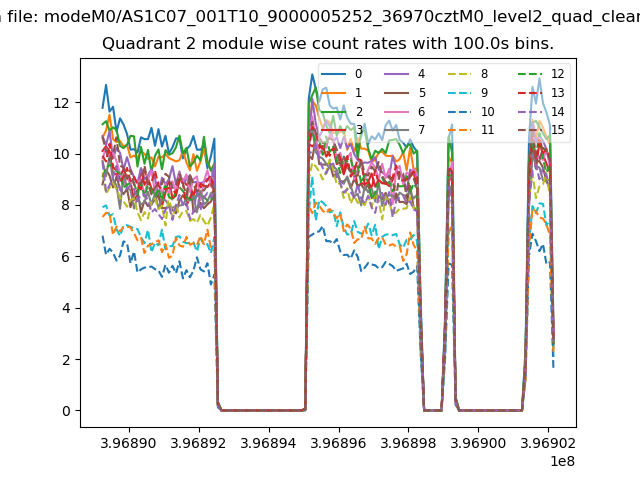 |
 |
| Module-wise count rates for Quadrant D Data is divided into 100 sec bins |
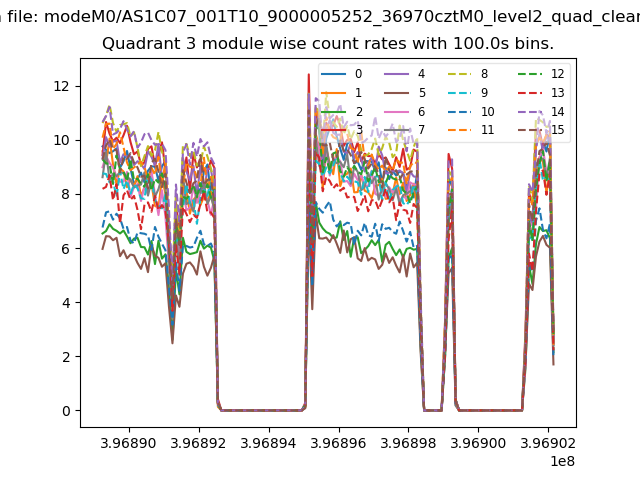 |
 |
| Parameter | Plot |
|---|---|
| CZT HV Monitor | 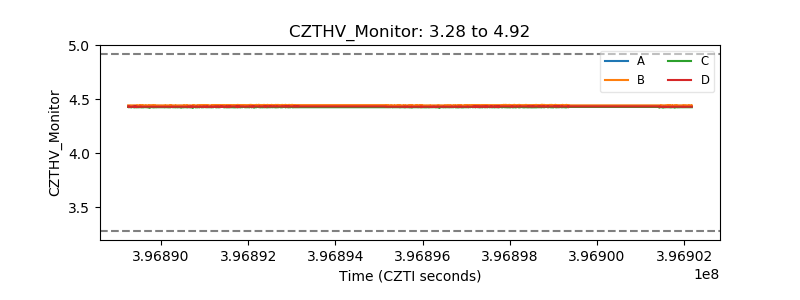 |
| D_VDD | 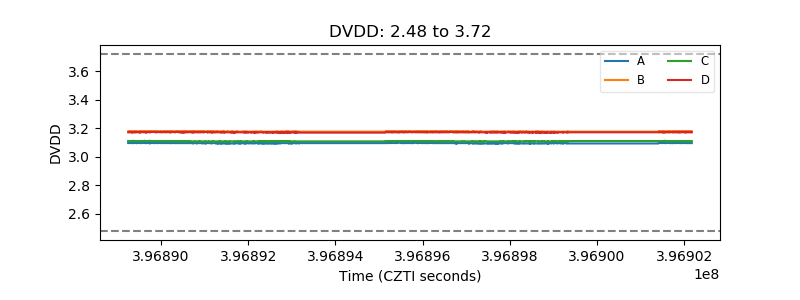 |
| Temperature 1 | 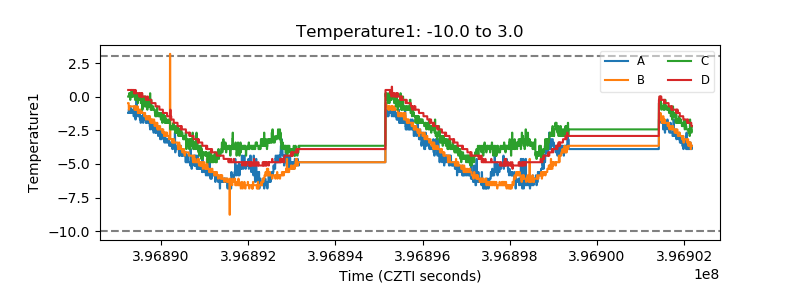 |
| Veto HV Monitor |  |
| Veto LLD | 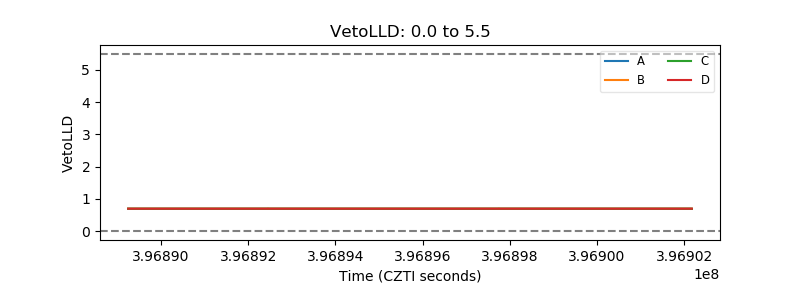 |
| Alpha Counter | 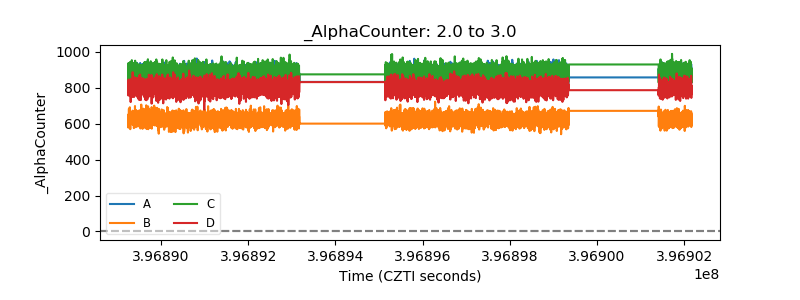 |
| _CPM_Rate | 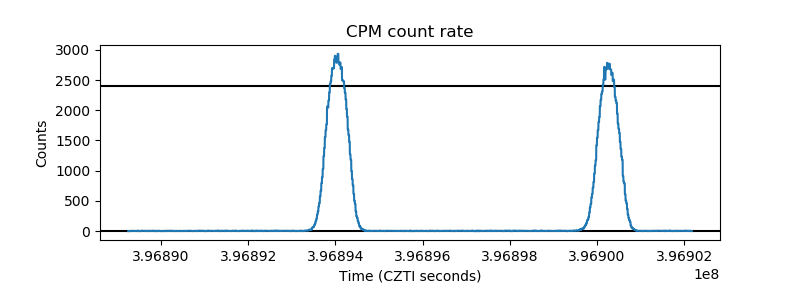 |
| CZT Counter | 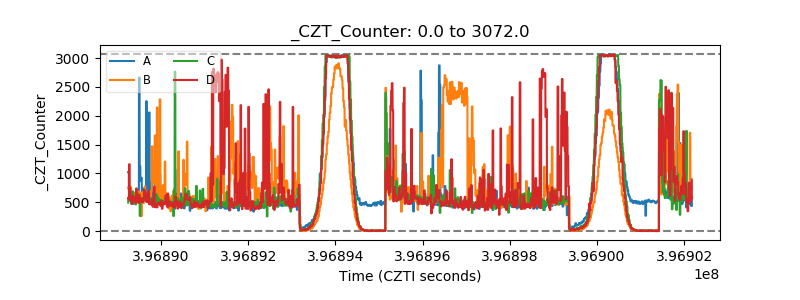 |
| +2.5 Volts monitor | 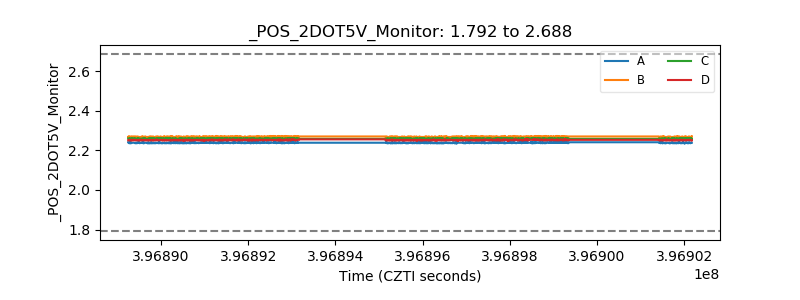 |
| +5 Volts monitor | 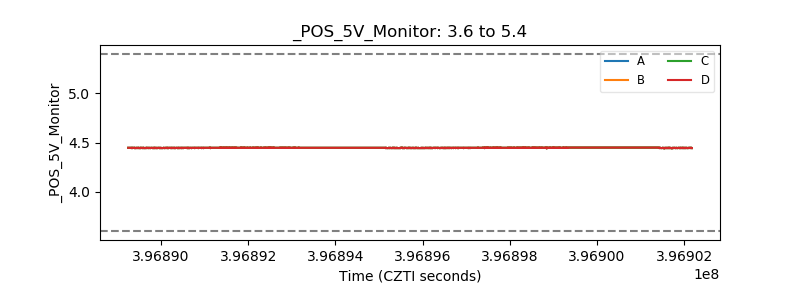 |
| _ROLL_ROT | 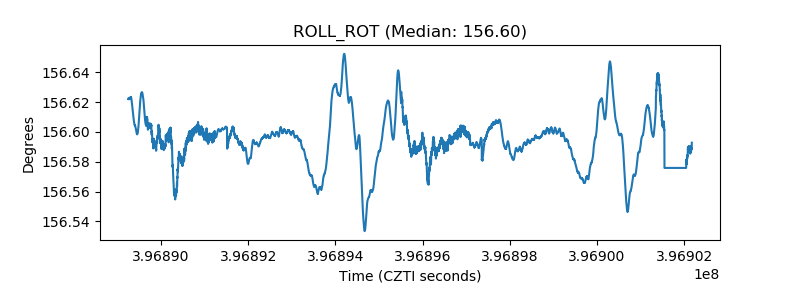 |
| _Roll_DEC | 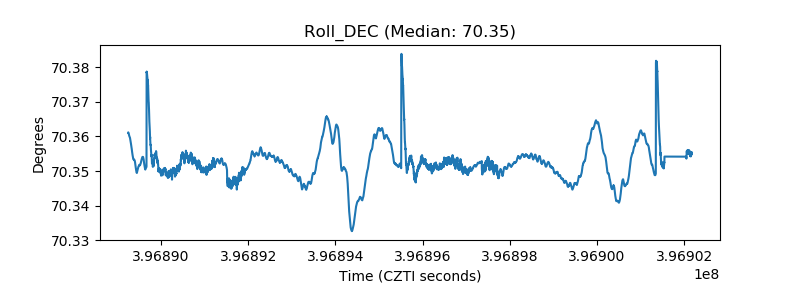 |
| _Roll_RA | 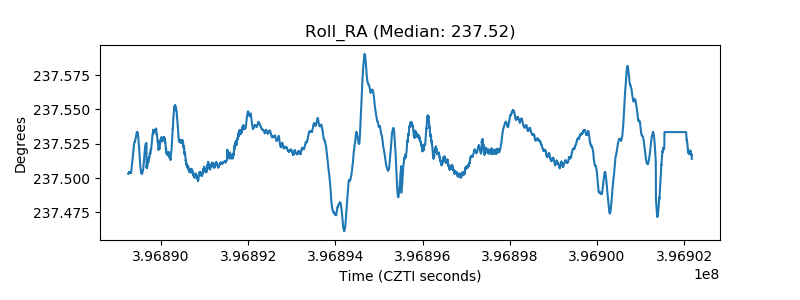 |
| Veto Counter | 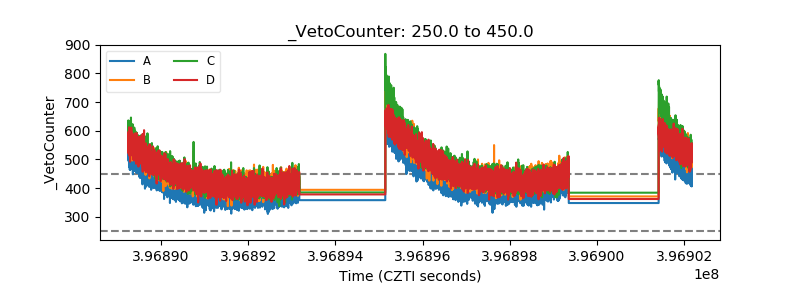 |