| Param | Original file | Final file |
|---|---|---|
| Filename | modeM0/AS1C07_001T10_9000005252_36971cztM0_level2.evt | modeM0/AS1C07_001T10_9000005252_36971cztM0_level2_quad_clean.evt |
| Size (bytes) | 471,237,120 | 83,989,440 |
| Size | 449.4 MB | 80.1 MB |
| Events in quadrant A | 2,485,924 | 570,535 |
| Events in quadrant B | 4,862,248 | 515,771 |
| Events in quadrant C | 2,882,747 | 576,581 |
| Events in quadrant D | 3,712,698 | 541,067 |
| Mode M0 | |||
|---|---|---|---|
| Quadrant | BADHDUFLAG | Total packets | Discarded packets |
| A | 0 | 10481 | 3 |
| B | 0 | 17745 | 2 |
| C | 0 | 11512 | 2 |
| D | 0 | 14285 | 2 |
| Mode SS | |||
|---|---|---|---|
| Quadrant | BADHDUFLAG | Total packets | Discarded packets |
| A | 0 | 100 | 0 |
| B | 0 | 100 | 0 |
| C | 0 | 100 | 0 |
| D | 0 | 100 | 0 |
| Mode M9 | |||
|---|---|---|---|
| Quadrant | BADHDUFLAG | Total packets | Discarded packets |
| A | 0 | 32 | 0 |
| B | 0 | 32 | 0 |
| C | 0 | 32 | 0 |
| D | 0 | 33 | 0 |
| Quadrant | Total seconds | Saturated seconds | Saturation percentage |
|---|---|---|---|
| A | 4829 | 16 | 0.331332% |
| B | 4829 | 737 | 15.261959% |
| C | 4829 | 100 | 2.070822% |
| D | 4829 | 312 | 6.460965% |
Noise dominated data is calculated using 1-second bins in cleaned event files. If a bin has >2000 counts, and if more than 50% of those come from <1% of pixels, then it is considered to be noise-dominated and hence unusable.
| Quadrant | # 1 sec bins | Bins with >0 counts | Bins with >2000 counts | High rate bins dominated by noise | Noise dominated (total time) | Noise dominated (detector-on time) | Marked lightcurve |
|---|---|---|---|---|---|---|---|
| A | 6952 | 4830 | 12 | 12 | 0.17% | 0.25% | 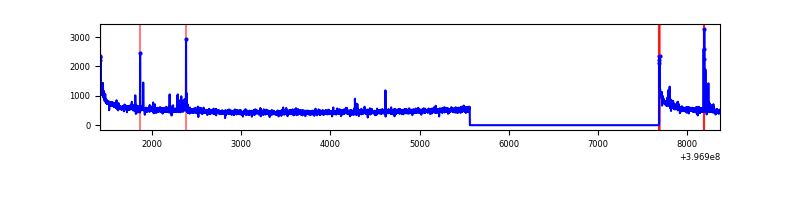 |
| B | 6952 | 4830 | 610 | 610 | 8.77% | 12.63% | 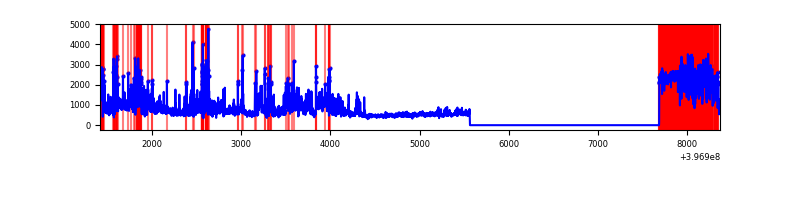 |
| C | 6952 | 4830 | 82 | 82 | 1.18% | 1.70% | 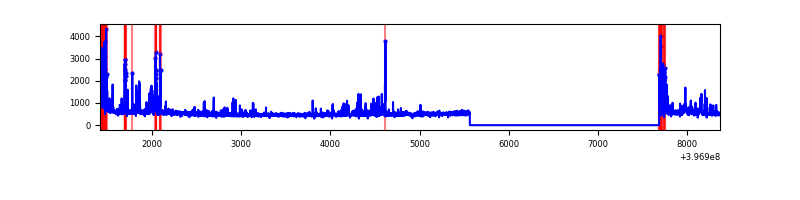 |
| D | 6952 | 4830 | 260 | 260 | 3.74% | 5.38% | 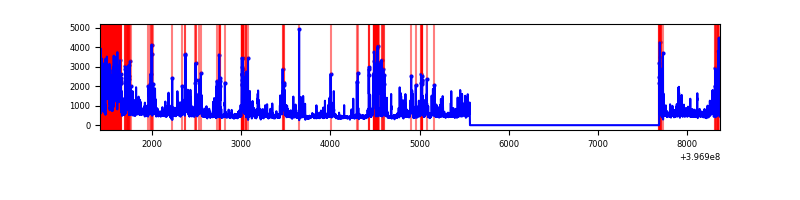 |
Top three noisy pixels from each quadrant. If the there are fewer than three noisy pixels in the level2.evt file, extra rows are filled as -1
| Pixel properties | Quadrant properties | ||||||
|---|---|---|---|---|---|---|---|
| Quadrant | DetID | PixID | Counts | Sigma | Mean | Median | Sigma |
| A | 10 | 83 | 243834 | 2186.48 | 555 | 545 | 111.3 |
| A | 13 | 248 | 41379 | 366.98 | 555 | 545 | 111.3 |
| A | 13 | 6 | 24571 | 215.93 | 555 | 545 | 111.3 |
| B | 5 | 184 | 2153958 | 22230.23 | 521 | 509 | 96.9 |
| B | 0 | 221 | 121317 | 1247.11 | 521 | 509 | 96.9 |
| B | 5 | 32 | 103603 | 1064.25 | 521 | 509 | 96.9 |
| C | 0 | 10 | 296398 | 2305.52 | 556 | 561 | 128.3 |
| C | 15 | 214 | 206644 | 1606.05 | 556 | 561 | 128.3 |
| C | 14 | 254 | 96175 | 745.14 | 556 | 561 | 128.3 |
| D | 13 | 171 | 462981 | 3220.88 | 535 | 523 | 143.6 |
| D | 12 | 17 | 338846 | 2356.32 | 535 | 523 | 143.6 |
| D | 2 | 250 | 315019 | 2190.37 | 535 | 523 | 143.6 |
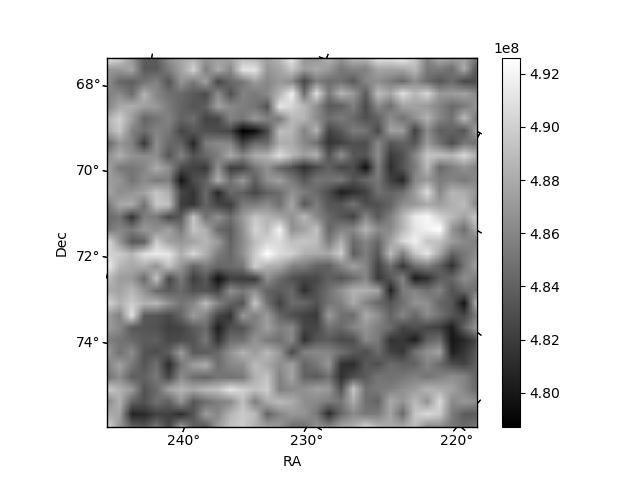
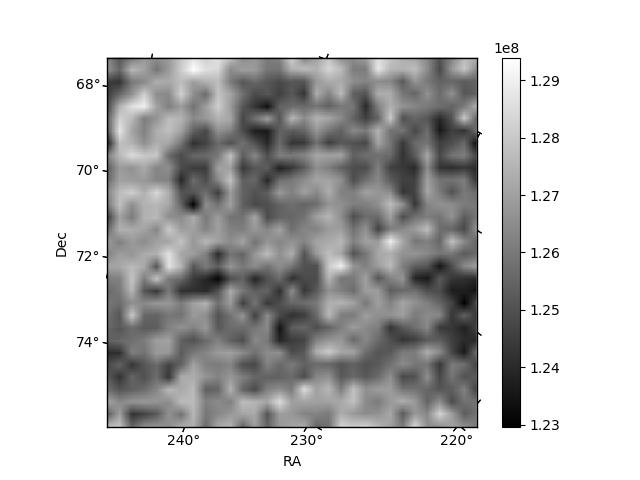
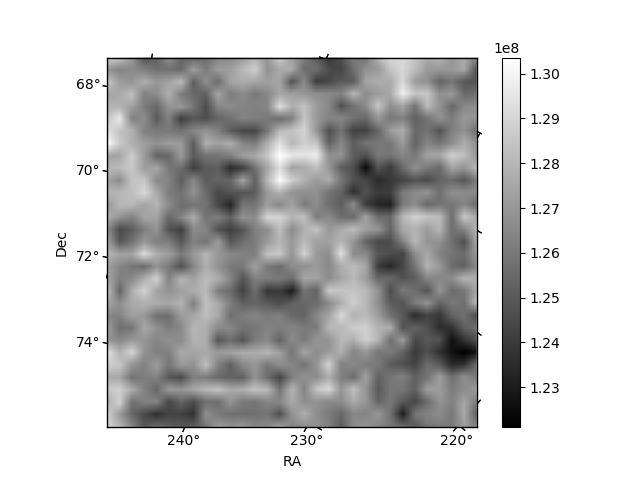
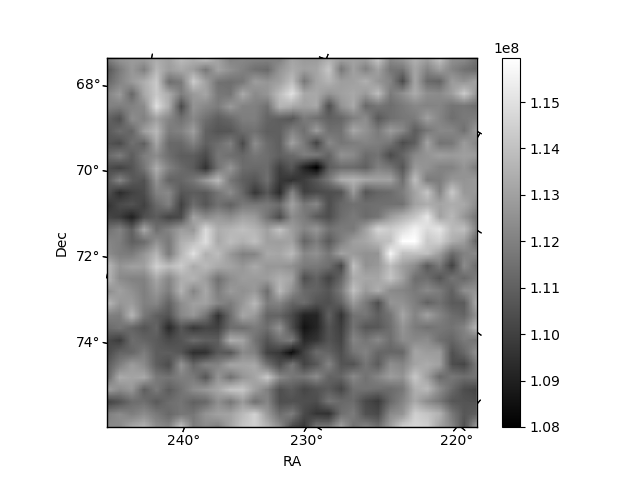
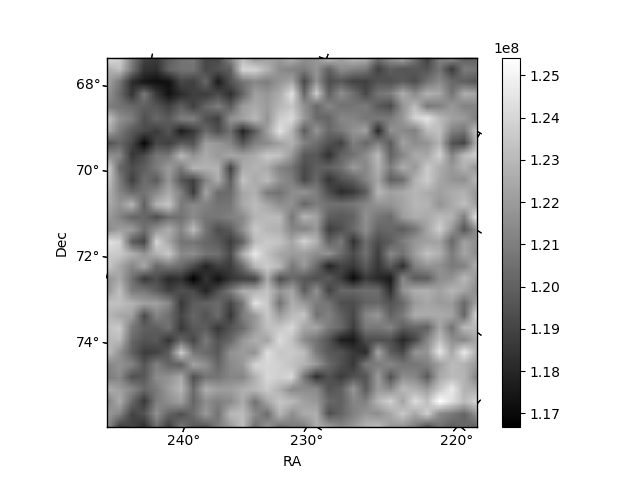
Histogram calculated using DETX and DETY for each event in the final _common_clean file
| Quadrant A | 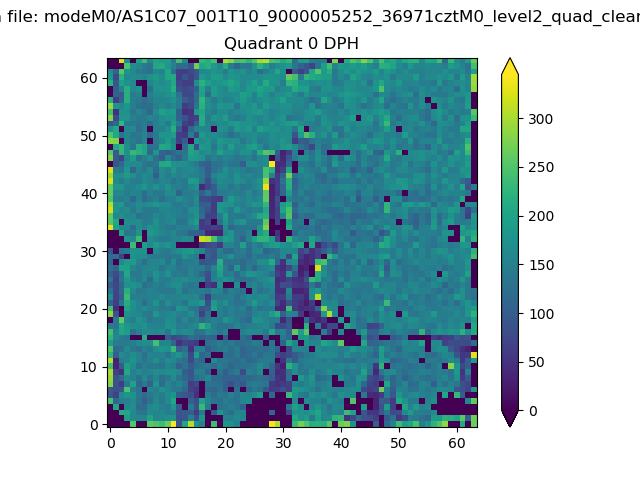 |
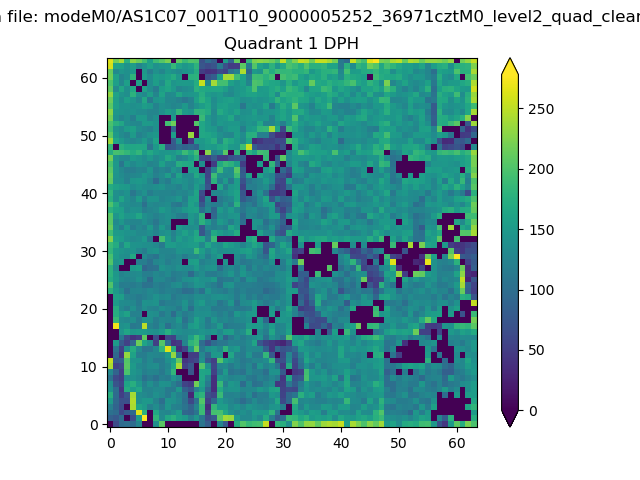 |
Quadrant B |
|---|---|---|---|
| Quadrant D | 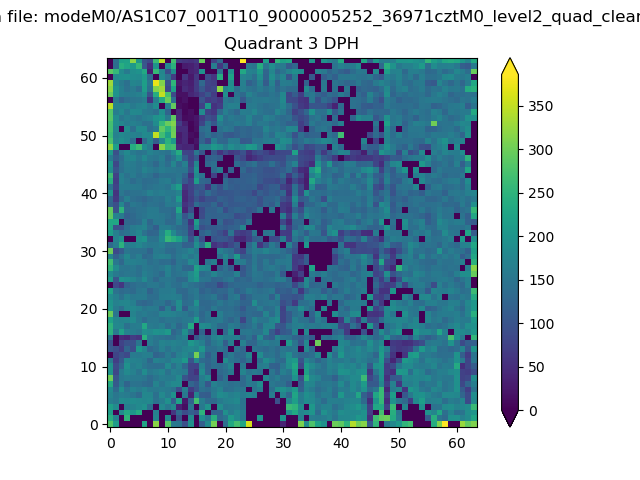 |
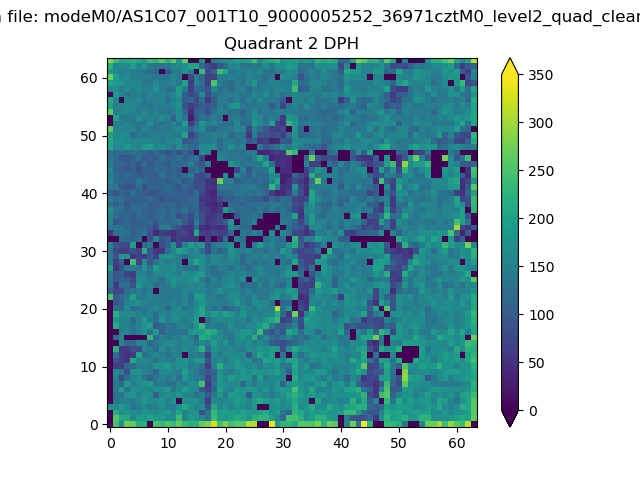 |
Quadrant C |
| Plot type | Count rate plots | Images |
|---|---|---|
| Comparison with Poisson distribution Blue bars denote a histogram of data divided into 1 sec bins. Red curve is a Poisson curve with rate = median count rate of data. |
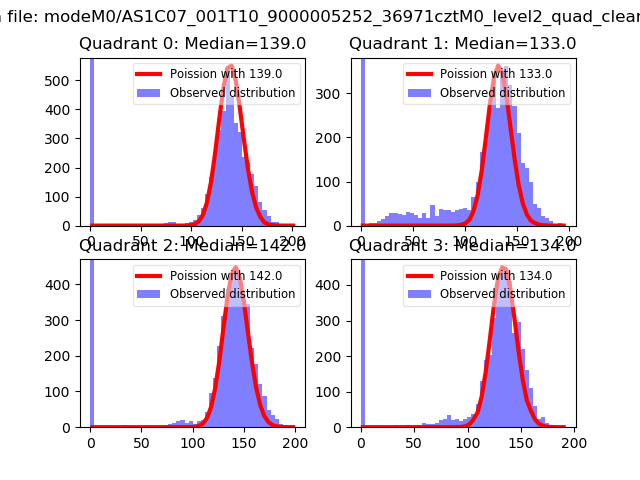 |
 |
| Quadrant-wise count rates Data is divided into 100 sec bins |
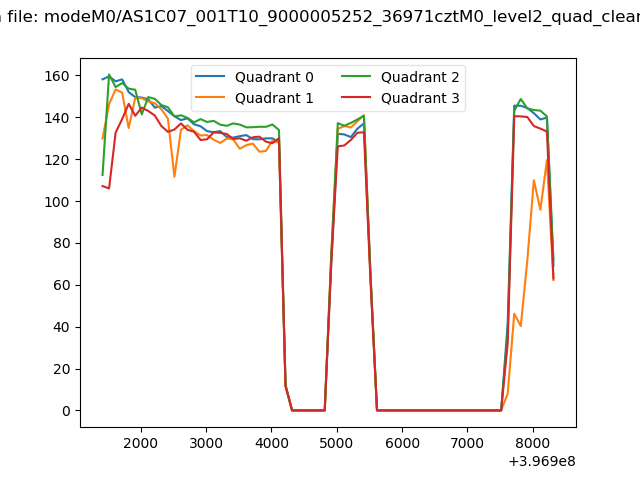 |
|
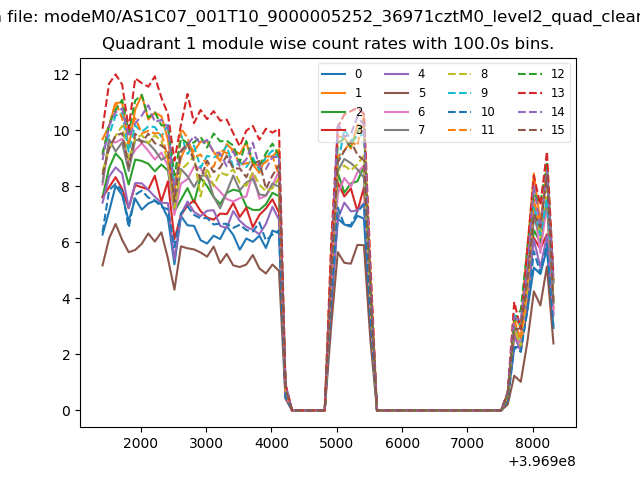
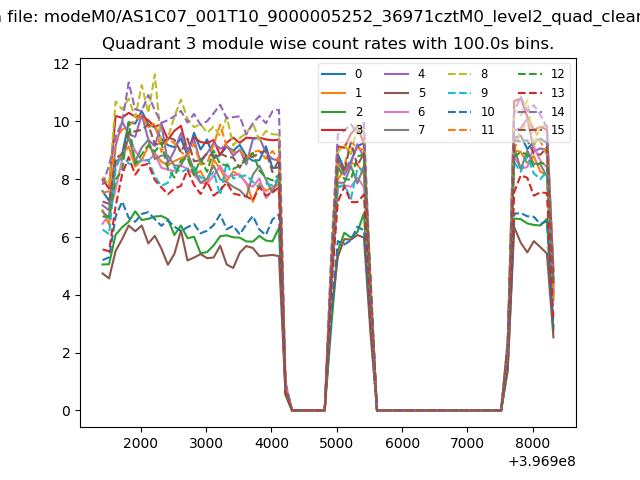
| Module-wise count rates for Quadrant A Data is divided into 100 sec bins |
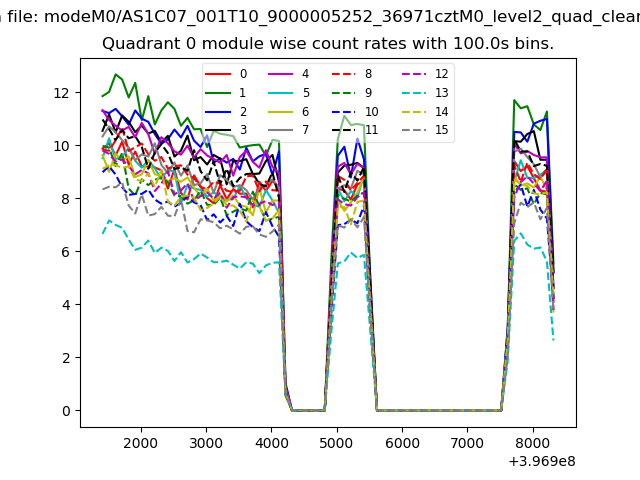 |
 |
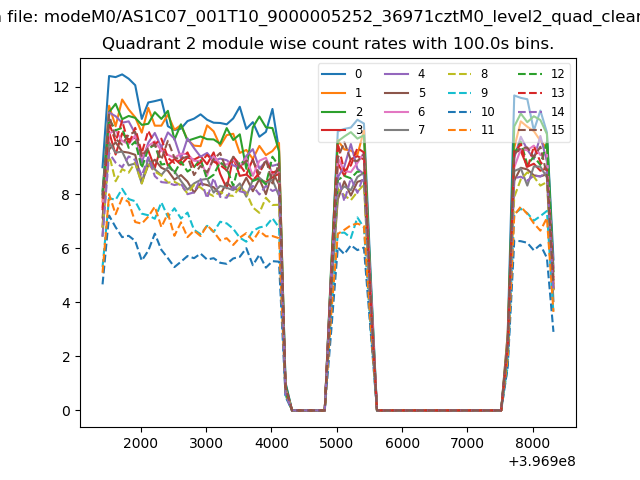
| Module-wise count rates for Quadrant B Data is divided into 100 sec bins |
 |
 |
| Module-wise count rates for Quadrant C Data is divided into 100 sec bins |
 |
 |
| Module-wise count rates for Quadrant D Data is divided into 100 sec bins |
 |
 |
| Parameter | Plot |
|---|---|
| CZT HV Monitor | 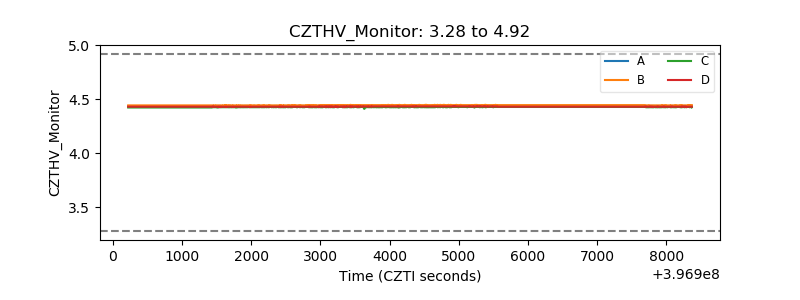 |
| D_VDD | 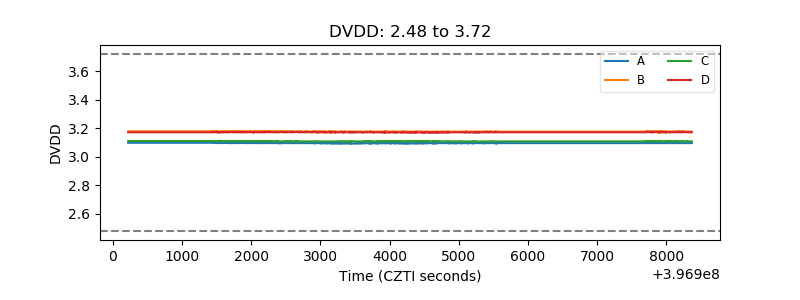 |
| Temperature 1 | 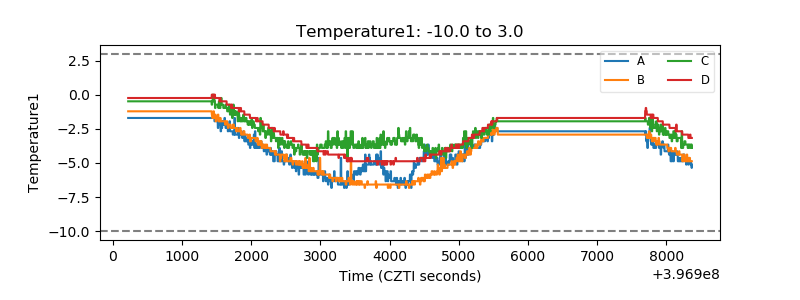 |
| Veto HV Monitor | 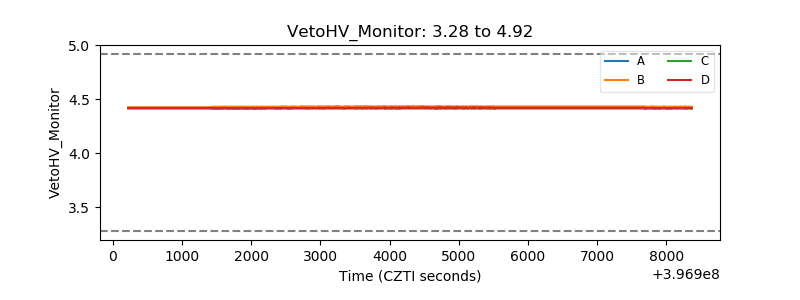 |
| Veto LLD | 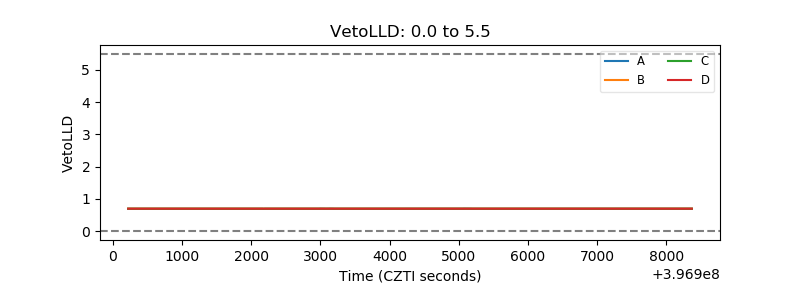 |
| Alpha Counter | 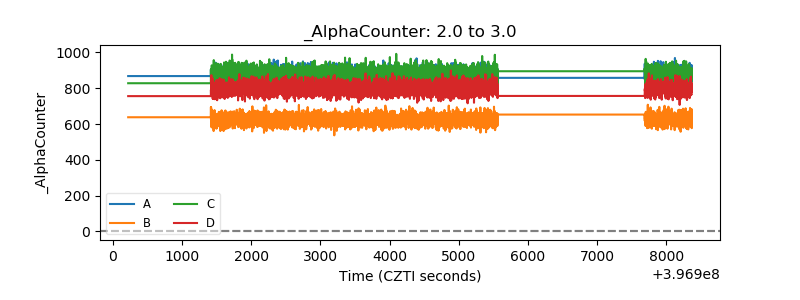 |
| _CPM_Rate | 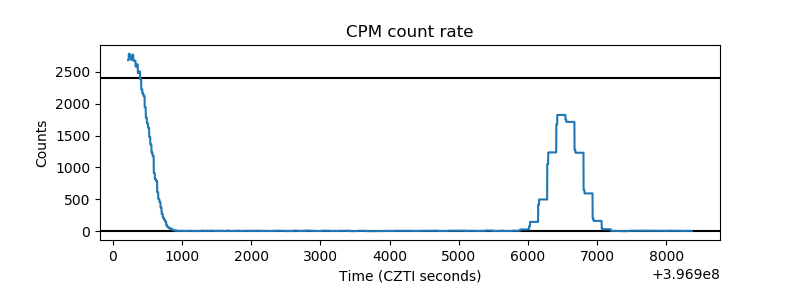 |
| CZT Counter | 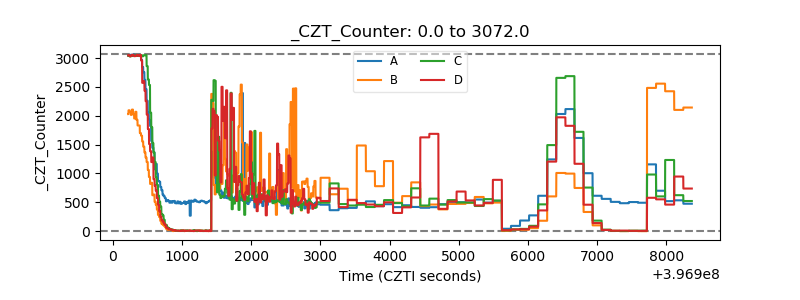 |
| +2.5 Volts monitor | 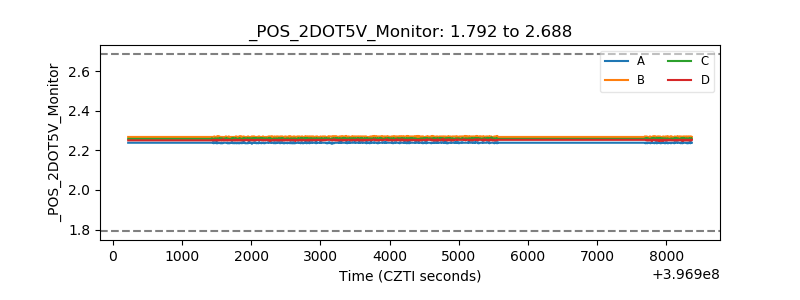 |
| +5 Volts monitor | 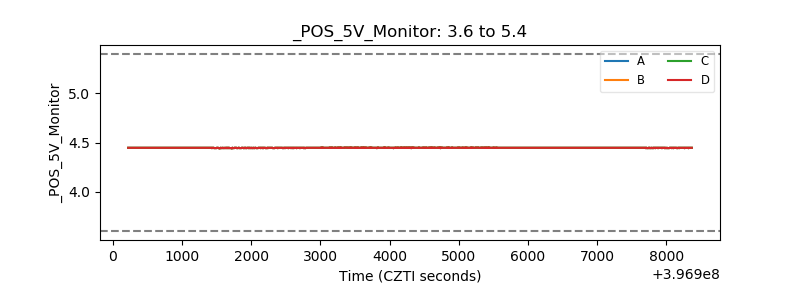 |
| _ROLL_ROT | 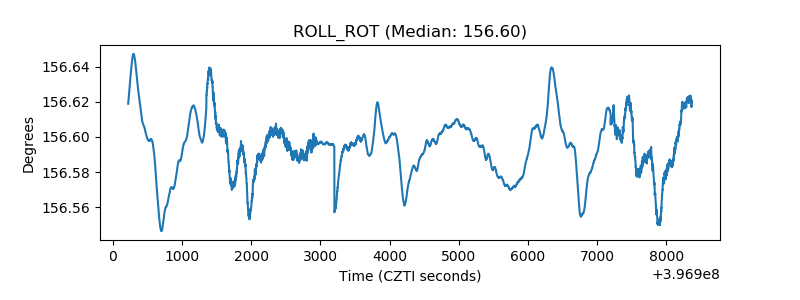 |
| _Roll_DEC | 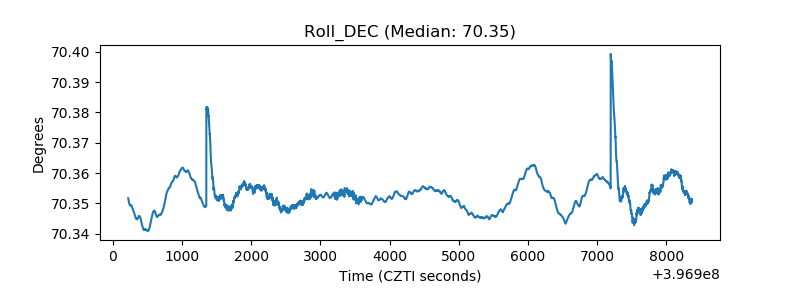 |
| _Roll_RA | 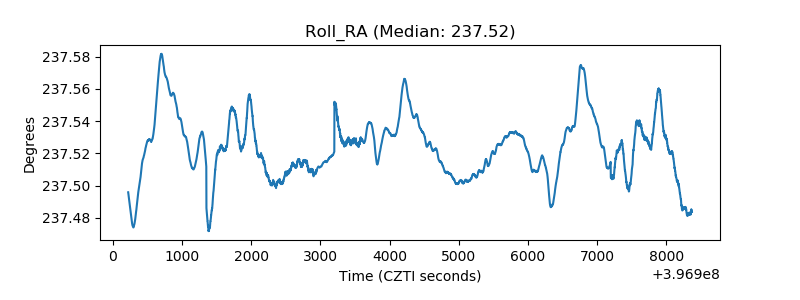 |
| Veto Counter | 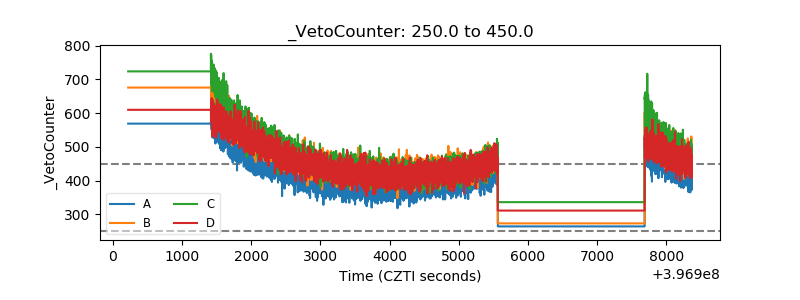 |