| Param | Original file | Final file |
|---|---|---|
| Filename | modeM0/AS1C07_001T10_9000005252_36973cztM0_level2.evt | modeM0/AS1C07_001T10_9000005252_36973cztM0_level2_quad_clean.evt |
| Size (bytes) | 407,208,960 | 65,145,600 |
| Size | 388.3 MB | 62.1 MB |
| Events in quadrant A | 1,975,622 | 435,393 |
| Events in quadrant B | 4,519,329 | 397,524 |
| Events in quadrant C | 2,196,671 | 440,840 |
| Events in quadrant D | 3,352,206 | 399,616 |
| Mode M0 | |||
|---|---|---|---|
| Quadrant | BADHDUFLAG | Total packets | Discarded packets |
| A | 0 | 8774 | 1 |
| B | 0 | 16291 | 1 |
| C | 0 | 9261 | 1 |
| D | 0 | 12950 | 1 |
| Mode SS | |||
|---|---|---|---|
| Quadrant | BADHDUFLAG | Total packets | Discarded packets |
| A | 0 | 84 | 0 |
| B | 0 | 84 | 0 |
| C | 0 | 84 | 0 |
| D | 0 | 84 | 0 |
| Mode M9 | |||
|---|---|---|---|
| Quadrant | BADHDUFLAG | Total packets | Discarded packets |
| A | 0 | 12 | 0 |
| B | 0 | 12 | 0 |
| C | 0 | 12 | 0 |
| D | 0 | 13 | 0 |
| Quadrant | Total seconds | Saturated seconds | Saturation percentage |
|---|---|---|---|
| A | 4246 | 11 | 0.259067% |
| B | 4246 | 701 | 16.509656% |
| C | 4246 | 29 | 0.682996% |
| D | 4246 | 422 | 9.938766% |
Noise dominated data is calculated using 1-second bins in cleaned event files. If a bin has >2000 counts, and if more than 50% of those come from <1% of pixels, then it is considered to be noise-dominated and hence unusable.
| Quadrant | # 1 sec bins | Bins with >0 counts | Bins with >2000 counts | High rate bins dominated by noise | Noise dominated (total time) | Noise dominated (detector-on time) | Marked lightcurve |
|---|---|---|---|---|---|---|---|
| A | 4246 | 4246 | 8 | 8 | 0.19% | 0.19% | 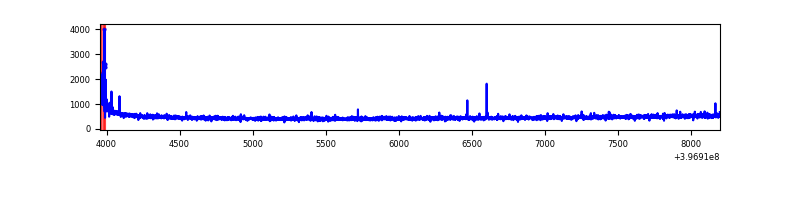 |
| B | 4246 | 4246 | 547 | 547 | 12.88% | 12.88% | 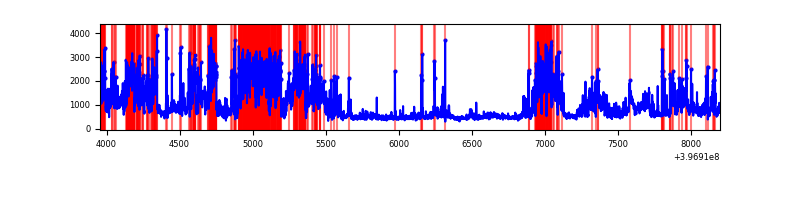 |
| C | 4246 | 4246 | 22 | 22 | 0.52% | 0.52% | 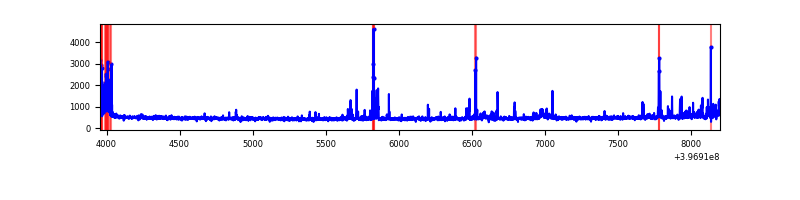 |
| D | 4246 | 4246 | 408 | 408 | 9.61% | 9.61% | 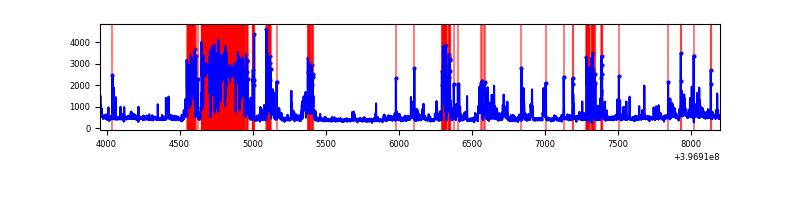 |
Top three noisy pixels from each quadrant. If the there are fewer than three noisy pixels in the level2.evt file, extra rows are filled as -1
| Pixel properties | Quadrant properties | ||||||
|---|---|---|---|---|---|---|---|
| Quadrant | DetID | PixID | Counts | Sigma | Mean | Median | Sigma |
| A | 10 | 83 | 151760 | 1628.1 | 460 | 452 | 92.9 |
| A | 13 | 248 | 21372 | 225.1 | 460 | 452 | 92.9 |
| A | 13 | 6 | 10560 | 108.76 | 460 | 452 | 92.9 |
| B | 5 | 184 | 2195050 | 26461.28 | 435 | 424 | 82.9 |
| B | 5 | 200 | 148641 | 1787.1 | 435 | 424 | 82.9 |
| B | 0 | 229 | 101900 | 1223.53 | 435 | 424 | 82.9 |
| C | 15 | 214 | 179785 | 1707.32 | 453 | 456 | 105.0 |
| C | 14 | 254 | 119327 | 1131.72 | 453 | 456 | 105.0 |
| C | 0 | 10 | 83149 | 787.29 | 453 | 456 | 105.0 |
| D | 12 | 17 | 1263225 | 11525.27 | 430 | 419 | 109.6 |
| D | 4 | 239 | 157520 | 1433.82 | 430 | 419 | 109.6 |
| D | 2 | 153 | 66687 | 604.81 | 430 | 419 | 109.6 |
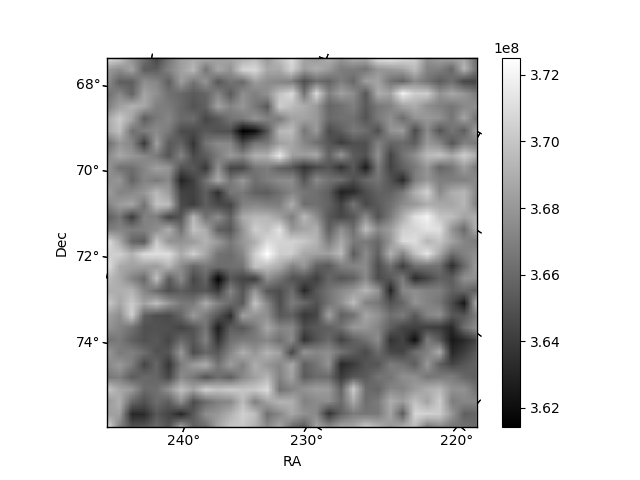
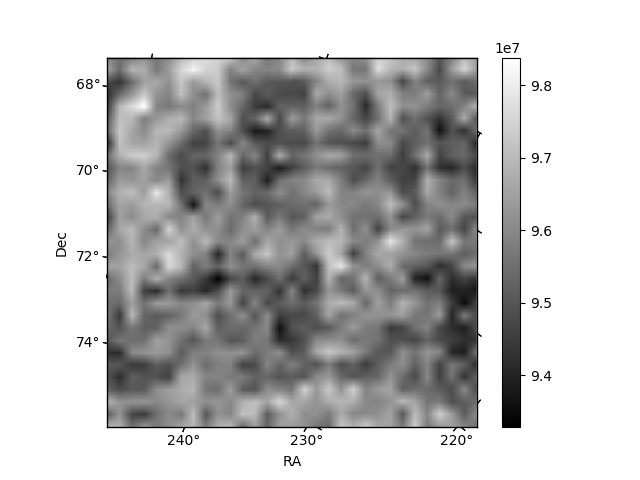
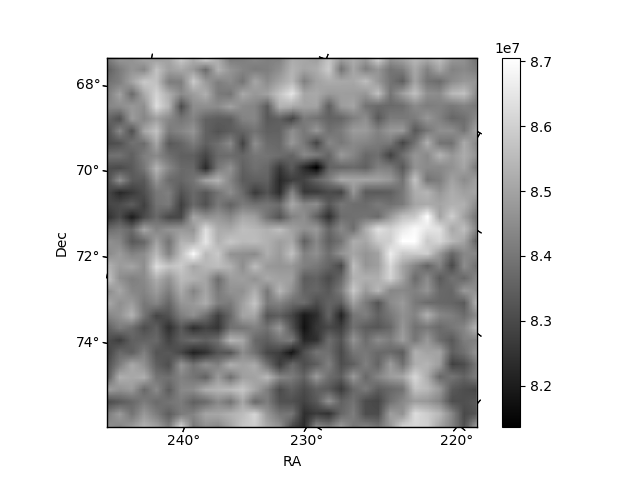
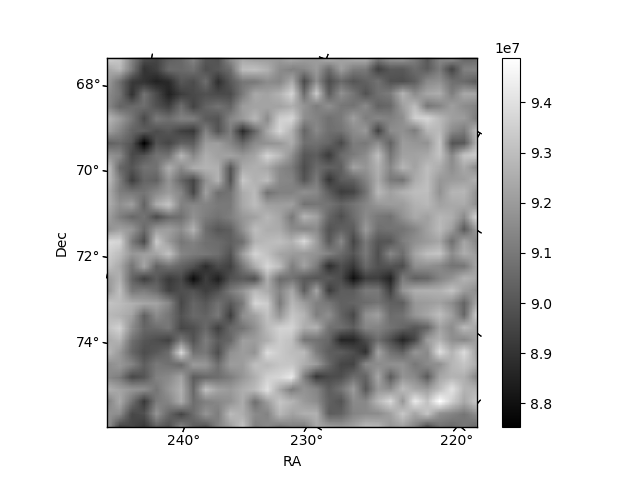
Histogram calculated using DETX and DETY for each event in the final _common_clean file
| Quadrant A | 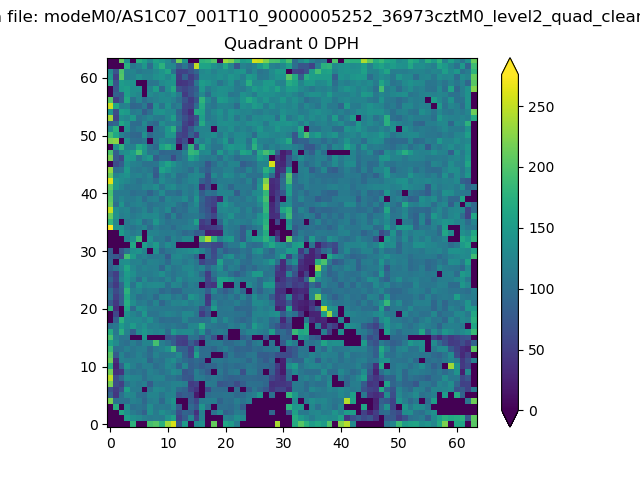 |
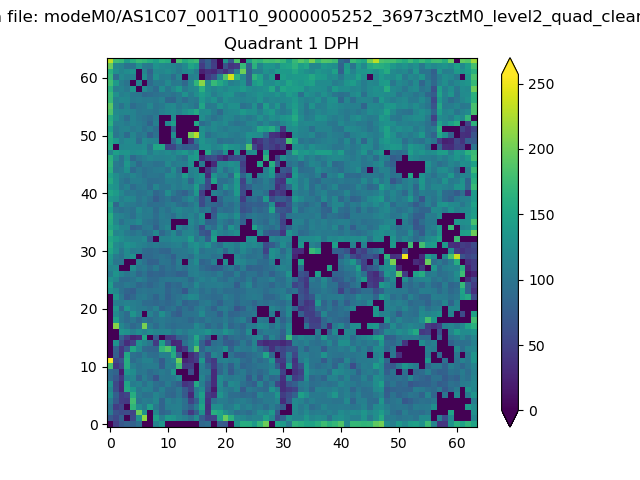 |
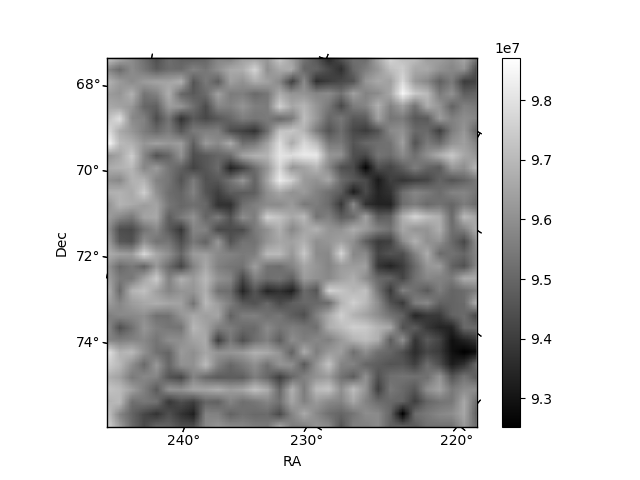
Quadrant B |
|---|---|---|---|
| Quadrant D | 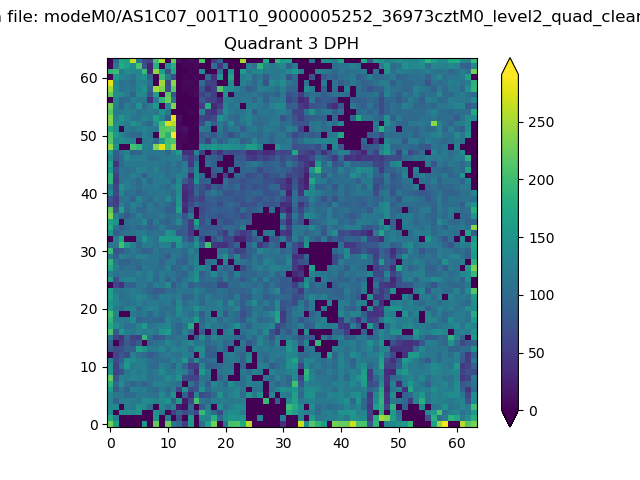 |
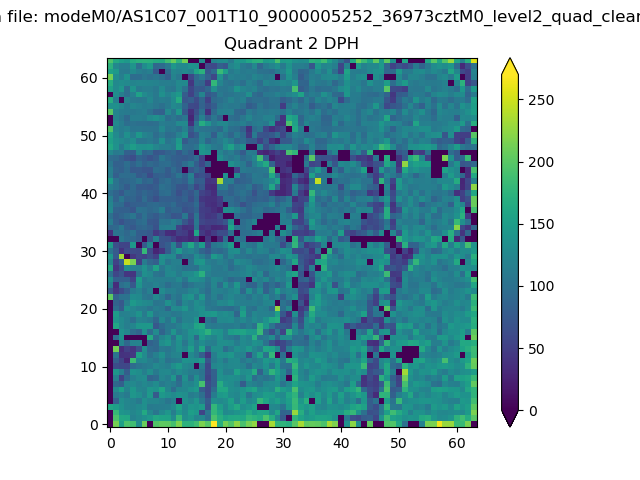 |
Quadrant C |
| Plot type | Count rate plots | Images |
|---|---|---|
| Comparison with Poisson distribution Blue bars denote a histogram of data divided into 1 sec bins. Red curve is a Poisson curve with rate = median count rate of data. |
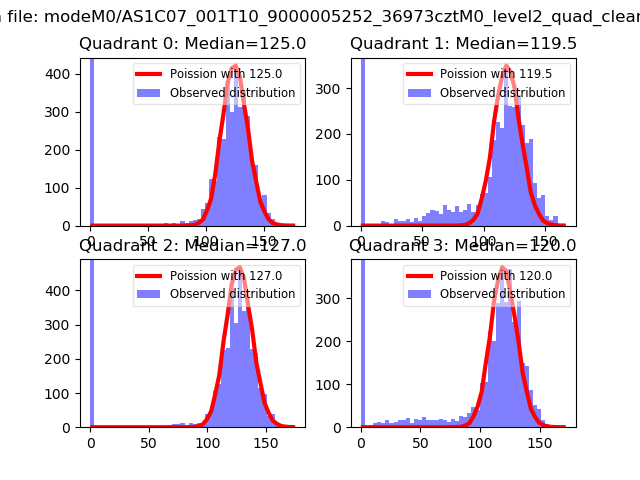 |
 |
| Quadrant-wise count rates Data is divided into 100 sec bins |
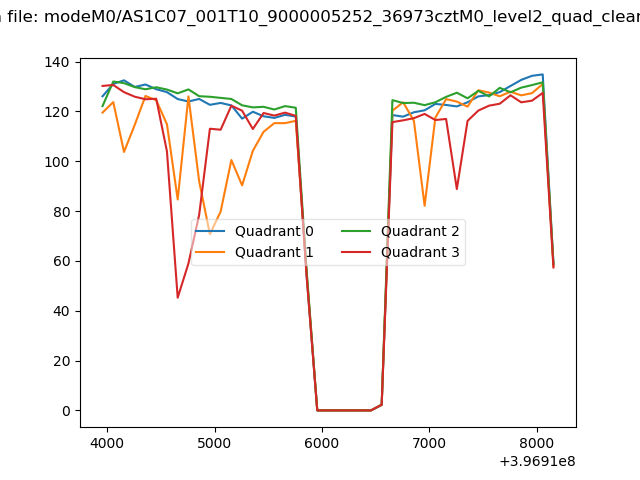 |
|
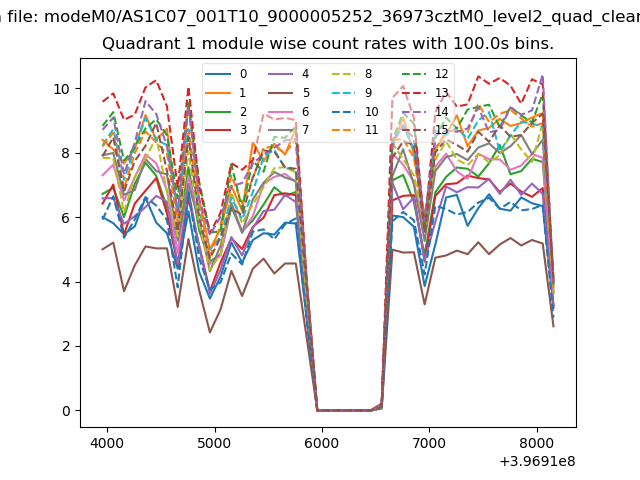
| Module-wise count rates for Quadrant A Data is divided into 100 sec bins |
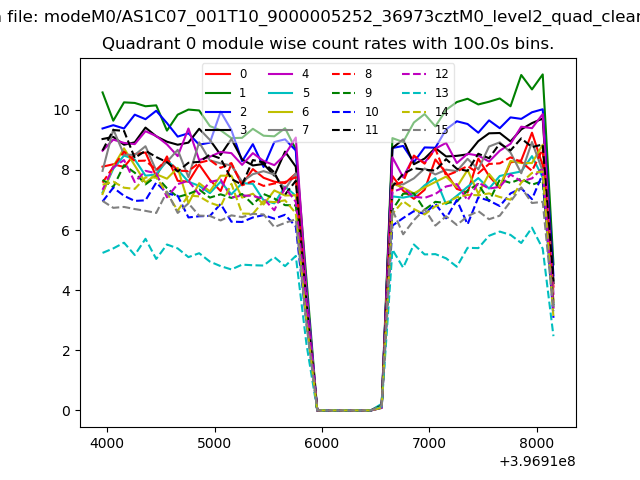 |
 |
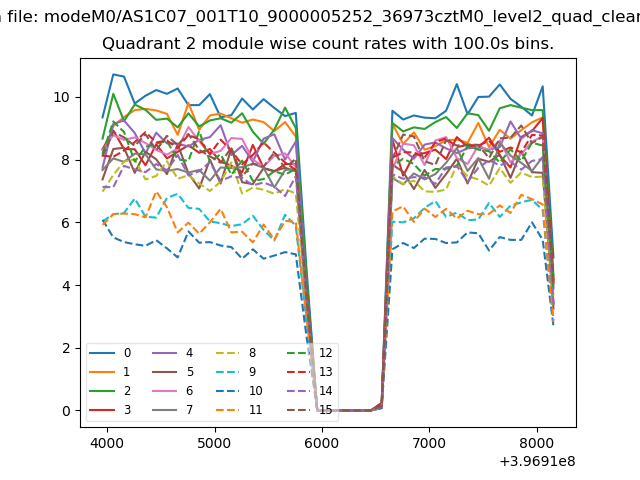
| Module-wise count rates for Quadrant B Data is divided into 100 sec bins |
 |
 |
| Module-wise count rates for Quadrant C Data is divided into 100 sec bins |
 |
 |
| Module-wise count rates for Quadrant D Data is divided into 100 sec bins |
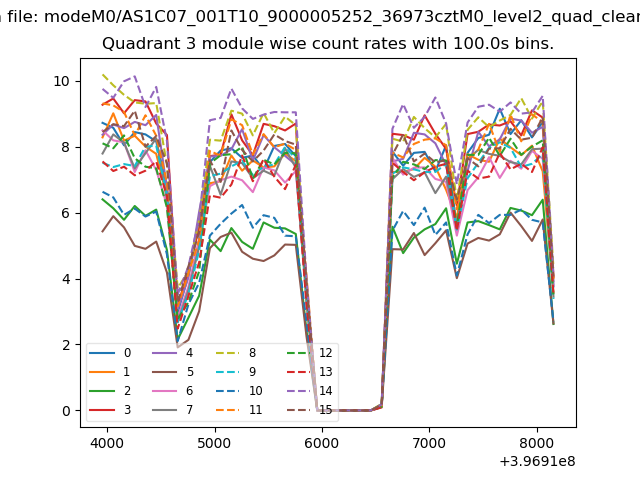 |
 |
| Parameter | Plot |
|---|---|
| CZT HV Monitor | 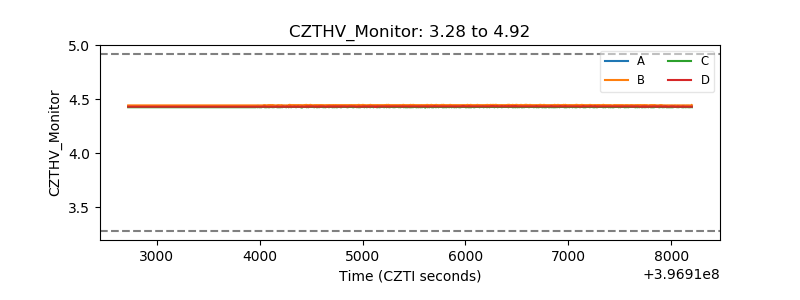 |
| D_VDD | 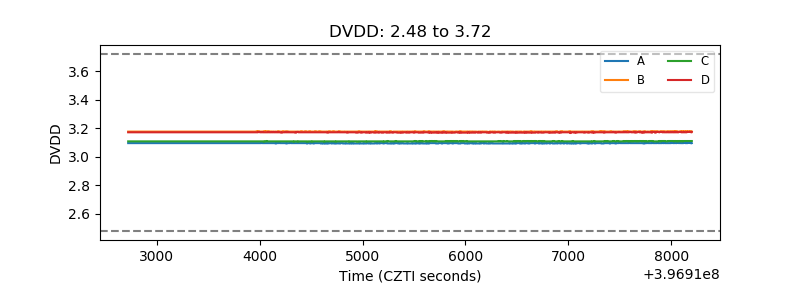 |
| Temperature 1 | 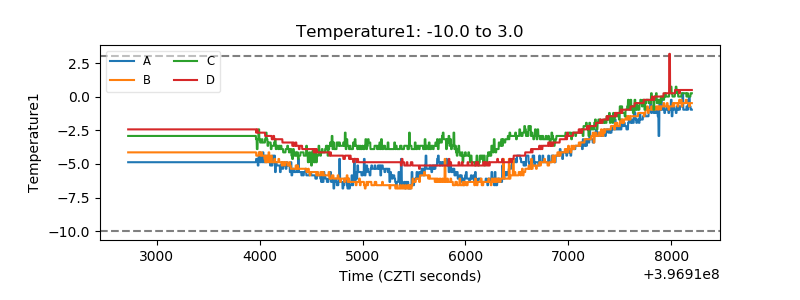 |
| Veto HV Monitor | 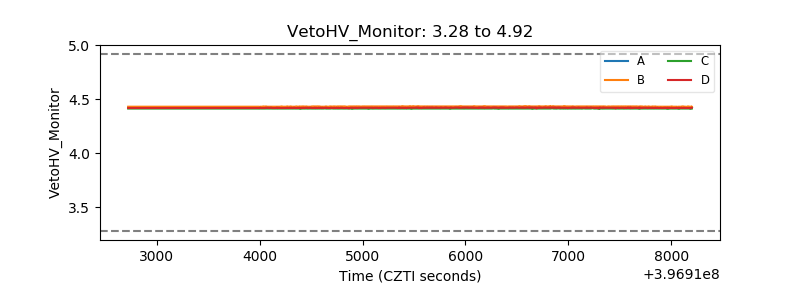 |
| Veto LLD | 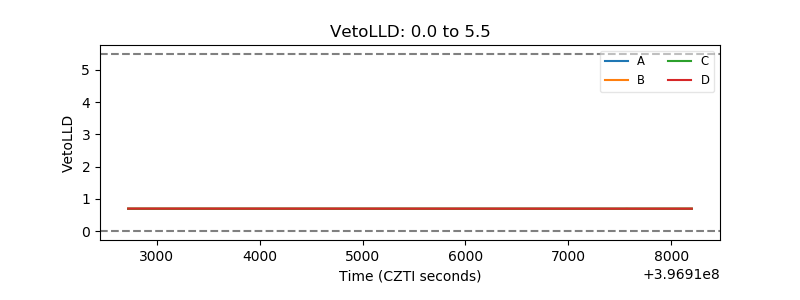 |
| Alpha Counter | 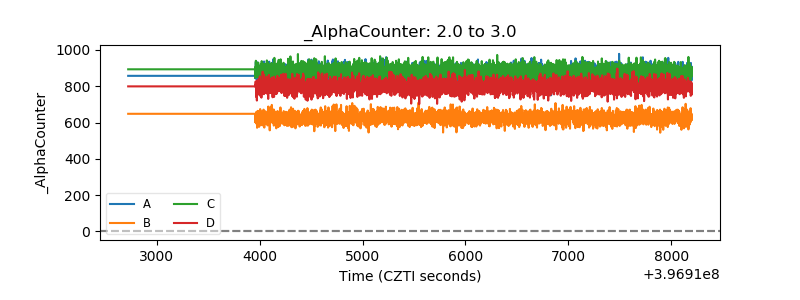 |
| _CPM_Rate | 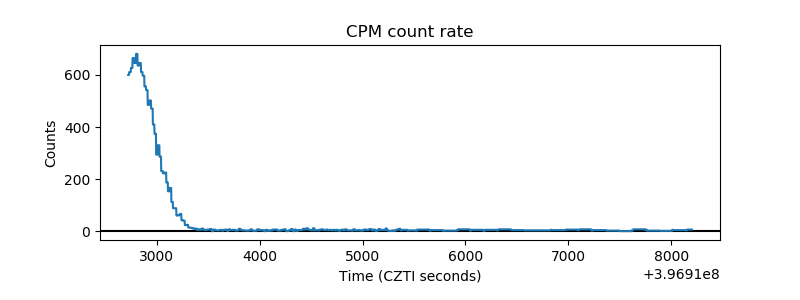 |
| CZT Counter | 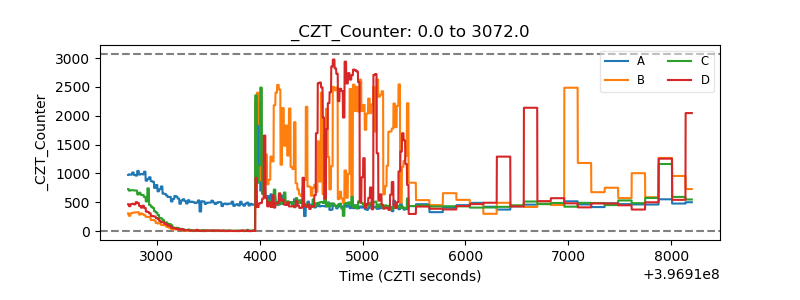 |
| +2.5 Volts monitor | 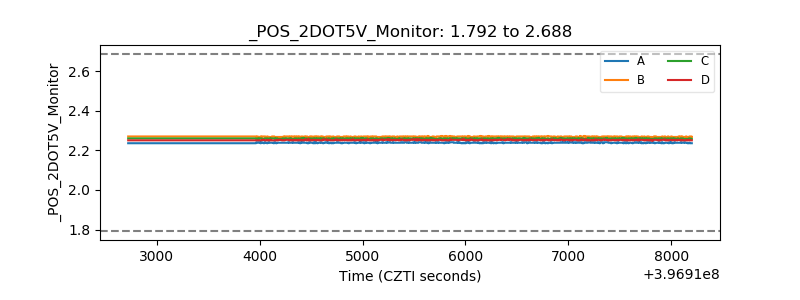 |
| +5 Volts monitor | 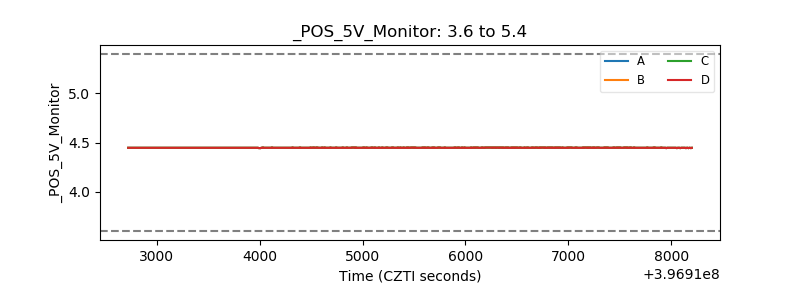 |
| _ROLL_ROT | 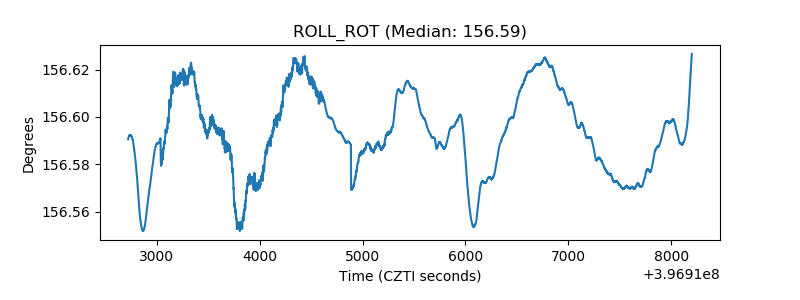 |
| _Roll_DEC | 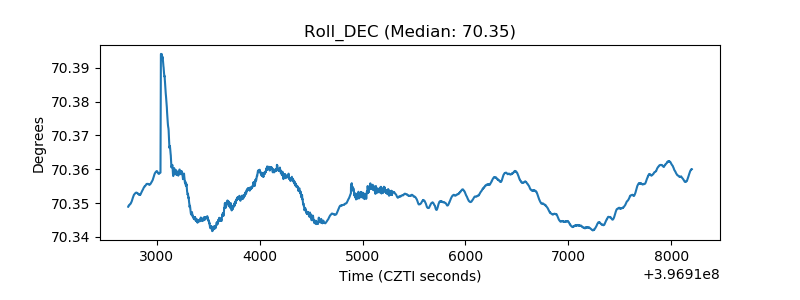 |
| _Roll_RA | 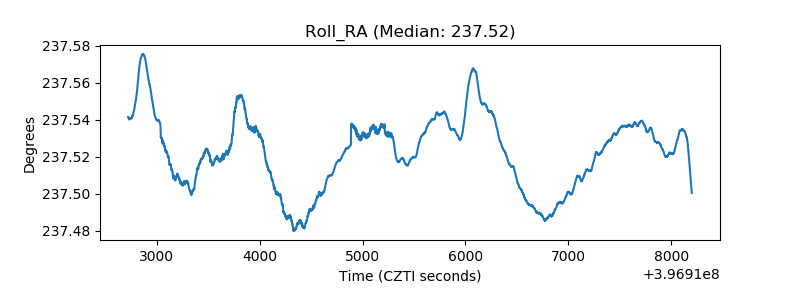 |
| Veto Counter | 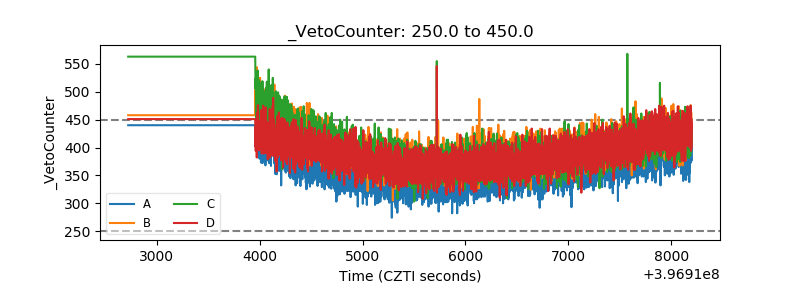 |