| Param | Original file | Final file |
|---|---|---|
| Filename | modeM0/AS1A11_079T01_9000005254cztM0_level2.fits | modeM0/AS1A11_079T01_9000005254cztM0_level2_quad_clean.evt |
| Size (bytes) | 1,219,749,120 | 1,127,502,720 |
| Size | 1.1 GB | 1.1 GB |
| Events in quadrant A | 7,569,394 | 6,918,716 |
| Events in quadrant B | 6,741,112 | 5,772,044 |
| Events in quadrant C | 7,410,694 | 6,675,281 |
| Events in quadrant D | 6,272,658 | 5,842,231 |
| Mode SS | |||
|---|---|---|---|
| Quadrant | BADHDUFLAG | Total packets | Discarded packets |
| A | 0 | 2666 | 0 |
| B | 0 | 2666 | 0 |
| C | 0 | 2664 | 0 |
| D | 0 | 2662 | 0 |
| Mode M9 | |||
|---|---|---|---|
| Quadrant | BADHDUFLAG | Total packets | Discarded packets |
| A | 0 | 495 | 0 |
| B | 0 | 495 | 0 |
| C | 0 | 495 | 0 |
| D | 0 | 495 | 0 |
| Mode M0 | |||
|---|---|---|---|
| Quadrant | BADHDUFLAG | Total packets | Discarded packets |
| A | 0 | 273233 | 0 |
| B | 0 | 458064 | 0 |
| C | 0 | 290303 | 0 |
| D | 0 | 355687 | 0 |
| Quadrant | Total seconds | Saturated seconds | Saturation percentage |
|---|---|---|---|
| A | 130409 | 259 | 0.198606% |
| B | 130405 | 17728 | 13.594571% |
| C | 130448 | 927 | 0.710628% |
| D | 130408 | 7390 | 5.666830% |
Noise dominated data is calculated using 1-second bins in cleaned event files. If a bin has >2000 counts, and if more than 50% of those come from <1% of pixels, then it is considered to be noise-dominated and hence unusable.
| Quadrant | # 1 sec bins | Bins with >0 counts | Bins with >2000 counts | High rate bins dominated by noise | Noise dominated (total time) | Noise dominated (detector-on time) | Marked lightcurve |
|---|---|---|---|---|---|---|---|
| A | 179055 | 130533 | 0 | 0 | 0.00% | 0.00% | 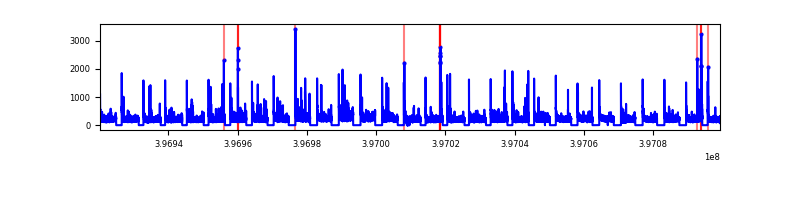 |
| B | 179055 | 130509 | 0 | 0 | 0.00% | 0.00% |  |
| C | 179055 | 130567 | 0 | 0 | 0.00% | 0.00% |  |
| D | 179055 | 130274 | 0 | 0 | 0.00% | 0.00% | 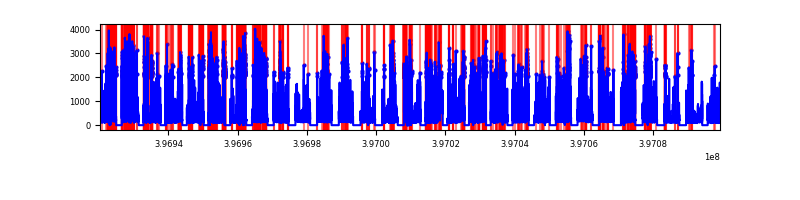 |
Top three noisy pixels from each quadrant. If the there are fewer than three noisy pixels in the level2.evt file, extra rows are filled as -1
| Pixel properties | Quadrant properties | ||||||
|---|---|---|---|---|---|---|---|
| Quadrant | DetID | PixID | Counts | Sigma | Mean | Median | Sigma |
| A | 0 | 29 | 6144 | 8.81 | 1977 | 1854 | 487.0 |
| A | 7 | 110 | 6122 | 8.76 | 1977 | 1854 | 487.0 |
| A | 9 | 19 | 6038 | 8.59 | 1977 | 1854 | 487.0 |
| B | 2 | 9 | 5885 | 11.89 | 1785 | 1703 | 351.8 |
| B | 3 | 80 | 5223 | 10.0 | 1785 | 1703 | 351.8 |
| B | 2 | 8 | 4879 | 9.03 | 1785 | 1703 | 351.8 |
| C | 1 | 81 | 6384 | 9.05 | 1962 | 1841 | 501.8 |
| C | 1 | 80 | 6108 | 8.5 | 1962 | 1841 | 501.8 |
| C | 3 | 203 | 5781 | 7.85 | 1962 | 1841 | 501.8 |
| D | 10 | 189 | 4688 | 6.34 | 1799 | 1645 | 479.6 |
| D | 7 | 3 | 4554 | 6.06 | 1799 | 1645 | 479.6 |
| D | 3 | 14 | 4481 | 5.91 | 1799 | 1645 | 479.6 |
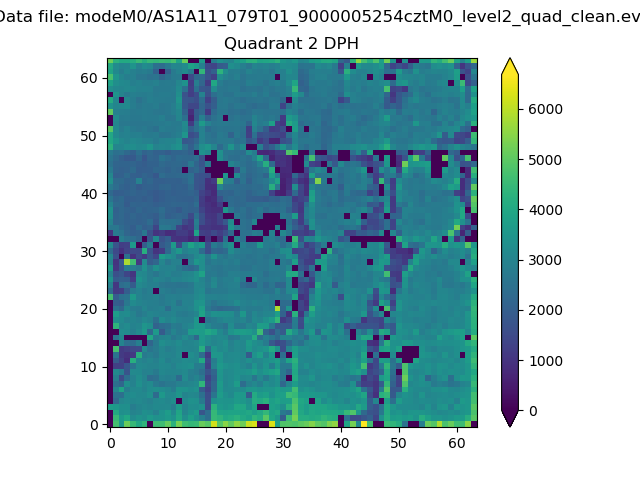
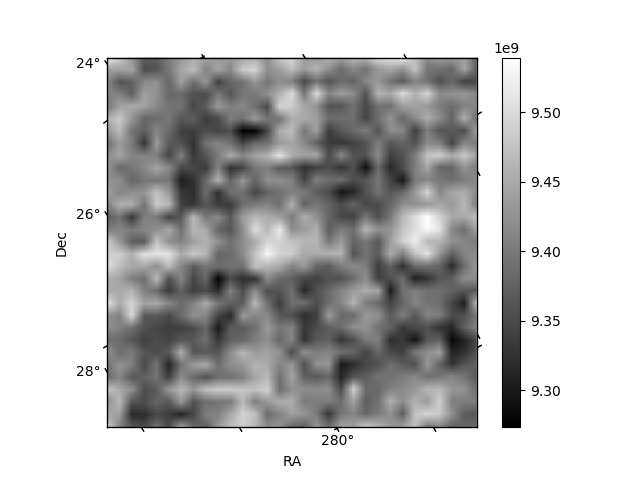
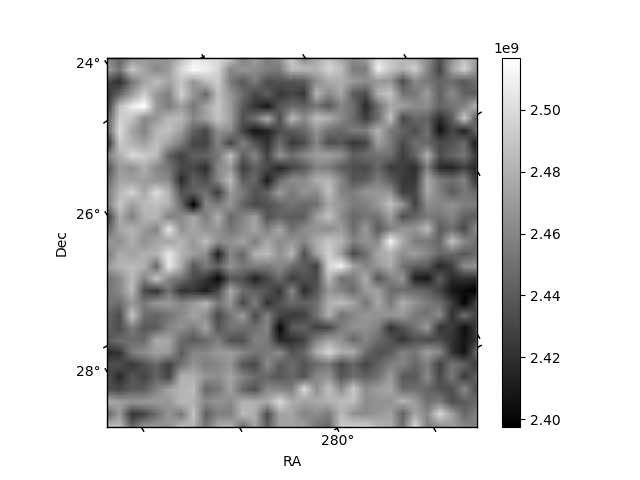
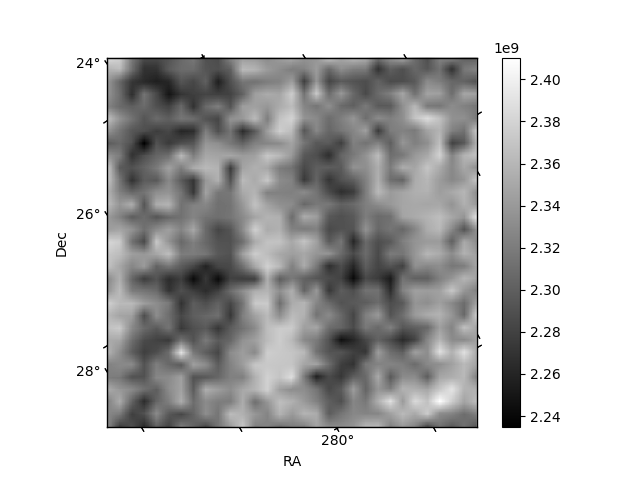
Histogram calculated using DETX and DETY for each event in the final _common_clean file
| Quadrant A |  |
 |
Quadrant B |
|---|---|---|---|
| Quadrant D | 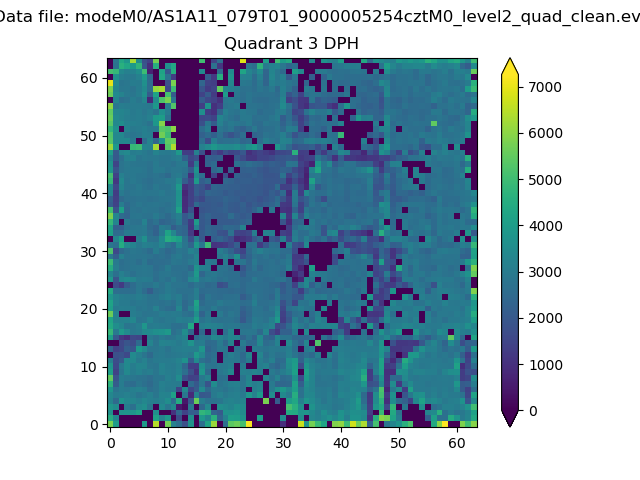 |
 |
Quadrant C |
| Plot type | Count rate plots | Images |
|---|---|---|
| Comparison with Poisson distribution Blue bars denote a histogram of data divided into 1 sec bins. Red curve is a Poisson curve with rate = median count rate of data. |
 |
 |
| Quadrant-wise count rates Data is divided into 100 sec bins |
 |
|
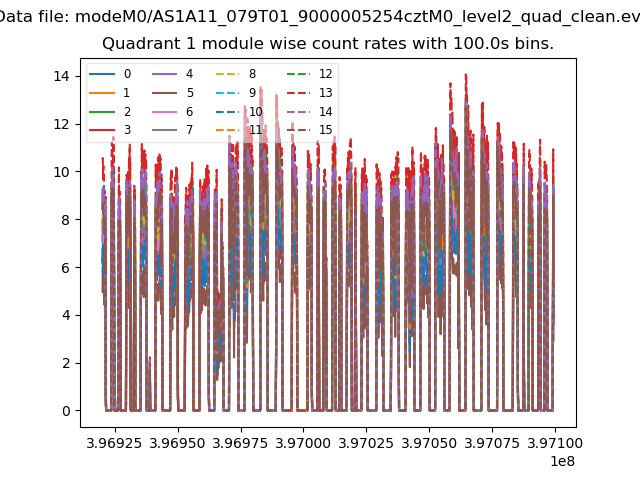
| Module-wise count rates for Quadrant A Data is divided into 100 sec bins |
 |
 |
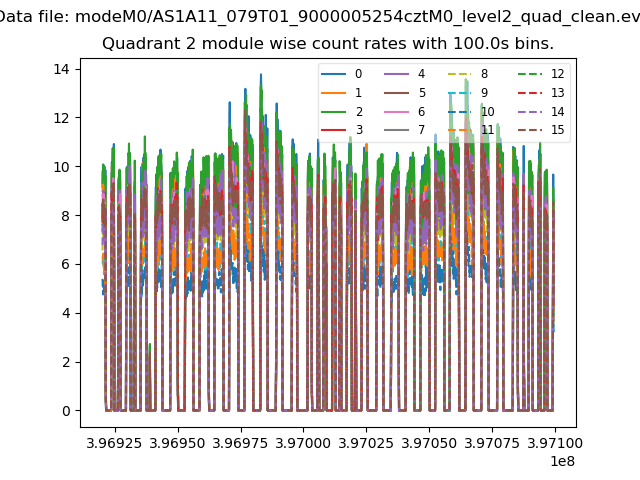
| Module-wise count rates for Quadrant B Data is divided into 100 sec bins |
 |
 |
| Module-wise count rates for Quadrant C Data is divided into 100 sec bins |
 |
 |
| Module-wise count rates for Quadrant D Data is divided into 100 sec bins |
 |
 |
| Parameter | Plot |
|---|---|
| CZT HV Monitor |  |
| D_VDD | 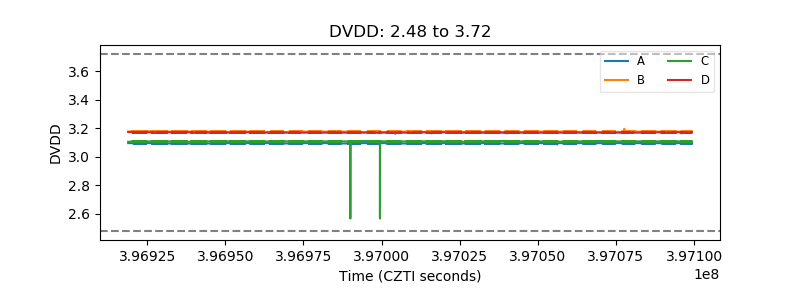 |
| Temperature 1 |  |
| Veto HV Monitor | 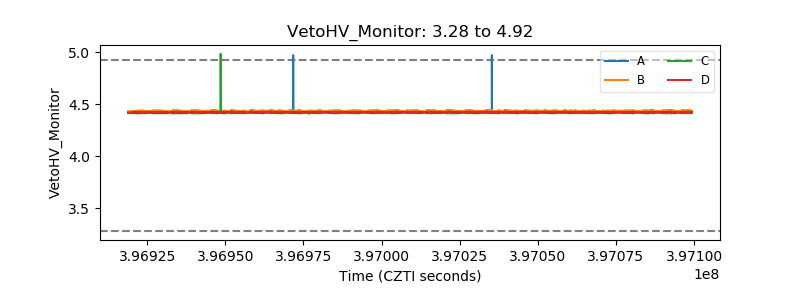 |
| Veto LLD |  |
| Alpha Counter |  |
| _CPM_Rate |  |
| CZT Counter | 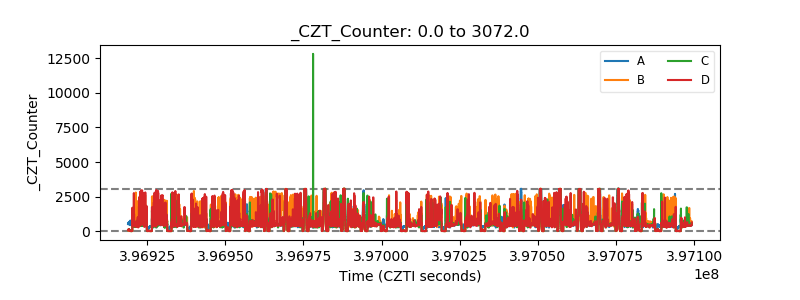 |
| +2.5 Volts monitor |  |
| +5 Volts monitor |  |
| _ROLL_ROT |  |
| _Roll_DEC |  |
| _Roll_RA |  |
| Veto Counter |  |