| Param | Original file | Final file |
|---|---|---|
| Filename | modeM0/AS1A11_079T01_9000005254_36973cztM0_level2.evt | modeM0/AS1A11_079T01_9000005254_36973cztM0_level2_quad_clean.evt |
| Size (bytes) | 60,808,320 | 13,559,040 |
| Size | 58.0 MB | 12.9 MB |
| Events in quadrant A | 380,278 | 88,215 |
| Events in quadrant B | 604,655 | 88,498 |
| Events in quadrant C | 374,491 | 89,873 |
| Events in quadrant D | 430,125 | 85,839 |
| Mode SS | |||
|---|---|---|---|
| Quadrant | BADHDUFLAG | Total packets | Discarded packets |
| A | 0 | 14 | 0 |
| B | 0 | 14 | 0 |
| C | 0 | 14 | 0 |
| D | 0 | 14 | 0 |
| Mode M9 | |||
|---|---|---|---|
| Quadrant | BADHDUFLAG | Total packets | Discarded packets |
| A | 0 | 14 | 0 |
| B | 0 | 14 | 0 |
| C | 0 | 14 | 0 |
| D | 0 | 14 | 0 |
| Mode M0 | |||
|---|---|---|---|
| Quadrant | BADHDUFLAG | Total packets | Discarded packets |
| A | 0 | 1596 | 2 |
| B | 0 | 2282 | 1 |
| C | 0 | 1561 | 1 |
| D | 0 | 1760 | 1 |
| Quadrant | Total seconds | Saturated seconds | Saturation percentage |
|---|---|---|---|
| A | 718 | 3 | 0.417827% |
| B | 718 | 28 | 3.899721% |
| C | 718 | 5 | 0.696379% |
| D | 718 | 15 | 2.089136% |
Noise dominated data is calculated using 1-second bins in cleaned event files. If a bin has >2000 counts, and if more than 50% of those come from <1% of pixels, then it is considered to be noise-dominated and hence unusable.
| Quadrant | # 1 sec bins | Bins with >0 counts | Bins with >2000 counts | High rate bins dominated by noise | Noise dominated (total time) | Noise dominated (detector-on time) | Marked lightcurve |
|---|---|---|---|---|---|---|---|
| A | 718 | 718 | 2 | 2 | 0.28% | 0.28% | 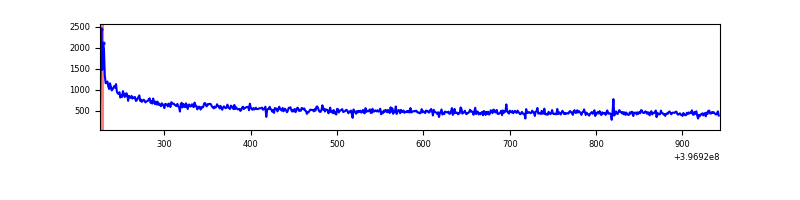 |
| B | 718 | 718 | 25 | 25 | 3.48% | 3.48% | 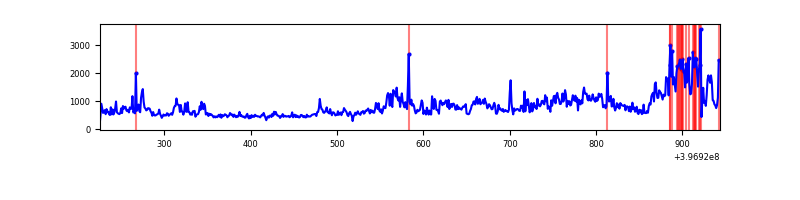 |
| C | 718 | 718 | 3 | 3 | 0.42% | 0.42% | 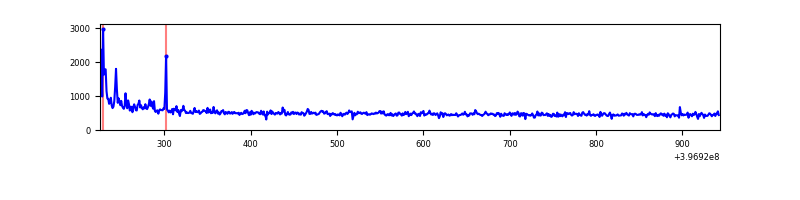 |
| D | 718 | 718 | 13 | 13 | 1.81% | 1.81% | 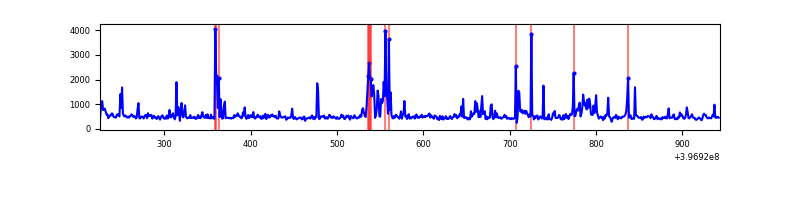 |
Top three noisy pixels from each quadrant. If the there are fewer than three noisy pixels in the level2.evt file, extra rows are filled as -1
| Pixel properties | Quadrant properties | ||||||
|---|---|---|---|---|---|---|---|
| Quadrant | DetID | PixID | Counts | Sigma | Mean | Median | Sigma |
| A | 10 | 83 | 74542 | 4141.44 | 77 | 75 | 18.0 |
| A | 13 | 6 | 3029 | 164.29 | 77 | 75 | 18.0 |
| A | 10 | 67 | 2701 | 146.04 | 77 | 75 | 18.0 |
| B | 5 | 184 | 198530 | 11451.45 | 78 | 76 | 17.3 |
| B | 0 | 190 | 39182 | 2256.55 | 78 | 76 | 17.3 |
| B | 0 | 221 | 28734 | 1653.66 | 78 | 76 | 17.3 |
| C | 15 | 214 | 35598 | 1737.11 | 77 | 77 | 20.4 |
| C | 0 | 10 | 20894 | 1018.03 | 77 | 77 | 20.4 |
| C | 3 | 233 | 15081 | 733.75 | 77 | 77 | 20.4 |
| D | 2 | 250 | 61527 | 2969.01 | 76 | 73 | 20.7 |
| D | 13 | 171 | 36775 | 1773.18 | 76 | 73 | 20.7 |
| D | 2 | 153 | 7418 | 354.86 | 76 | 73 | 20.7 |
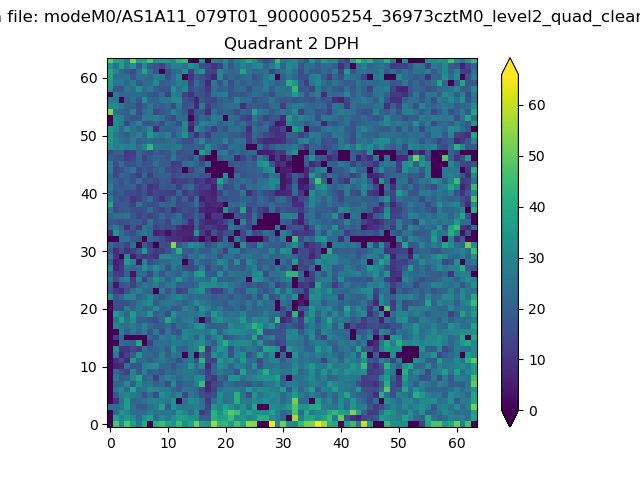
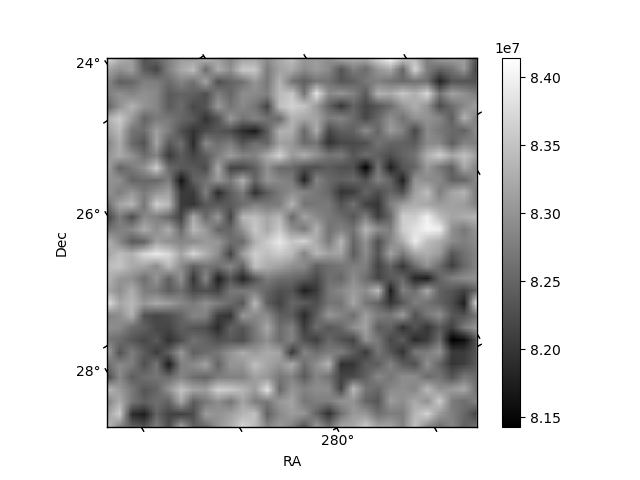
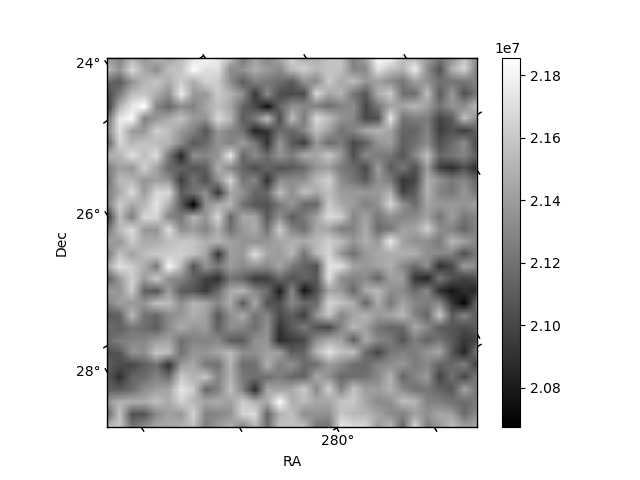
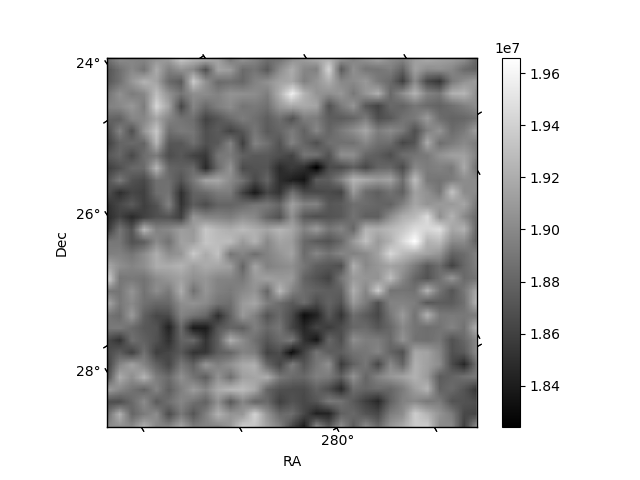
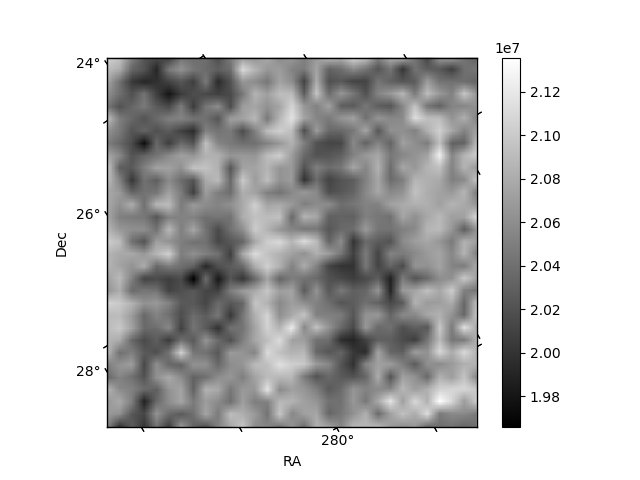
Histogram calculated using DETX and DETY for each event in the final _common_clean file
| Quadrant A | 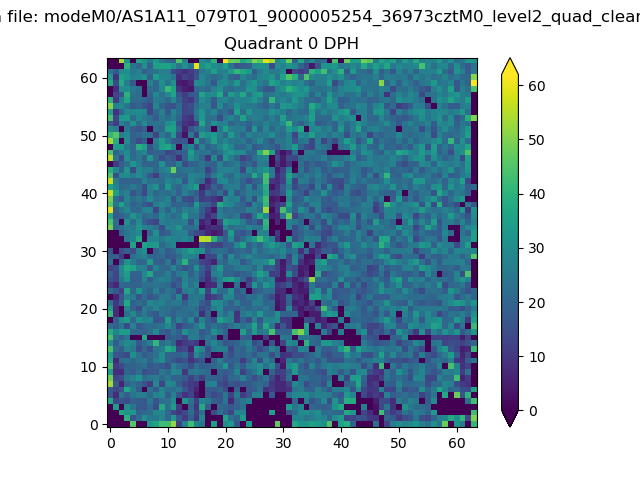 |
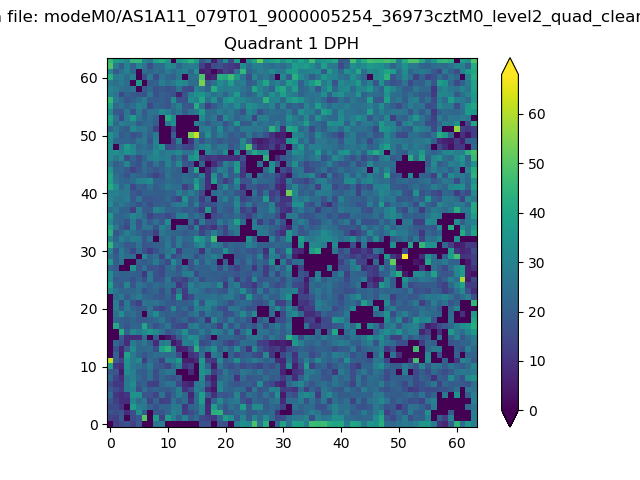 |
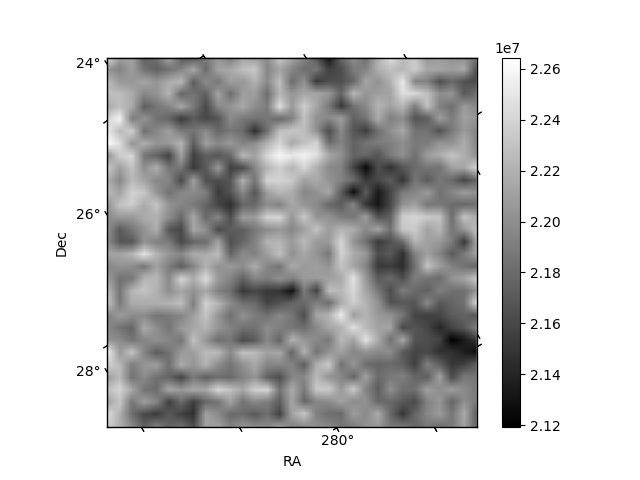
Quadrant B |
|---|---|---|---|
| Quadrant D | 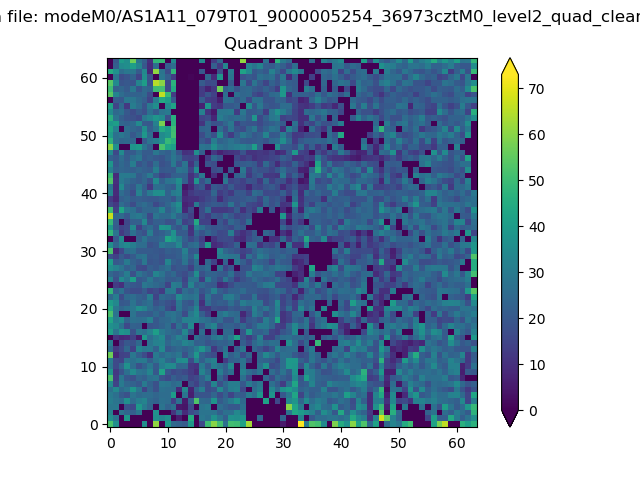 |
 |
Quadrant C |
| Plot type | Count rate plots | Images |
|---|---|---|
| Comparison with Poisson distribution Blue bars denote a histogram of data divided into 1 sec bins. Red curve is a Poisson curve with rate = median count rate of data. |
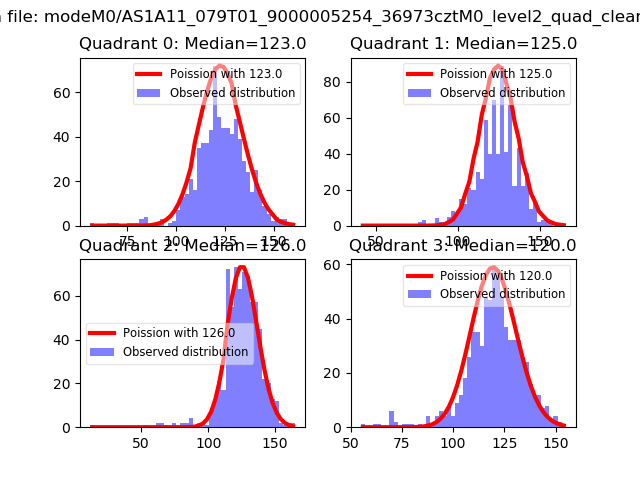 |
 |
| Quadrant-wise count rates Data is divided into 100 sec bins |
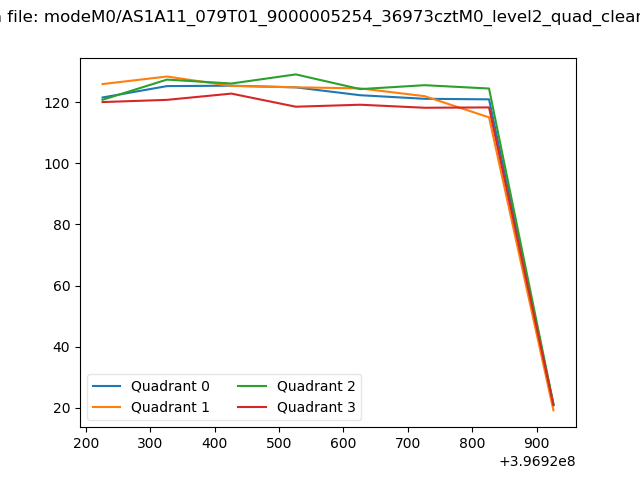 |
|
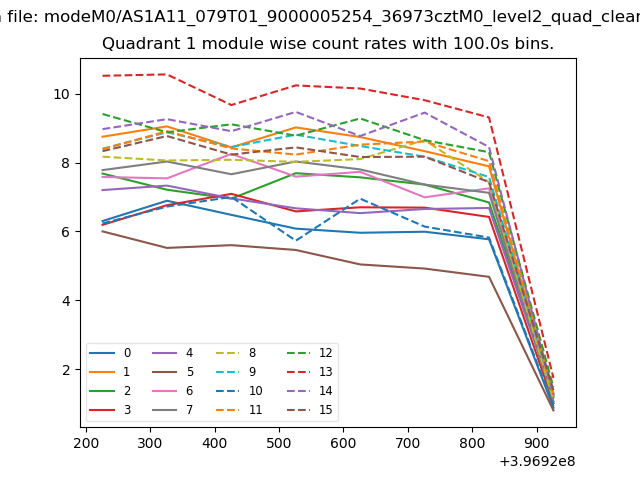
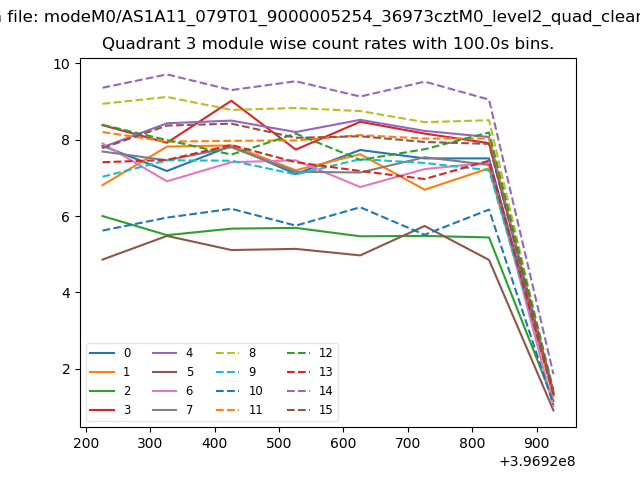
| Module-wise count rates for Quadrant A Data is divided into 100 sec bins |
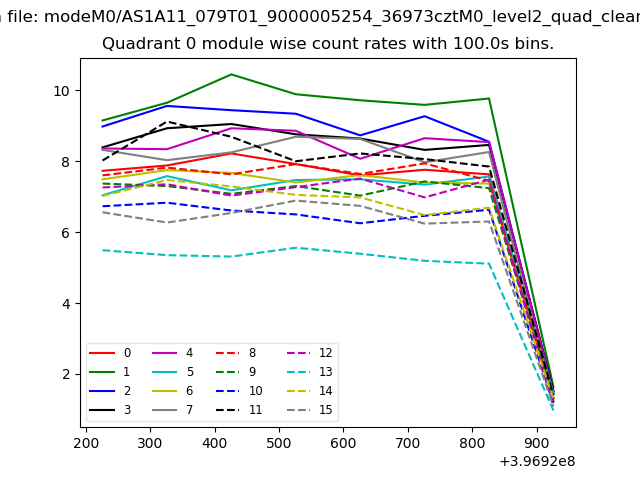 |
 |
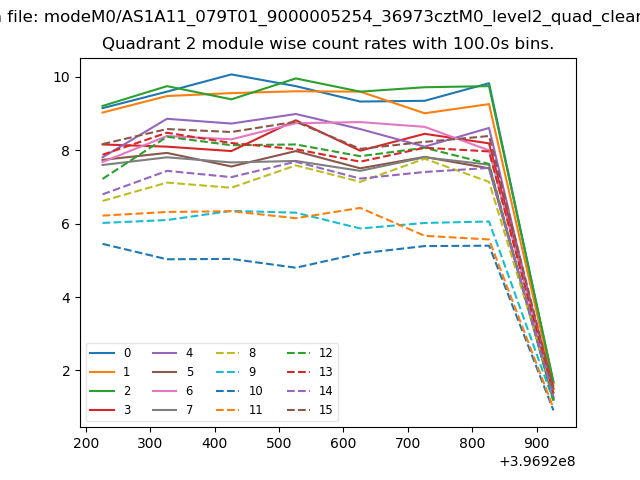
| Module-wise count rates for Quadrant B Data is divided into 100 sec bins |
 |
 |
| Module-wise count rates for Quadrant C Data is divided into 100 sec bins |
 |
 |
| Module-wise count rates for Quadrant D Data is divided into 100 sec bins |
 |
 |
| Parameter | Plot |
|---|---|
| CZT HV Monitor |  |
| D_VDD |  |
| Temperature 1 | 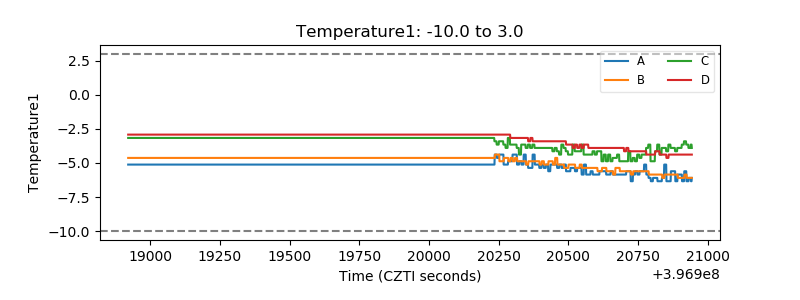 |
| Veto HV Monitor | 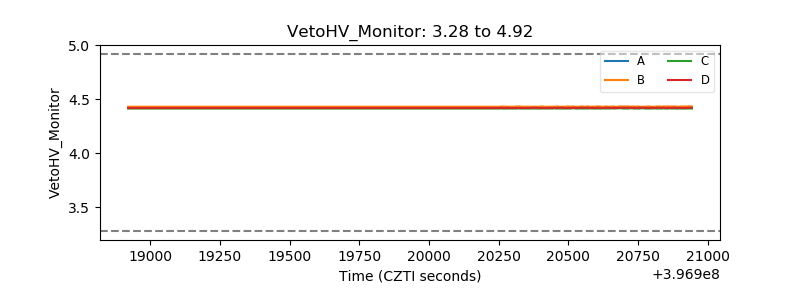 |
| Veto LLD | 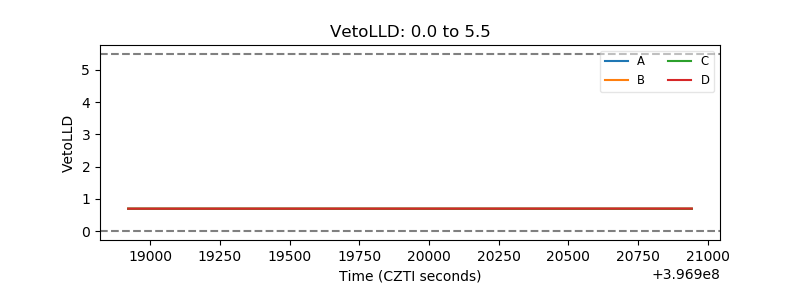 |
| Alpha Counter | 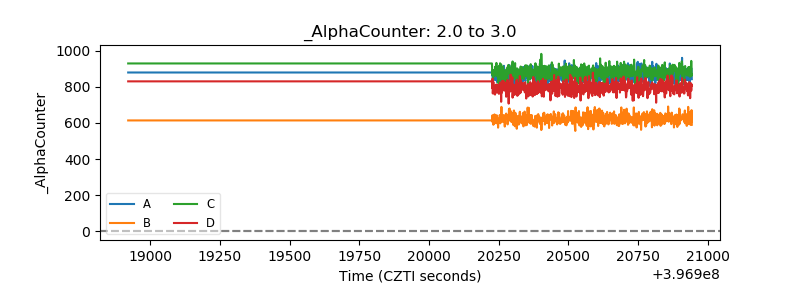 |
| _CPM_Rate | 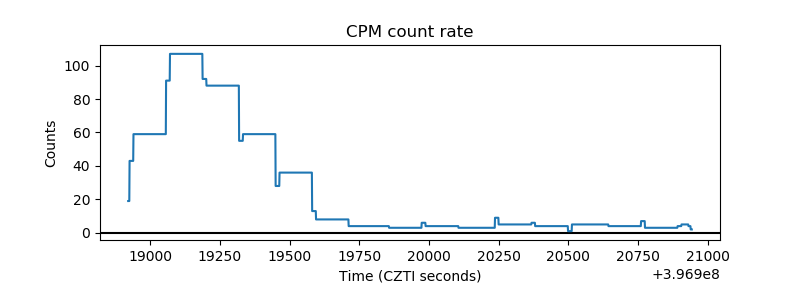 |
| CZT Counter | 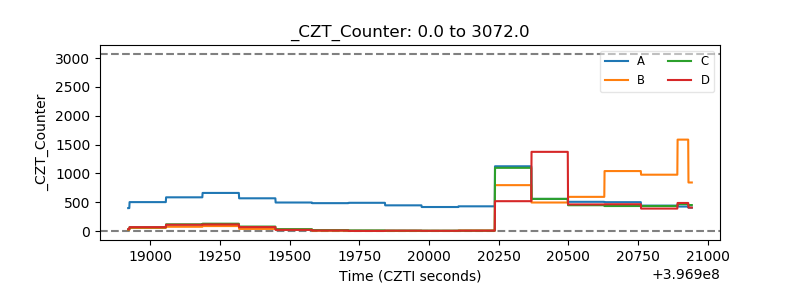 |
| +2.5 Volts monitor | 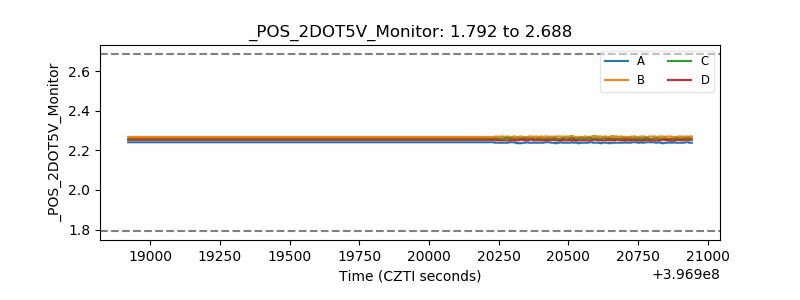 |
| +5 Volts monitor | 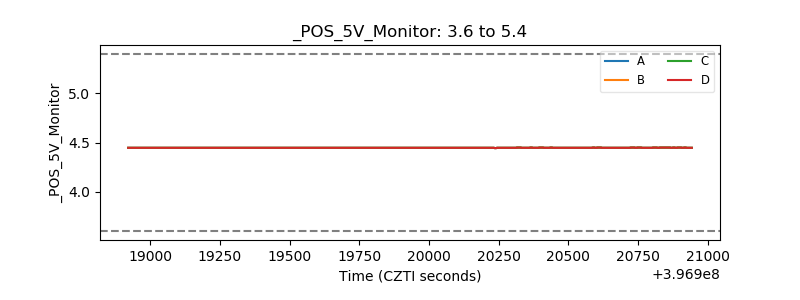 |
| _ROLL_ROT | 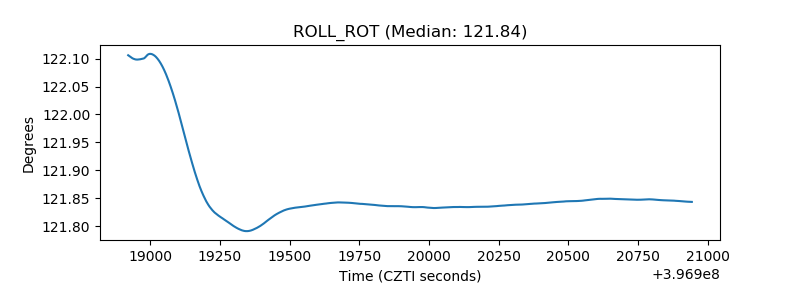 |
| _Roll_DEC | 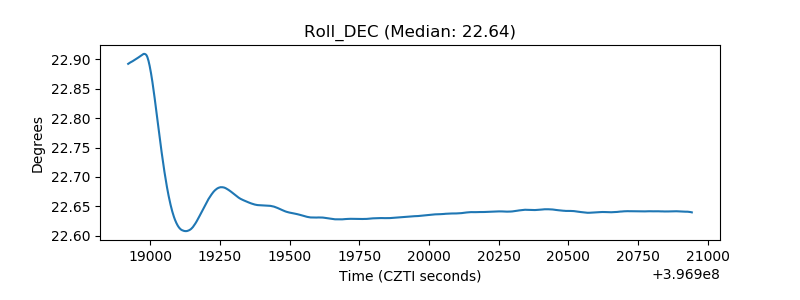 |
| _Roll_RA | 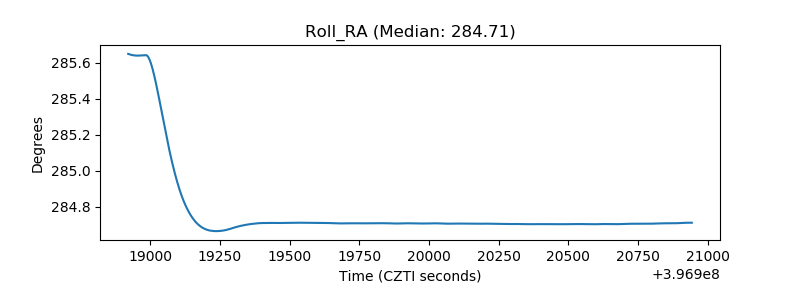 |
| Veto Counter | 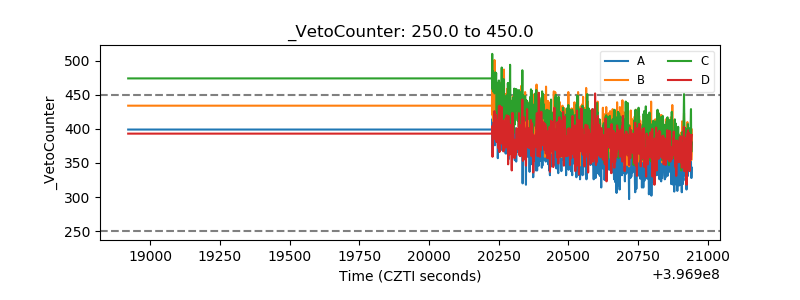 |