| Param | Original file | Final file |
|---|---|---|
| Filename | modeM0/AS1A11_079T01_9000005254_36974cztM0_level2.evt | modeM0/AS1A11_079T01_9000005254_36974cztM0_level2_quad_clean.evt |
| Size (bytes) | 531,466,560 | 65,476,800 |
| Size | 506.8 MB | 62.4 MB |
| Events in quadrant A | 2,660,122 | 406,039 |
| Events in quadrant B | 5,257,772 | 387,769 |
| Events in quadrant C | 2,871,253 | 414,494 |
| Events in quadrant D | 4,932,143 | 387,540 |
| Mode SS | |||
|---|---|---|---|
| Quadrant | BADHDUFLAG | Total packets | Discarded packets |
| A | 0 | 112 | 0 |
| B | 0 | 112 | 0 |
| C | 0 | 112 | 0 |
| D | 0 | 112 | 0 |
| Mode M9 | |||
|---|---|---|---|
| Quadrant | BADHDUFLAG | Total packets | Discarded packets |
| A | 0 | 30 | 0 |
| B | 0 | 30 | 0 |
| C | 0 | 30 | 0 |
| D | 0 | 30 | 0 |
| Mode M0 | |||
|---|---|---|---|
| Quadrant | BADHDUFLAG | Total packets | Discarded packets |
| A | 0 | 11463 | 3 |
| B | 0 | 19449 | 2 |
| C | 0 | 11996 | 2 |
| D | 0 | 18509 | 2 |
| Quadrant | Total seconds | Saturated seconds | Saturation percentage |
|---|---|---|---|
| A | 5524 | 7 | 0.126720% |
| B | 5524 | 580 | 10.499638% |
| C | 5524 | 20 | 0.362056% |
| D | 5524 | 657 | 11.893555% |
Noise dominated data is calculated using 1-second bins in cleaned event files. If a bin has >2000 counts, and if more than 50% of those come from <1% of pixels, then it is considered to be noise-dominated and hence unusable.
| Quadrant | # 1 sec bins | Bins with >0 counts | Bins with >2000 counts | High rate bins dominated by noise | Noise dominated (total time) | Noise dominated (detector-on time) | Marked lightcurve |
|---|---|---|---|---|---|---|---|
| A | 7137 | 5525 | 3 | 3 | 0.04% | 0.05% | 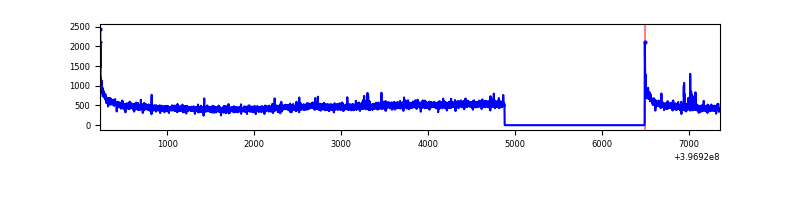 |
| B | 7137 | 5525 | 516 | 516 | 7.23% | 9.34% | 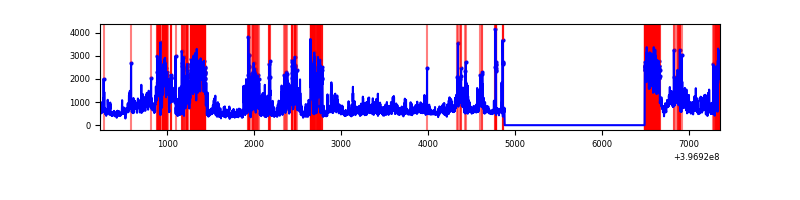 |
| C | 7137 | 5525 | 17 | 17 | 0.24% | 0.31% | 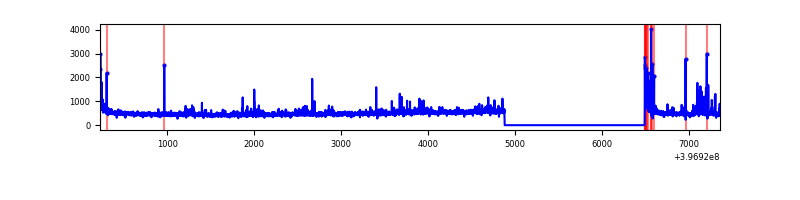 |
| D | 7136 | 5524 | 567 | 567 | 7.95% | 10.26% | 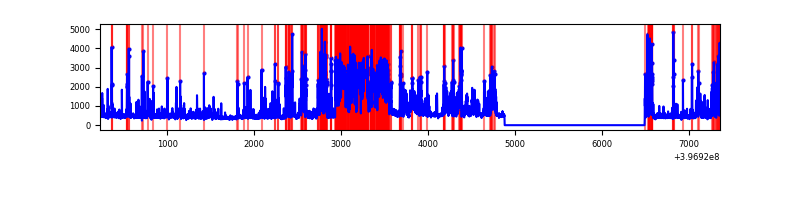 |
Top three noisy pixels from each quadrant. If the there are fewer than three noisy pixels in the level2.evt file, extra rows are filled as -1
| Pixel properties | Quadrant properties | ||||||
|---|---|---|---|---|---|---|---|
| Quadrant | DetID | PixID | Counts | Sigma | Mean | Median | Sigma |
| A | 10 | 83 | 229130 | 1834.56 | 617 | 605 | 124.6 |
| A | 15 | 222 | 20144 | 156.86 | 617 | 605 | 124.6 |
| A | 9 | 143 | 9129 | 68.43 | 617 | 605 | 124.6 |
| B | 5 | 184 | 2428587 | 20984.61 | 596 | 581 | 115.7 |
| B | 0 | 229 | 152185 | 1310.27 | 596 | 581 | 115.7 |
| B | 0 | 221 | 85006 | 729.66 | 596 | 581 | 115.7 |
| C | 15 | 214 | 237658 | 1657.04 | 605 | 610 | 143.1 |
| C | 0 | 10 | 96764 | 672.15 | 605 | 610 | 143.1 |
| C | 0 | 207 | 84504 | 586.44 | 605 | 610 | 143.1 |
| D | 12 | 17 | 1644128 | 11701.99 | 570 | 554 | 140.5 |
| D | 2 | 250 | 577596 | 4108.45 | 570 | 554 | 140.5 |
| D | 4 | 239 | 261638 | 1858.88 | 570 | 554 | 140.5 |
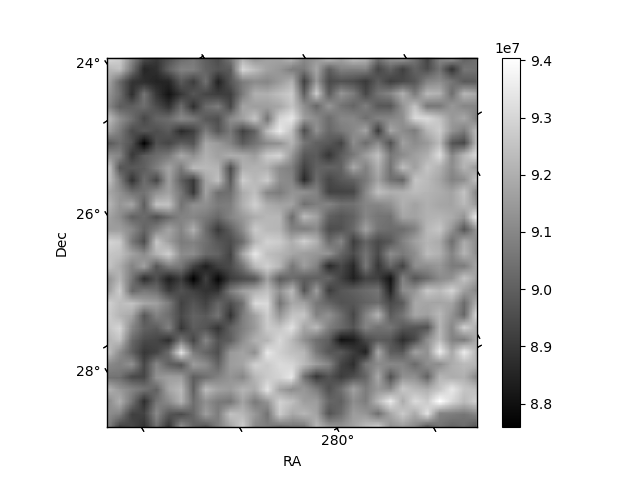
Histogram calculated using DETX and DETY for each event in the final _common_clean file
| Quadrant A | 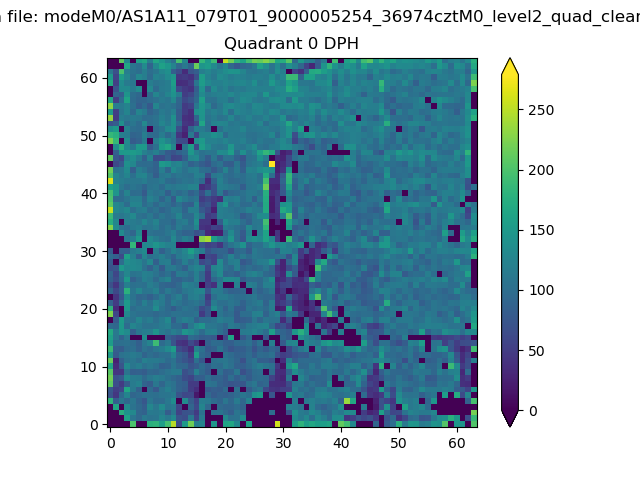 |
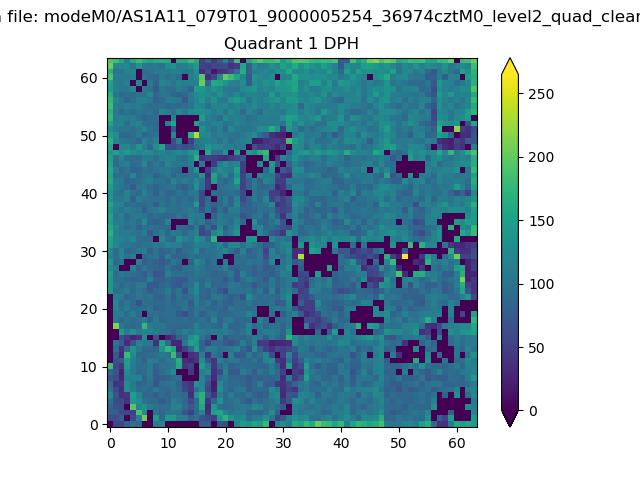 |
Quadrant B |
|---|---|---|---|
| Quadrant D | 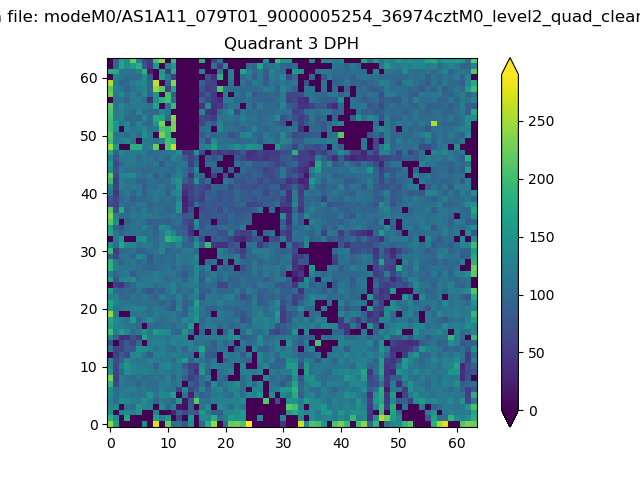 |
 |
Quadrant C |
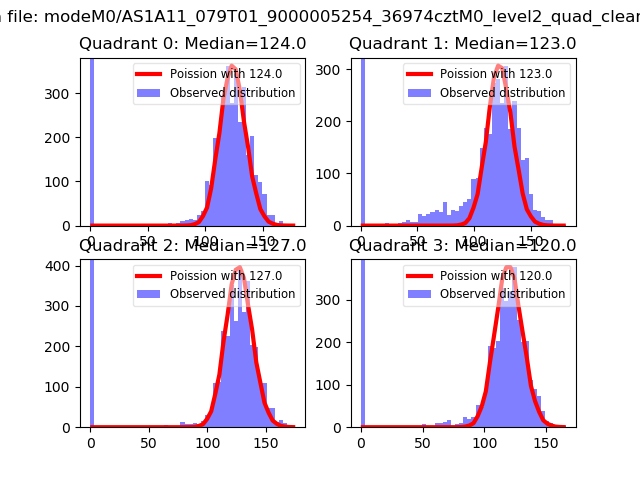
| Plot type | Count rate plots | Images |
|---|---|---|
| Comparison with Poisson distribution Blue bars denote a histogram of data divided into 1 sec bins. Red curve is a Poisson curve with rate = median count rate of data. |
 |
 |
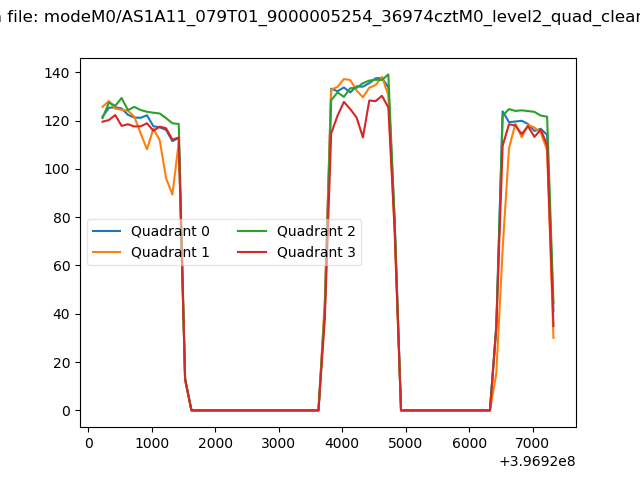
| Quadrant-wise count rates Data is divided into 100 sec bins |
 |
|
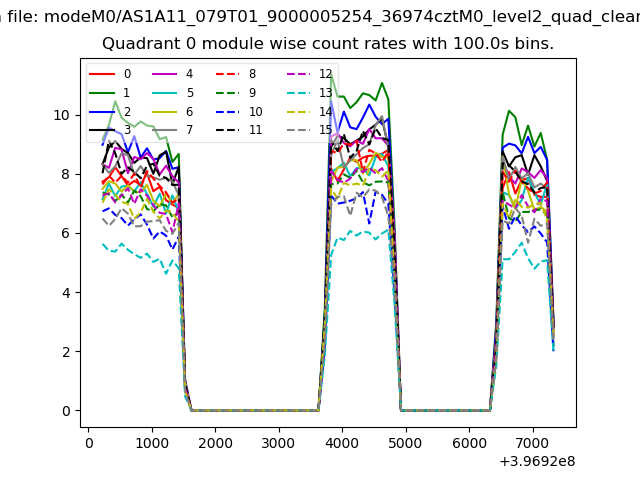
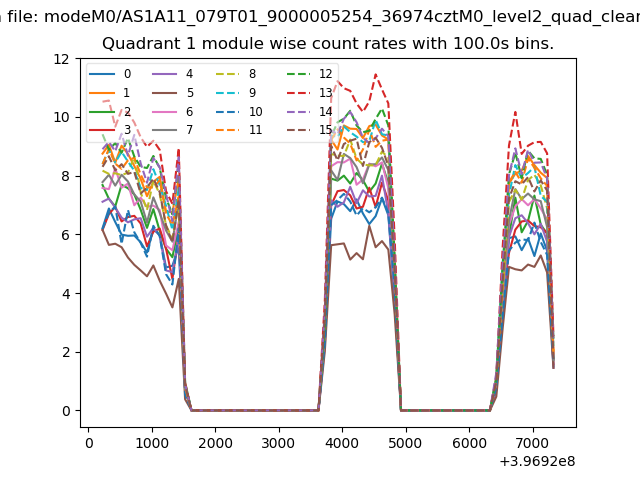
| Module-wise count rates for Quadrant A Data is divided into 100 sec bins |
 |
 |
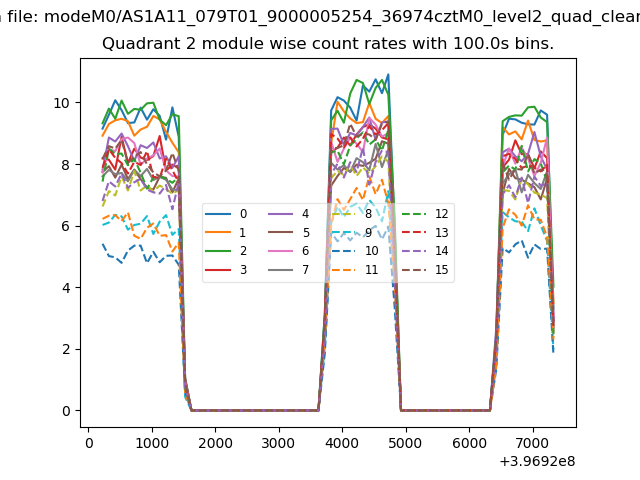
| Module-wise count rates for Quadrant B Data is divided into 100 sec bins |
 |
 |
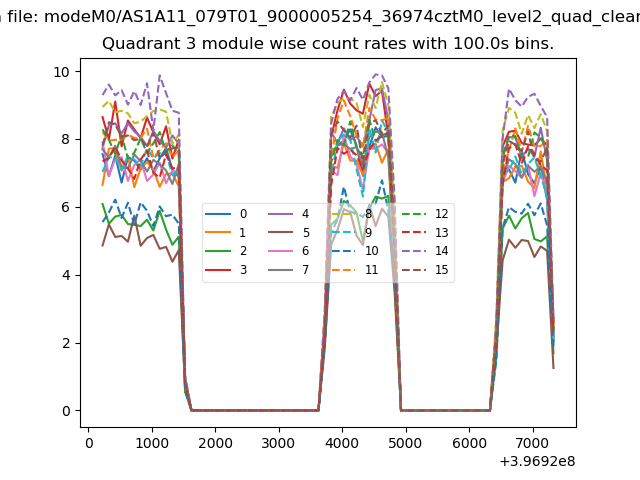
| Module-wise count rates for Quadrant C Data is divided into 100 sec bins |
 |
 |
| Module-wise count rates for Quadrant D Data is divided into 100 sec bins |
 |
 |
| Parameter | Plot |
|---|---|
| CZT HV Monitor | 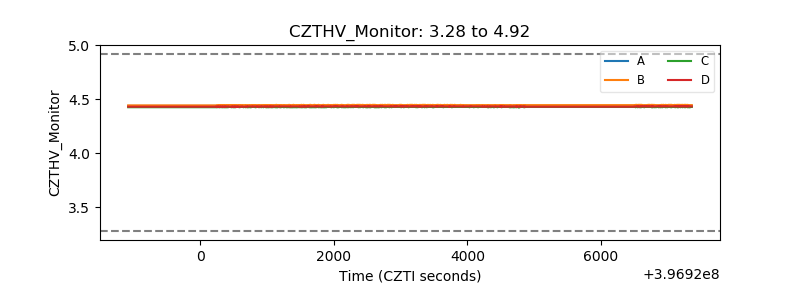 |
| D_VDD | 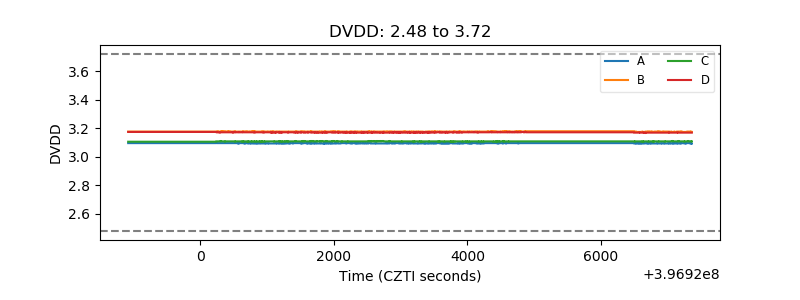 |
| Temperature 1 | 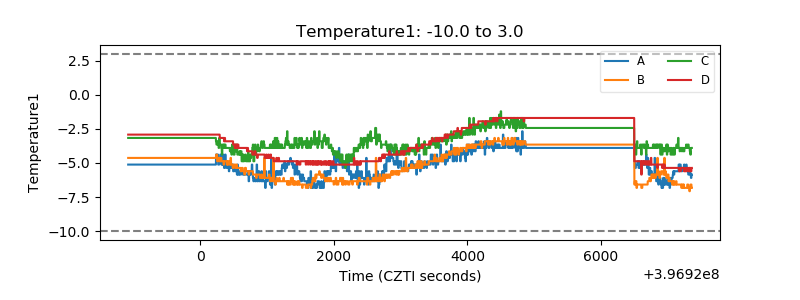 |
| Veto HV Monitor | 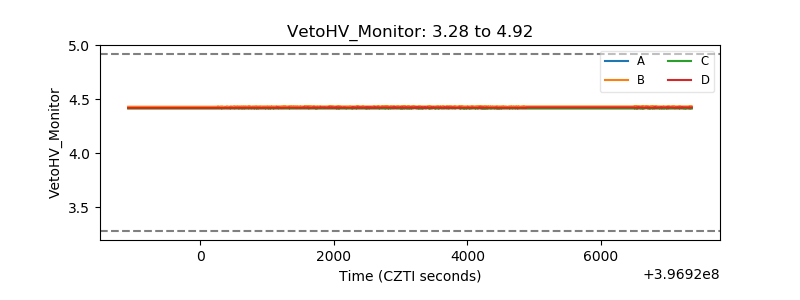 |
| Veto LLD | 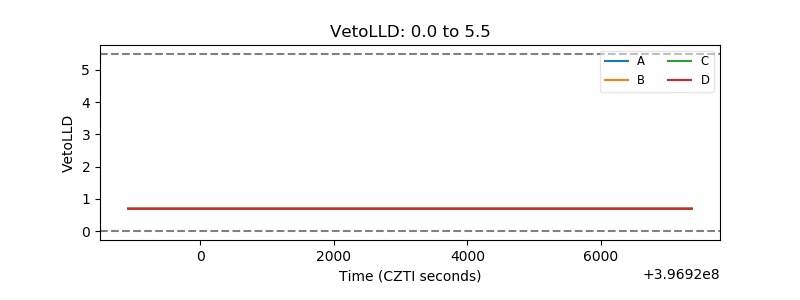 |
| Alpha Counter | 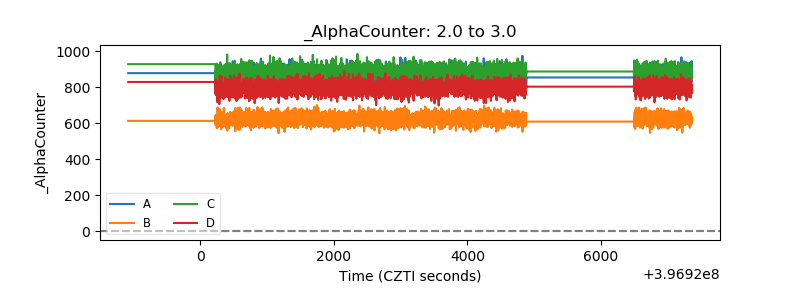 |
| _CPM_Rate | 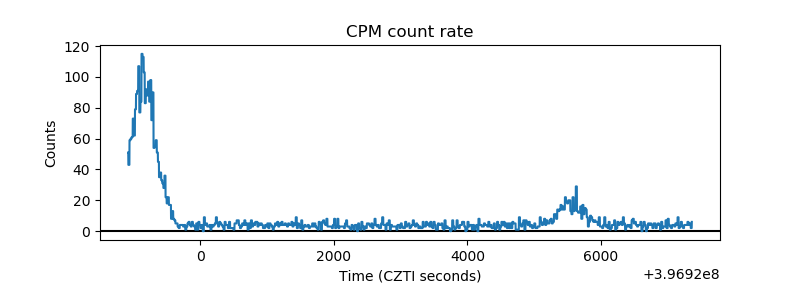 |
| CZT Counter | 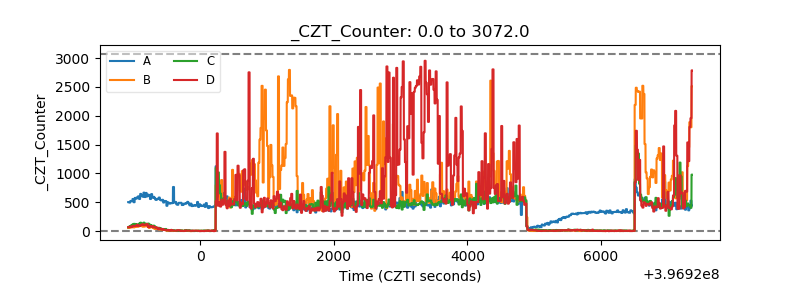 |
| +2.5 Volts monitor | 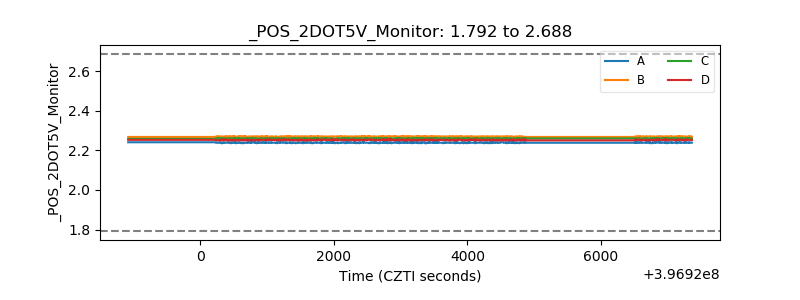 |
| +5 Volts monitor | 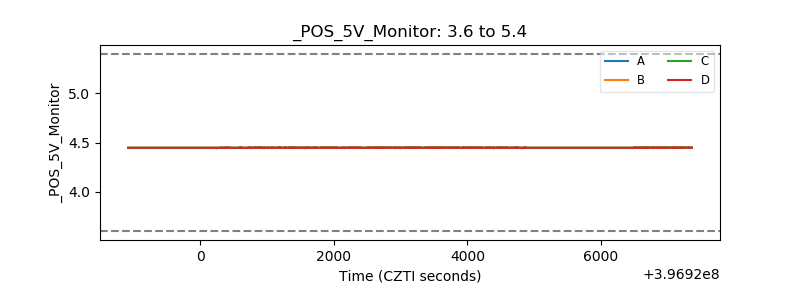 |
| _ROLL_ROT | 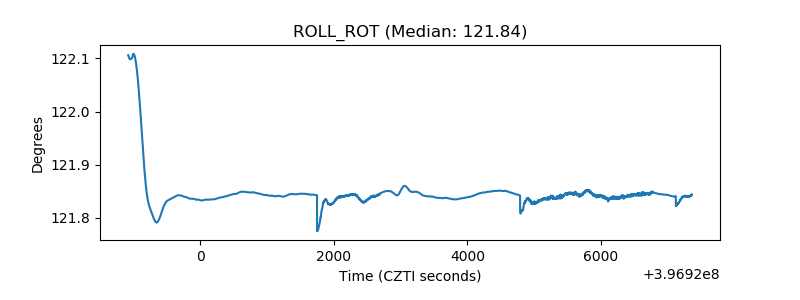 |
| _Roll_DEC | 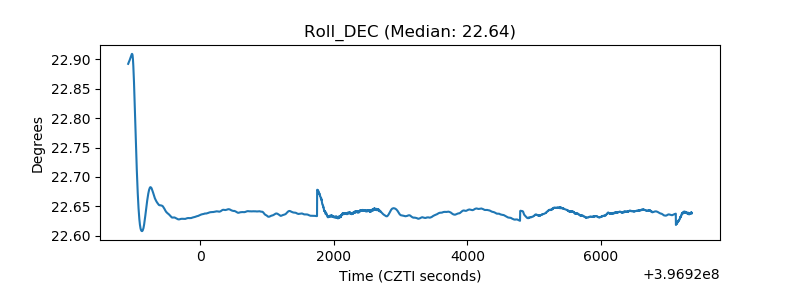 |
| _Roll_RA | 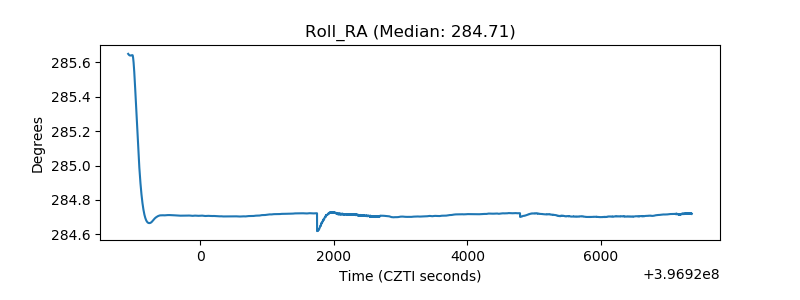 |
| Veto Counter | 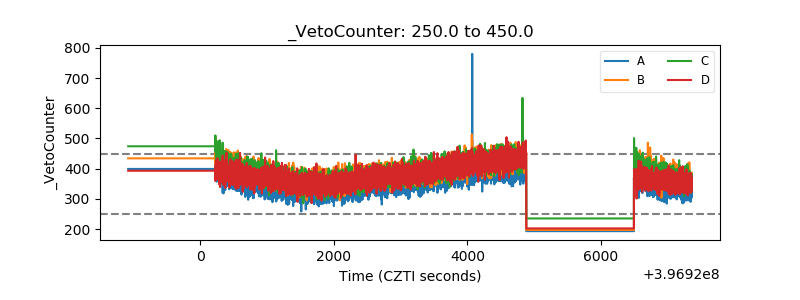 |