| Param | Original file | Final file |
|---|---|---|
| Filename | modeM0/AS1A11_079T01_9000005254_36975cztM0_level2.evt | modeM0/AS1A11_079T01_9000005254_36975cztM0_level2_quad_clean.evt |
| Size (bytes) | 690,301,440 | 74,813,760 |
| Size | 658.3 MB | 71.3 MB |
| Events in quadrant A | 3,048,705 | 472,485 |
| Events in quadrant B | 6,315,259 | 446,751 |
| Events in quadrant C | 3,523,891 | 479,063 |
| Events in quadrant D | 7,593,091 | 427,786 |
| Mode SS | |||
|---|---|---|---|
| Quadrant | BADHDUFLAG | Total packets | Discarded packets |
| A | 0 | 130 | 0 |
| B | 0 | 130 | 0 |
| C | 0 | 130 | 0 |
| D | 0 | 130 | 0 |
| Mode M9 | |||
|---|---|---|---|
| Quadrant | BADHDUFLAG | Total packets | Discarded packets |
| A | 0 | 30 | 0 |
| B | 0 | 30 | 0 |
| C | 0 | 30 | 0 |
| D | 0 | 30 | 0 |
| Mode M0 | |||
|---|---|---|---|
| Quadrant | BADHDUFLAG | Total packets | Discarded packets |
| A | 0 | 12968 | 3 |
| B | 0 | 23267 | 2 |
| C | 0 | 14330 | 2 |
| D | 0 | 26740 | 2 |
| Quadrant | Total seconds | Saturated seconds | Saturation percentage |
|---|---|---|---|
| A | 6286 | 5 | 0.079542% |
| B | 6286 | 688 | 10.944957% |
| C | 6286 | 36 | 0.572701% |
| D | 6286 | 1523 | 24.228444% |
Noise dominated data is calculated using 1-second bins in cleaned event files. If a bin has >2000 counts, and if more than 50% of those come from <1% of pixels, then it is considered to be noise-dominated and hence unusable.
| Quadrant | # 1 sec bins | Bins with >0 counts | Bins with >2000 counts | High rate bins dominated by noise | Noise dominated (total time) | Noise dominated (detector-on time) | Marked lightcurve |
|---|---|---|---|---|---|---|---|
| A | 9272 | 6288 | 1 | 1 | 0.01% | 0.02% | 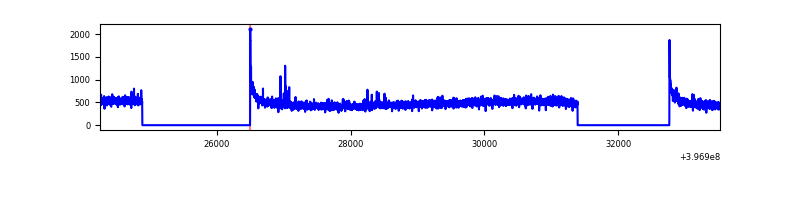 |
| B | 9272 | 6288 | 486 | 486 | 5.24% | 7.73% | 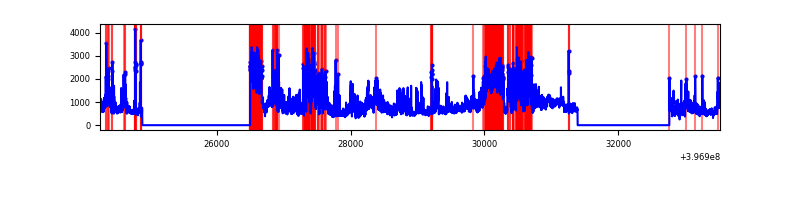 |
| C | 9272 | 6288 | 26 | 26 | 0.28% | 0.41% | 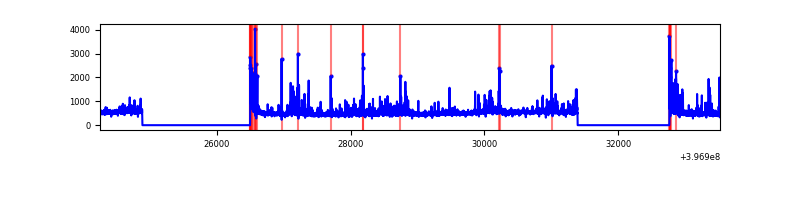 |
| D | 9272 | 6288 | 1418 | 1418 | 15.29% | 22.55% | 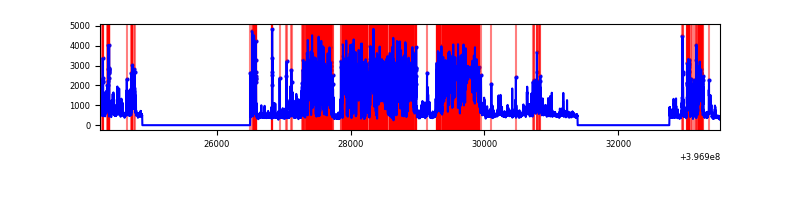 |
Top three noisy pixels from each quadrant. If the there are fewer than three noisy pixels in the level2.evt file, extra rows are filled as -1
| Pixel properties | Quadrant properties | ||||||
|---|---|---|---|---|---|---|---|
| Quadrant | DetID | PixID | Counts | Sigma | Mean | Median | Sigma |
| A | 10 | 83 | 243138 | 1667.86 | 716 | 702 | 145.4 |
| A | 15 | 237 | 13988 | 91.4 | 716 | 702 | 145.4 |
| A | 9 | 143 | 10279 | 65.89 | 716 | 702 | 145.4 |
| B | 5 | 184 | 2692757 | 19929.21 | 692 | 672 | 135.1 |
| B | 0 | 229 | 347530 | 2567.75 | 692 | 672 | 135.1 |
| B | 4 | 81 | 174841 | 1289.35 | 692 | 672 | 135.1 |
| C | 15 | 214 | 268375 | 1625.25 | 704 | 709 | 164.7 |
| C | 0 | 10 | 224830 | 1360.85 | 704 | 709 | 164.7 |
| C | 0 | 207 | 129589 | 782.55 | 704 | 709 | 164.7 |
| D | 12 | 17 | 3880946 | 25123.92 | 624 | 607 | 154.4 |
| D | 2 | 250 | 874491 | 5658.11 | 624 | 607 | 154.4 |
| D | 10 | 253 | 223002 | 1439.93 | 624 | 607 | 154.4 |
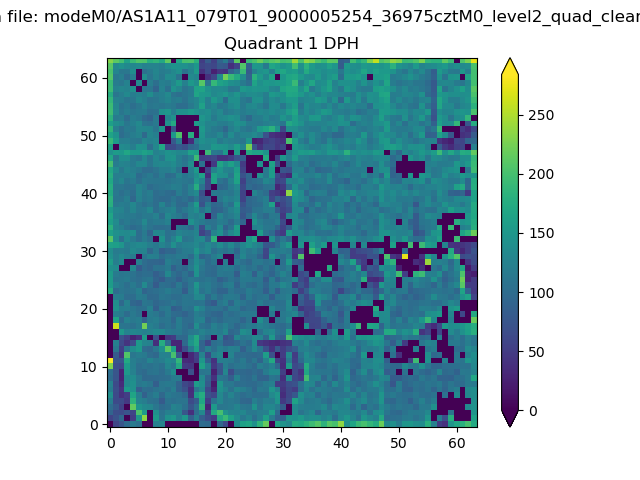
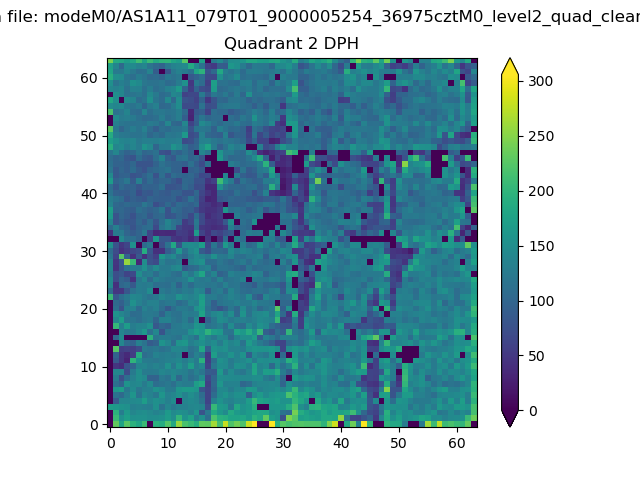
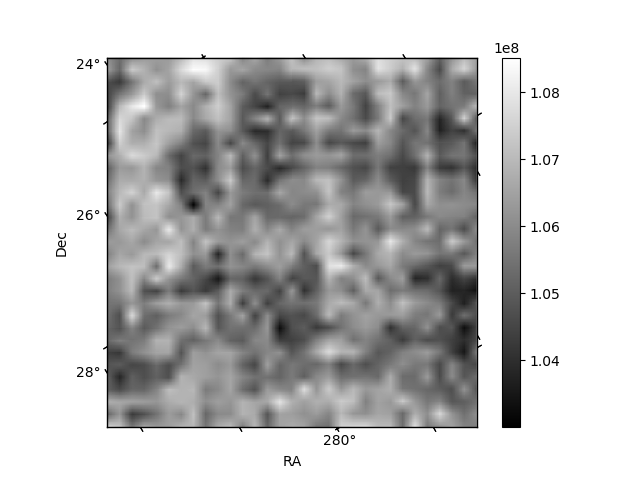
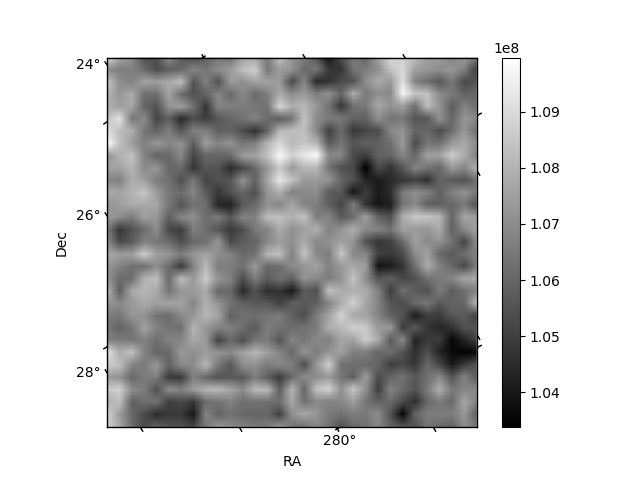
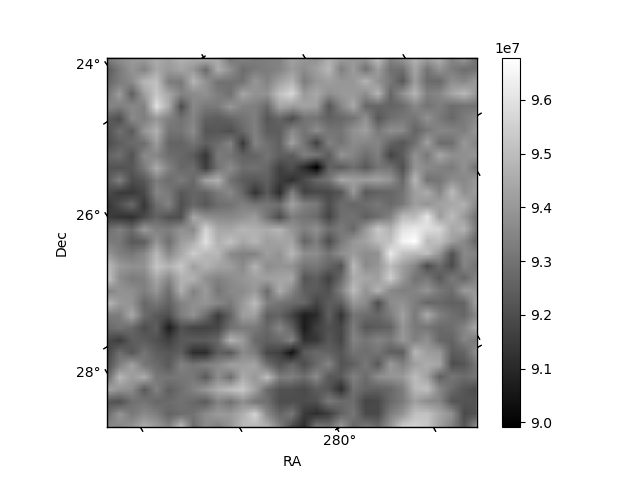
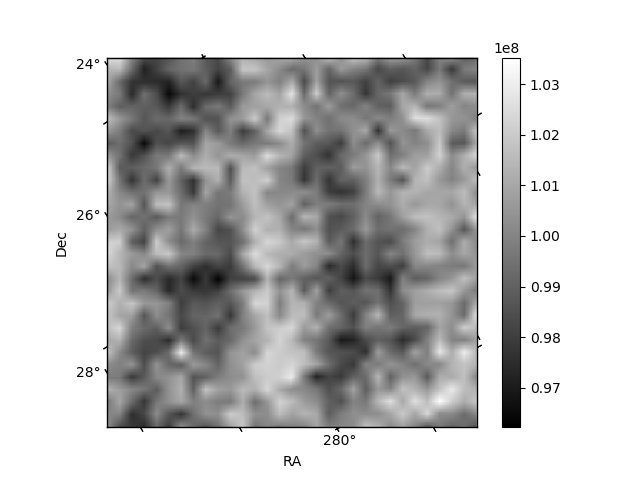
Histogram calculated using DETX and DETY for each event in the final _common_clean file
| Quadrant A |  |
 |
Quadrant B |
|---|---|---|---|
| Quadrant D | 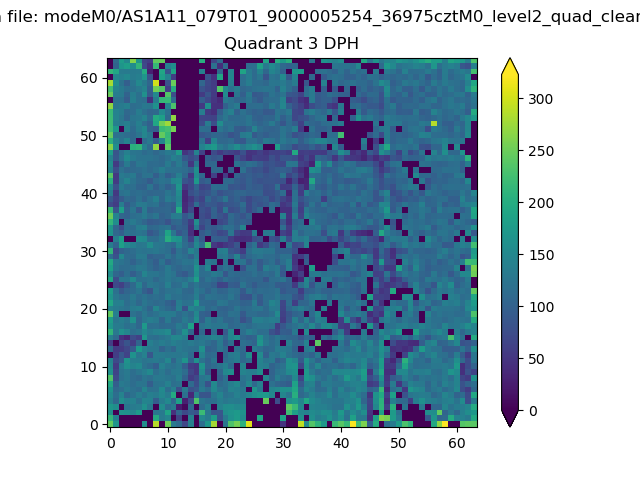 |
 |
Quadrant C |
| Plot type | Count rate plots | Images |
|---|---|---|
| Comparison with Poisson distribution Blue bars denote a histogram of data divided into 1 sec bins. Red curve is a Poisson curve with rate = median count rate of data. |
 |
 |
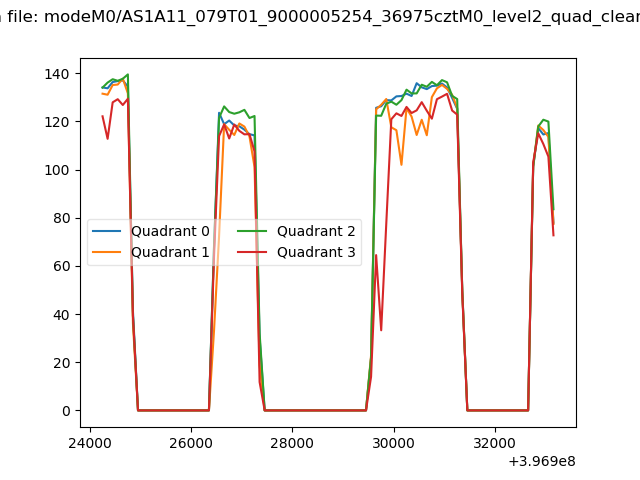
| Quadrant-wise count rates Data is divided into 100 sec bins |
 |
|
| Module-wise count rates for Quadrant A Data is divided into 100 sec bins |
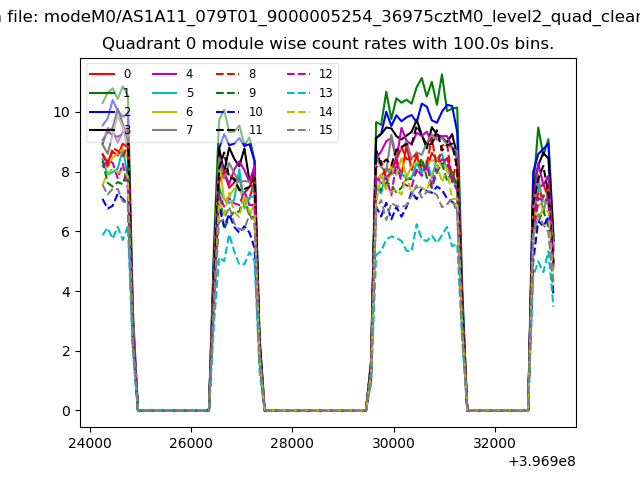 |
 |
| Module-wise count rates for Quadrant B Data is divided into 100 sec bins |
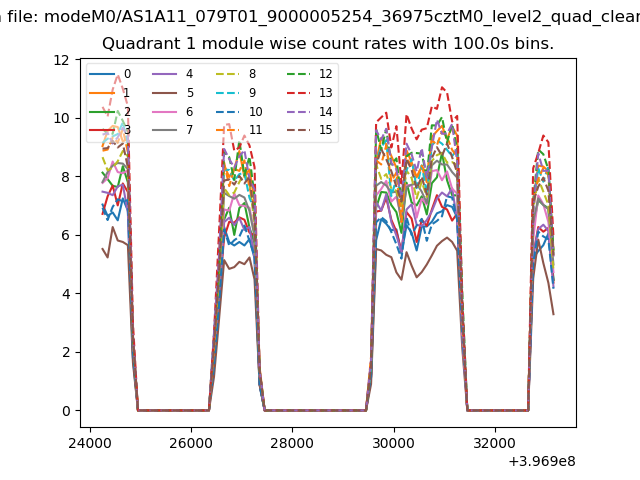 |
 |
| Module-wise count rates for Quadrant C Data is divided into 100 sec bins |
 |
 |
| Module-wise count rates for Quadrant D Data is divided into 100 sec bins |
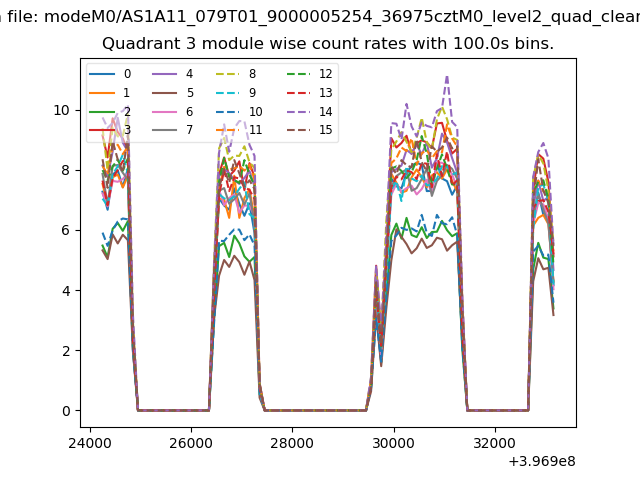 |
 |
| Parameter | Plot |
|---|---|
| CZT HV Monitor | 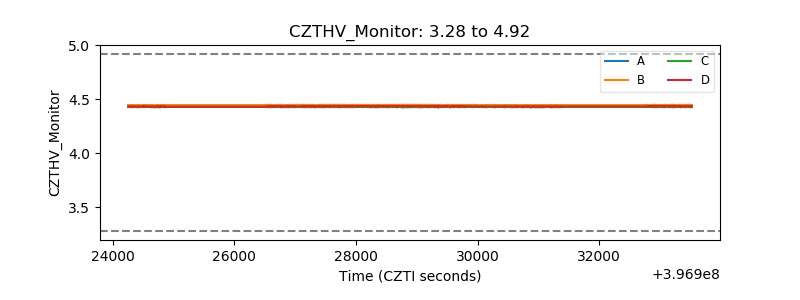 |
| D_VDD | 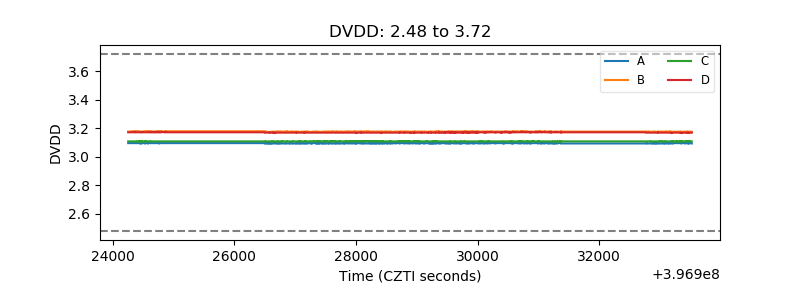 |
| Temperature 1 | 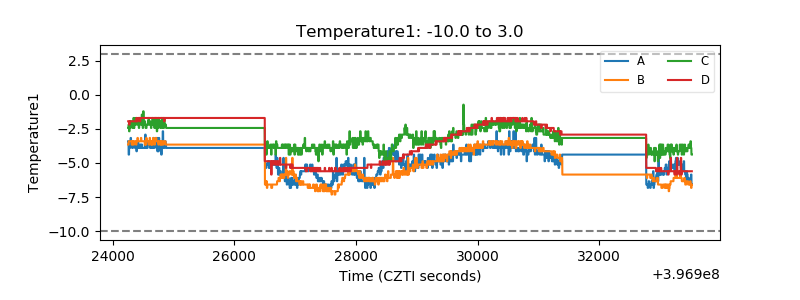 |
| Veto HV Monitor | 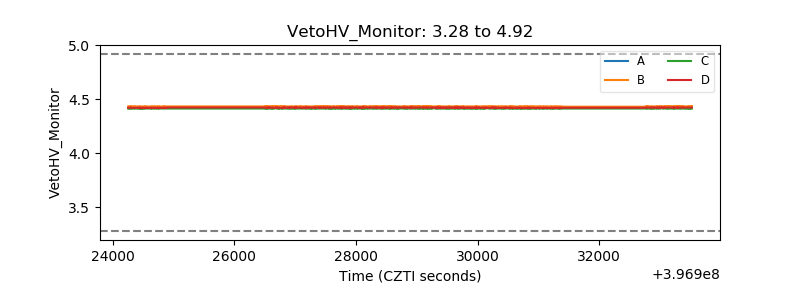 |
| Veto LLD | 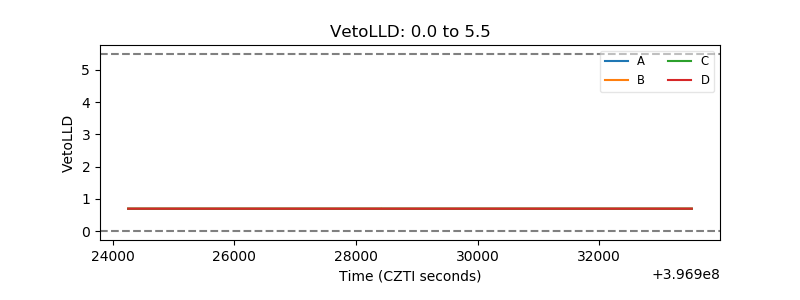 |
| Alpha Counter |  |
| _CPM_Rate | 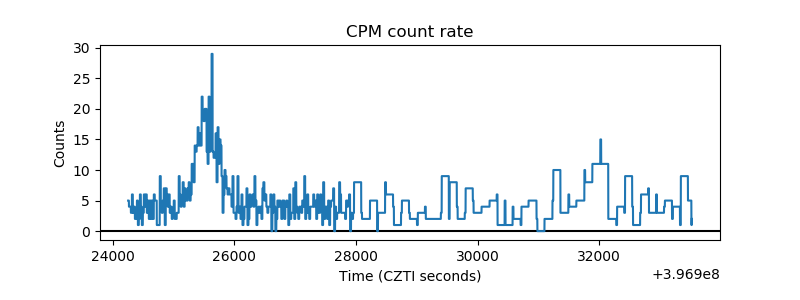 |
| CZT Counter | 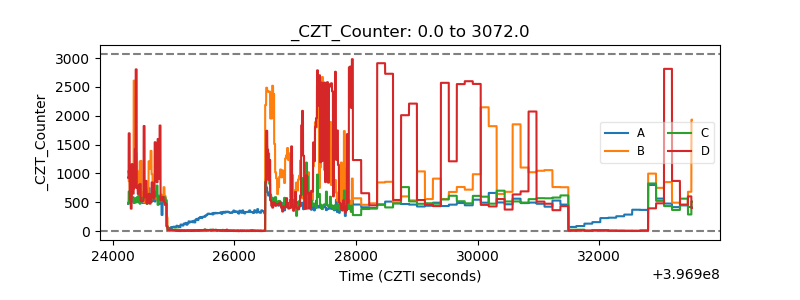 |
| +2.5 Volts monitor | 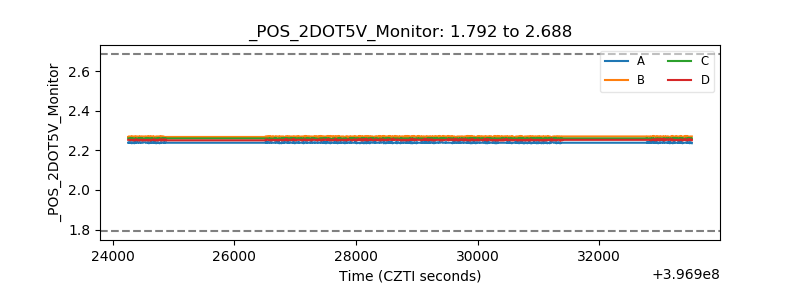 |
| +5 Volts monitor |  |
| _ROLL_ROT | 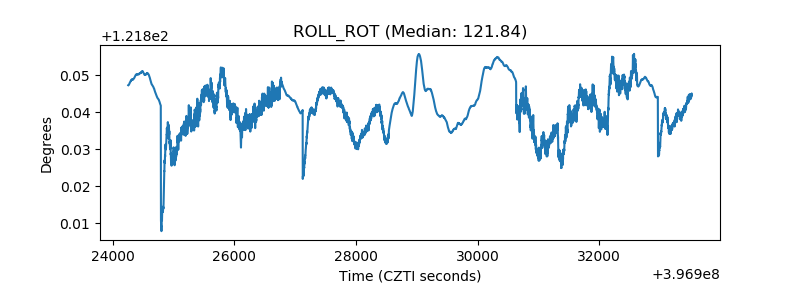 |
| _Roll_DEC | 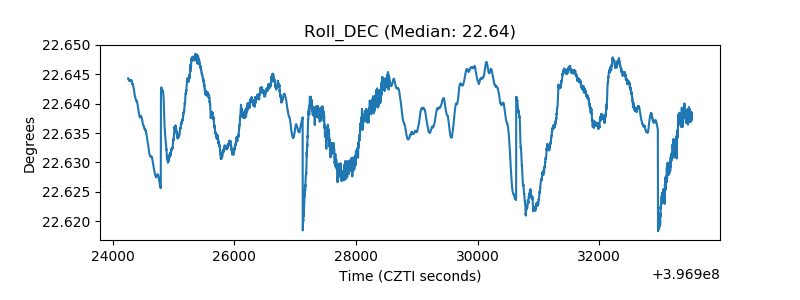 |
| _Roll_RA |  |
| Veto Counter | 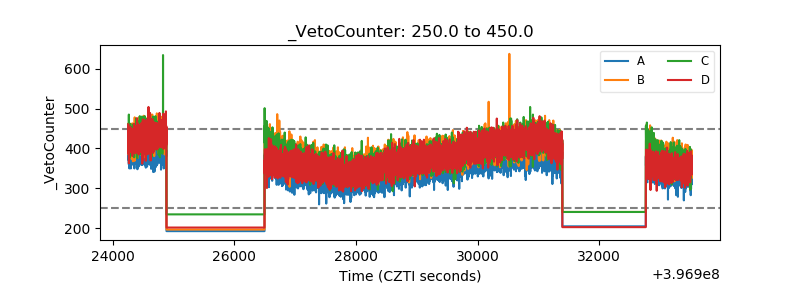 |