| Param | Original file | Final file |
|---|---|---|
| Filename | modeM0/AS1A11_079T01_9000005254_36976cztM0_level2.evt | modeM0/AS1A11_079T01_9000005254_36976cztM0_level2_quad_clean.evt |
| Size (bytes) | 614,787,840 | 73,667,520 |
| Size | 586.3 MB | 70.3 MB |
| Events in quadrant A | 3,209,090 | 447,148 |
| Events in quadrant B | 6,281,107 | 443,696 |
| Events in quadrant C | 4,015,421 | 448,653 |
| Events in quadrant D | 4,661,443 | 425,342 |
| Mode SS | |||
|---|---|---|---|
| Quadrant | BADHDUFLAG | Total packets | Discarded packets |
| A | 0 | 138 | 0 |
| B | 0 | 138 | 0 |
| C | 0 | 138 | 0 |
| D | 0 | 138 | 0 |
| Mode M9 | |||
|---|---|---|---|
| Quadrant | BADHDUFLAG | Total packets | Discarded packets |
| A | 0 | 27 | 0 |
| B | 0 | 27 | 0 |
| C | 0 | 27 | 0 |
| D | 0 | 27 | 0 |
| Mode M0 | |||
|---|---|---|---|
| Quadrant | BADHDUFLAG | Total packets | Discarded packets |
| A | 0 | 13692 | 3 |
| B | 0 | 23297 | 2 |
| C | 0 | 16097 | 2 |
| D | 0 | 18416 | 2 |
| Quadrant | Total seconds | Saturated seconds | Saturation percentage |
|---|---|---|---|
| A | 6679 | 10 | 0.149723% |
| B | 6679 | 378 | 5.659530% |
| C | 6679 | 52 | 0.778560% |
| D | 6679 | 358 | 5.360084% |
Noise dominated data is calculated using 1-second bins in cleaned event files. If a bin has >2000 counts, and if more than 50% of those come from <1% of pixels, then it is considered to be noise-dominated and hence unusable.
| Quadrant | # 1 sec bins | Bins with >0 counts | Bins with >2000 counts | High rate bins dominated by noise | Noise dominated (total time) | Noise dominated (detector-on time) | Marked lightcurve |
|---|---|---|---|---|---|---|---|
| A | 9365 | 6681 | 1 | 1 | 0.01% | 0.01% | 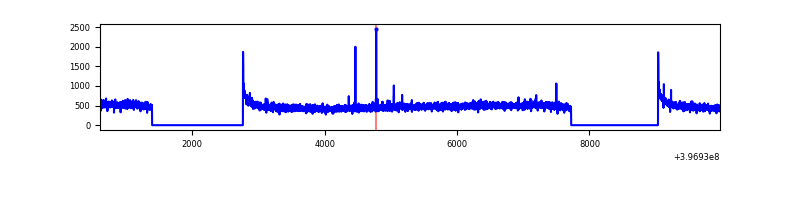 |
| B | 9365 | 6681 | 208 | 208 | 2.22% | 3.11% | 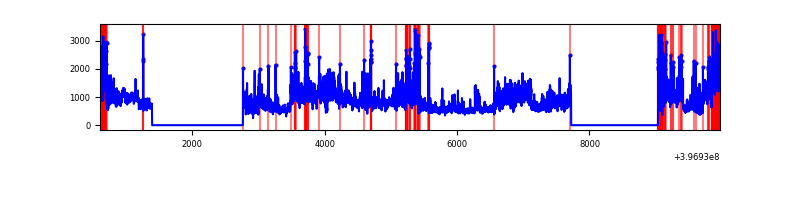 |
| C | 9365 | 6681 | 39 | 39 | 0.42% | 0.58% | 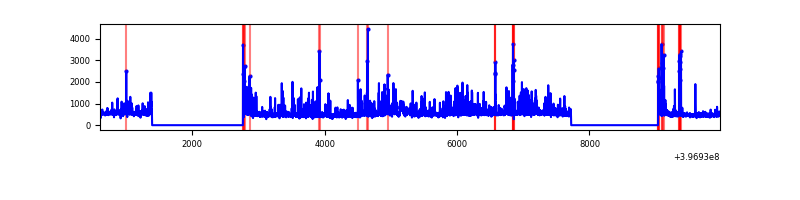 |
| D | 9365 | 6681 | 351 | 351 | 3.75% | 5.25% | 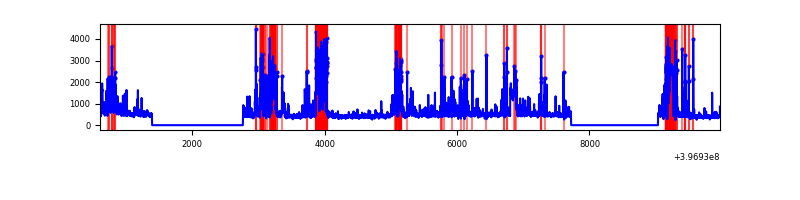 |
Top three noisy pixels from each quadrant. If the there are fewer than three noisy pixels in the level2.evt file, extra rows are filled as -1
| Pixel properties | Quadrant properties | ||||||
|---|---|---|---|---|---|---|---|
| Quadrant | DetID | PixID | Counts | Sigma | Mean | Median | Sigma |
| A | 10 | 83 | 251490 | 1623.12 | 759 | 743 | 154.5 |
| A | 9 | 143 | 13844 | 84.8 | 759 | 743 | 154.5 |
| A | 13 | 254 | 8704 | 51.53 | 759 | 743 | 154.5 |
| B | 5 | 184 | 2777830 | 19316.79 | 744 | 725 | 143.8 |
| B | 4 | 81 | 199506 | 1382.66 | 744 | 725 | 143.8 |
| B | 0 | 221 | 121336 | 838.93 | 744 | 725 | 143.8 |
| C | 0 | 10 | 449274 | 2550.17 | 746 | 752 | 175.9 |
| C | 15 | 214 | 283477 | 1607.49 | 746 | 752 | 175.9 |
| C | 0 | 207 | 199424 | 1129.59 | 746 | 752 | 175.9 |
| D | 12 | 17 | 1045557 | 5782.02 | 733 | 713 | 180.7 |
| D | 10 | 253 | 318393 | 1758.0 | 733 | 713 | 180.7 |
| D | 2 | 250 | 235814 | 1301.02 | 733 | 713 | 180.7 |
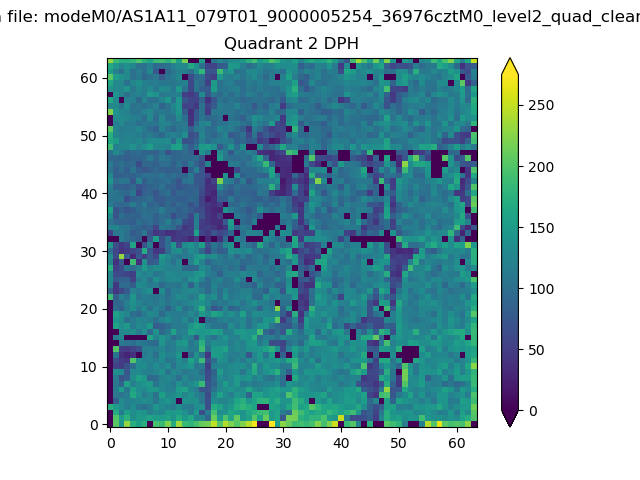
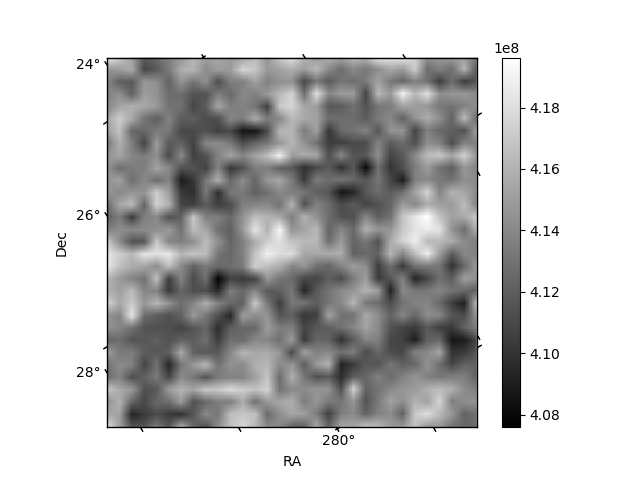
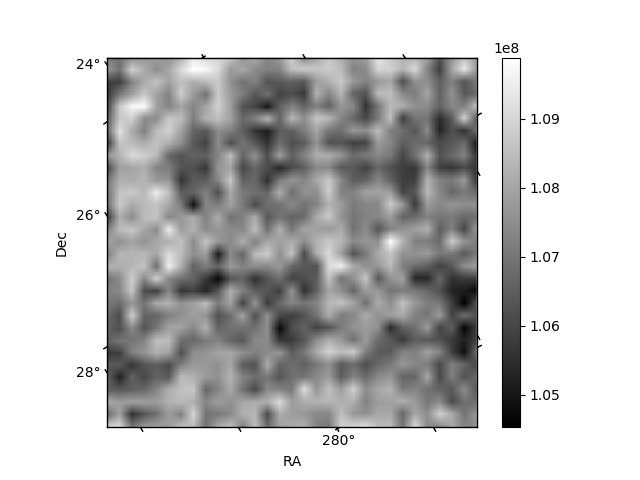
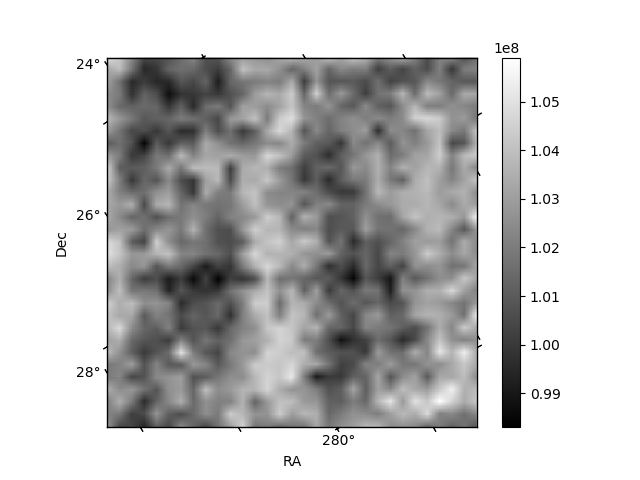
Histogram calculated using DETX and DETY for each event in the final _common_clean file
| Quadrant A | 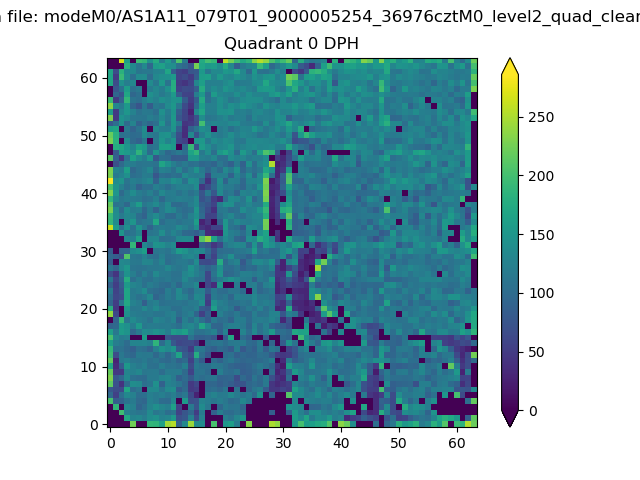 |
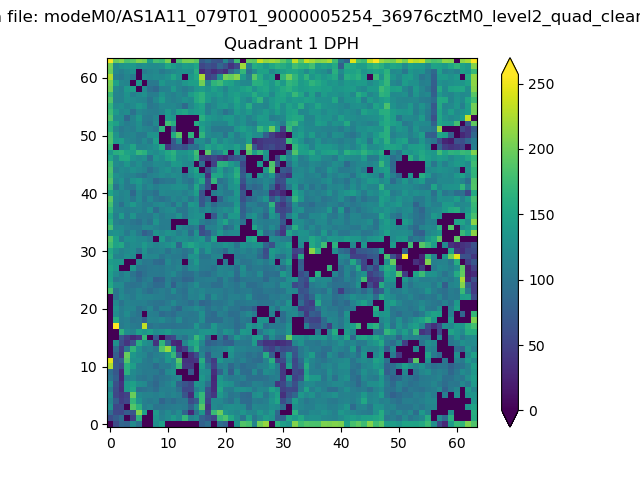 |
Quadrant B |
|---|---|---|---|
| Quadrant D | 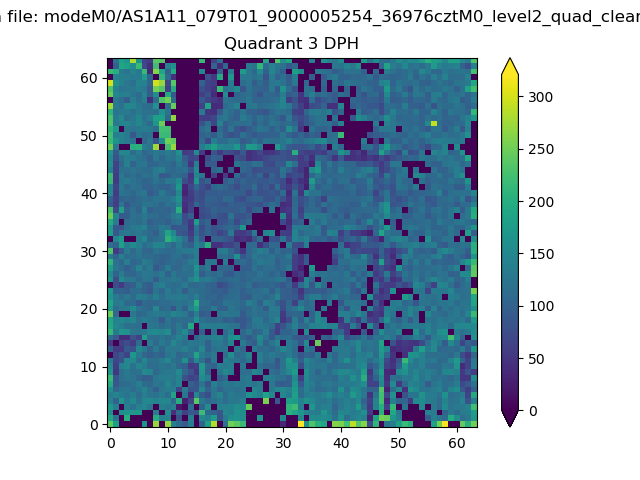 |
 |
Quadrant C |
| Plot type | Count rate plots | Images |
|---|---|---|
| Comparison with Poisson distribution Blue bars denote a histogram of data divided into 1 sec bins. Red curve is a Poisson curve with rate = median count rate of data. |
 |
 |
| Quadrant-wise count rates Data is divided into 100 sec bins |
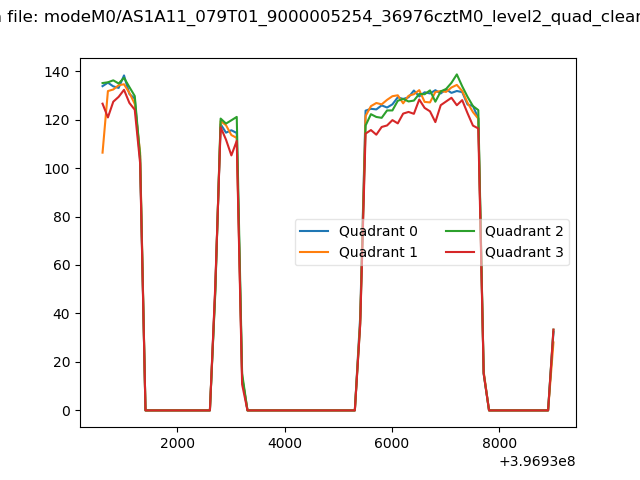 |
|
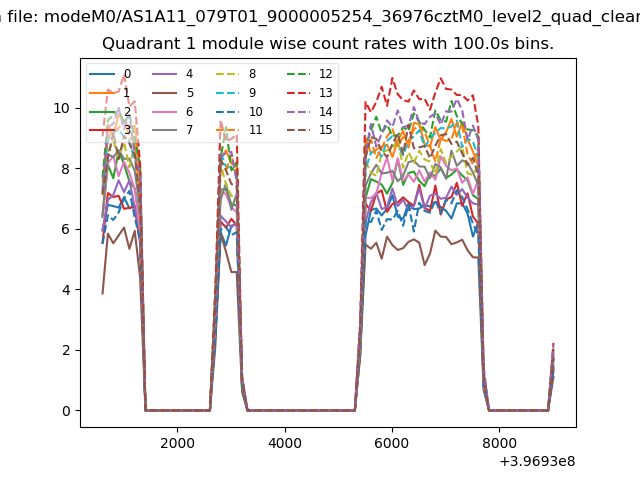
| Module-wise count rates for Quadrant A Data is divided into 100 sec bins |
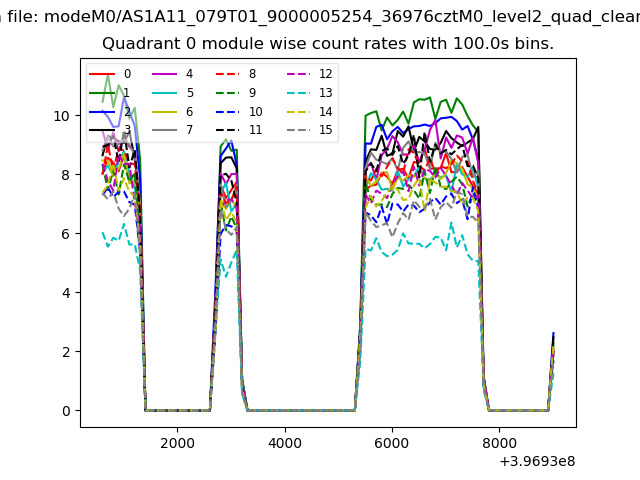 |
 |
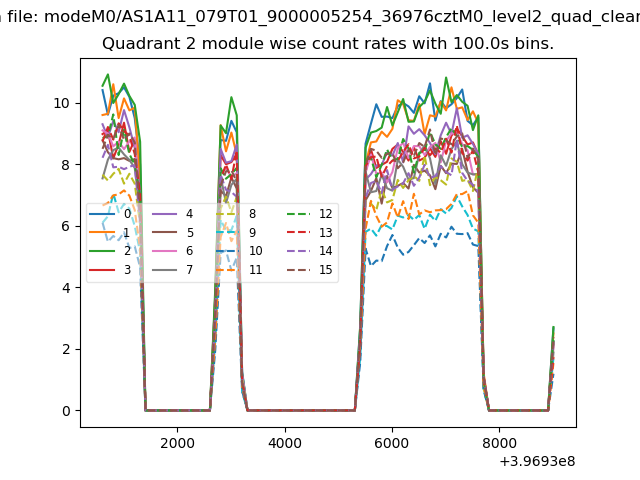
| Module-wise count rates for Quadrant B Data is divided into 100 sec bins |
 |
 |
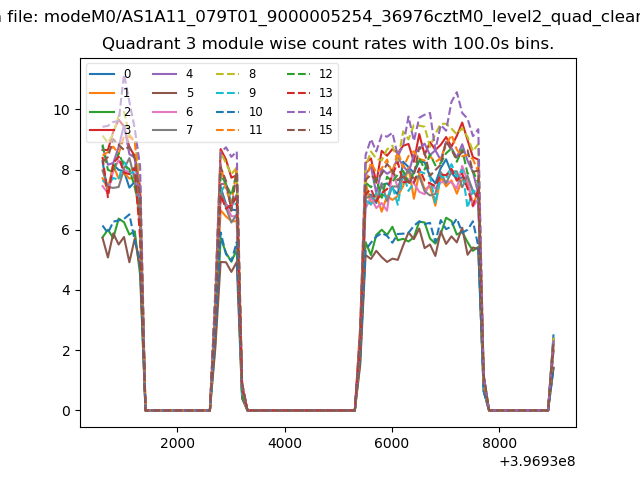
| Module-wise count rates for Quadrant C Data is divided into 100 sec bins |
 |
 |
| Module-wise count rates for Quadrant D Data is divided into 100 sec bins |
 |
 |
| Parameter | Plot |
|---|---|
| CZT HV Monitor | 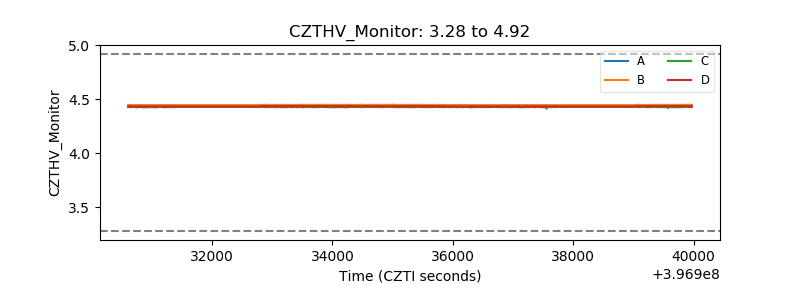 |
| D_VDD |  |
| Temperature 1 | 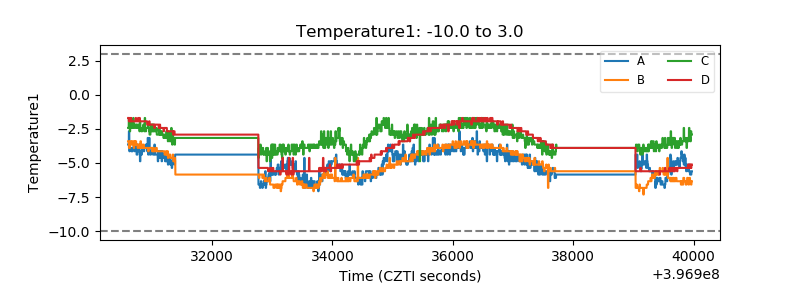 |
| Veto HV Monitor | 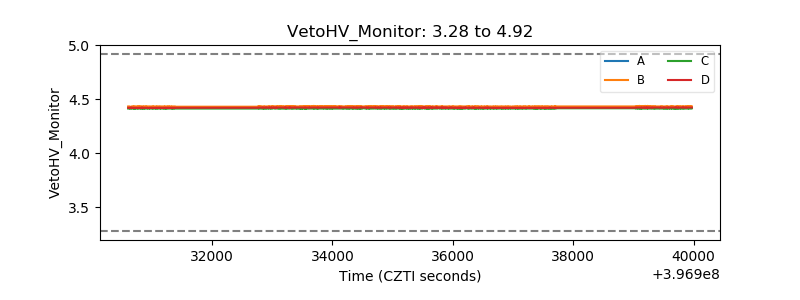 |
| Veto LLD | 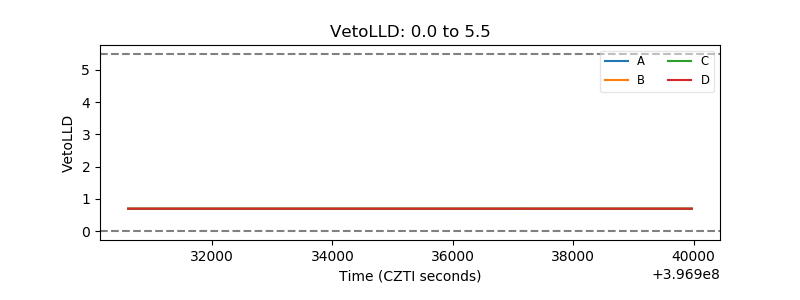 |
| Alpha Counter | 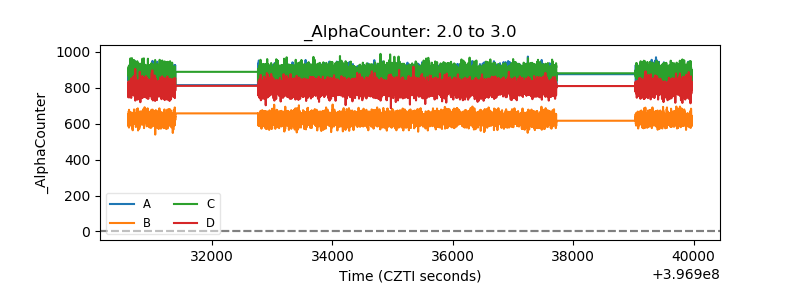 |
| _CPM_Rate | 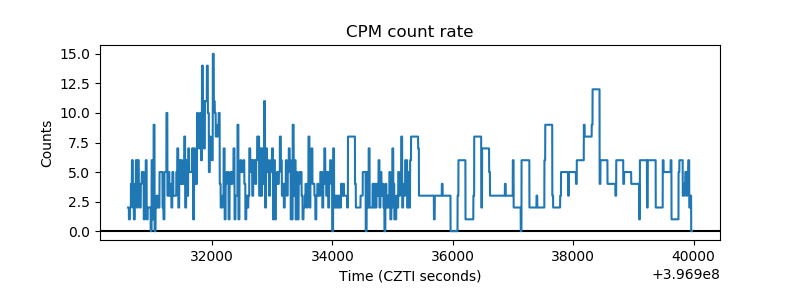 |
| CZT Counter | 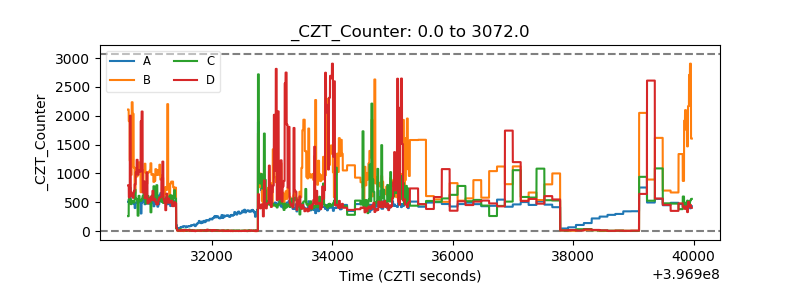 |
| +2.5 Volts monitor | 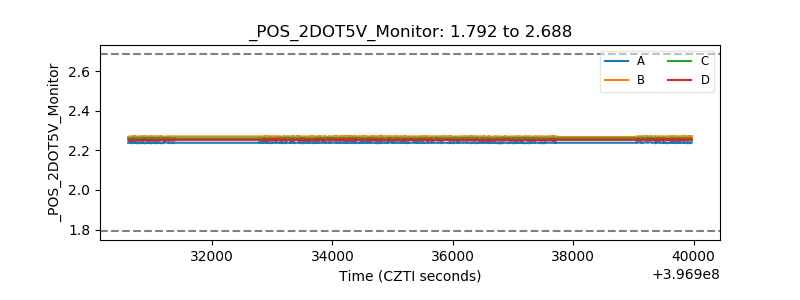 |
| +5 Volts monitor | 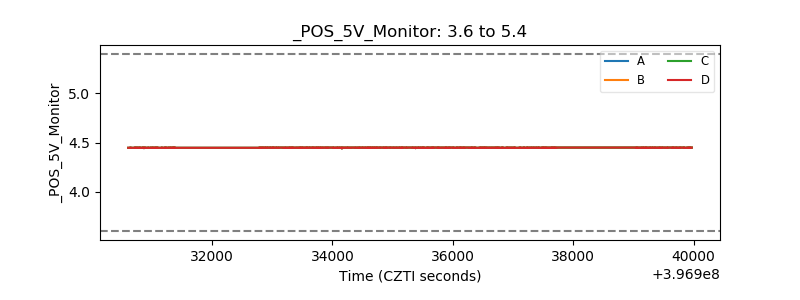 |
| _ROLL_ROT | 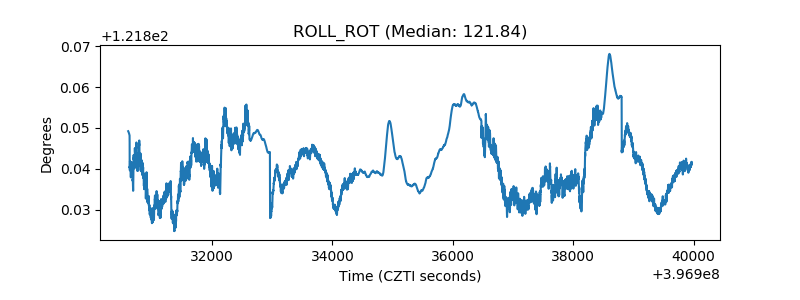 |
| _Roll_DEC | 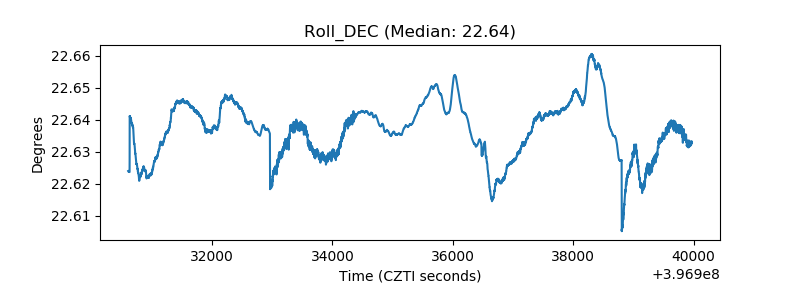 |
| _Roll_RA | 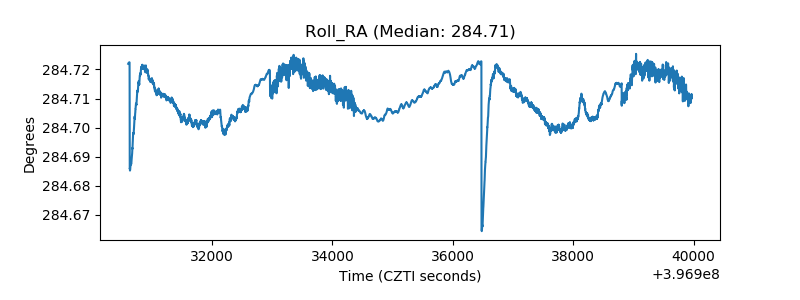 |
| Veto Counter | 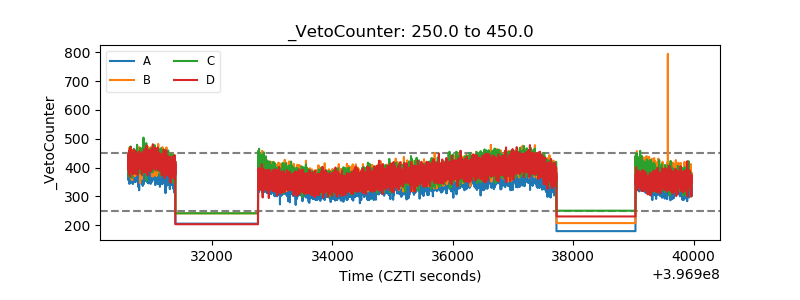 |