| Param | Original file | Final file |
|---|---|---|
| Filename | modeM0/AS1A11_079T01_9000005254_36978cztM0_level2.evt | modeM0/AS1A11_079T01_9000005254_36978cztM0_level2_quad_clean.evt |
| Size (bytes) | 1,090,255,680 | 117,547,200 |
| Size | 1.0 GB | 112.1 MB |
| Events in quadrant A | 5,221,296 | 727,748 |
| Events in quadrant B | 12,269,191 | 681,532 |
| Events in quadrant C | 5,707,807 | 728,397 |
| Events in quadrant D | 9,083,674 | 664,979 |
| Mode SS | |||
|---|---|---|---|
| Quadrant | BADHDUFLAG | Total packets | Discarded packets |
| A | 0 | 226 | 0 |
| B | 0 | 226 | 0 |
| C | 0 | 226 | 0 |
| D | 0 | 226 | 0 |
| Mode M9 | |||
|---|---|---|---|
| Quadrant | BADHDUFLAG | Total packets | Discarded packets |
| A | 0 | 40 | 0 |
| B | 0 | 40 | 0 |
| C | 0 | 40 | 0 |
| D | 0 | 40 | 0 |
| Mode M0 | |||
|---|---|---|---|
| Quadrant | BADHDUFLAG | Total packets | Discarded packets |
| A | 0 | 22416 | 4 |
| B | 0 | 43813 | 3 |
| C | 0 | 23420 | 3 |
| D | 0 | 34512 | 3 |
| Quadrant | Total seconds | Saturated seconds | Saturation percentage |
|---|---|---|---|
| A | 10918 | 14 | 0.128229% |
| B | 10918 | 1989 | 18.217622% |
| C | 10918 | 59 | 0.540392% |
| D | 10918 | 1259 | 11.531416% |
Noise dominated data is calculated using 1-second bins in cleaned event files. If a bin has >2000 counts, and if more than 50% of those come from <1% of pixels, then it is considered to be noise-dominated and hence unusable.
| Quadrant | # 1 sec bins | Bins with >0 counts | Bins with >2000 counts | High rate bins dominated by noise | Noise dominated (total time) | Noise dominated (detector-on time) | Marked lightcurve |
|---|---|---|---|---|---|---|---|
| A | 15007 | 10921 | 1 | 1 | 0.01% | 0.01% | 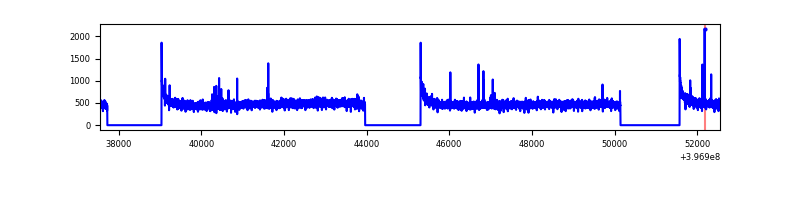 |
| B | 15007 | 10921 | 1596 | 1596 | 10.64% | 14.61% | 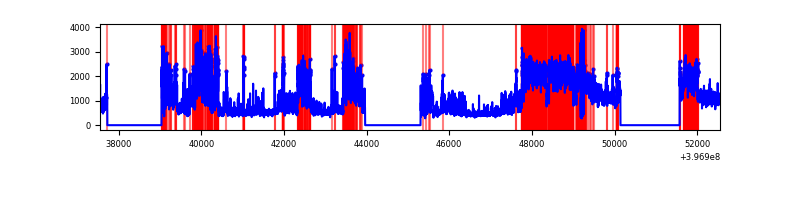 |
| C | 15007 | 10921 | 46 | 46 | 0.31% | 0.42% | 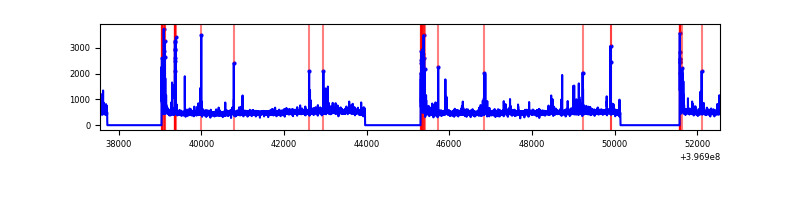 |
| D | 15006 | 10920 | 1169 | 1169 | 7.79% | 10.71% | 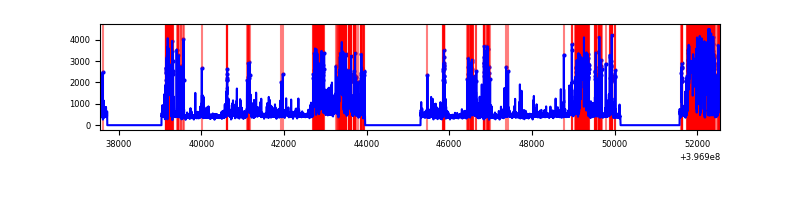 |
Top three noisy pixels from each quadrant. If the there are fewer than three noisy pixels in the level2.evt file, extra rows are filled as -1
| Pixel properties | Quadrant properties | ||||||
|---|---|---|---|---|---|---|---|
| Quadrant | DetID | PixID | Counts | Sigma | Mean | Median | Sigma |
| A | 10 | 83 | 386543 | 1547.82 | 1236 | 1209 | 249.0 |
| A | 9 | 143 | 38203 | 148.6 | 1236 | 1209 | 249.0 |
| A | 13 | 254 | 14096 | 51.76 | 1236 | 1209 | 249.0 |
| B | 5 | 184 | 6933869 | 30523.67 | 1185 | 1153 | 227.1 |
| B | 4 | 81 | 330661 | 1450.77 | 1185 | 1153 | 227.1 |
| B | 0 | 221 | 162296 | 709.49 | 1185 | 1153 | 227.1 |
| C | 15 | 214 | 463952 | 1647.78 | 1210 | 1218 | 280.8 |
| C | 0 | 10 | 318746 | 1130.71 | 1210 | 1218 | 280.8 |
| C | 14 | 254 | 119273 | 420.39 | 1210 | 1218 | 280.8 |
| D | 12 | 17 | 3042611 | 10883.71 | 1142 | 1111 | 279.5 |
| D | 13 | 171 | 725030 | 2590.47 | 1142 | 1111 | 279.5 |
| D | 2 | 250 | 414916 | 1480.76 | 1142 | 1111 | 279.5 |
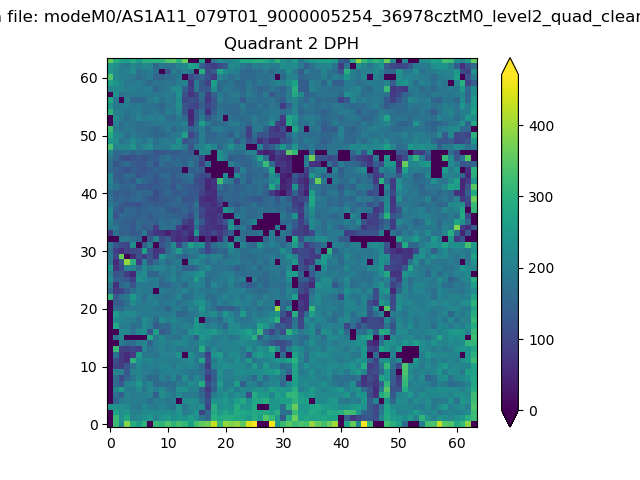
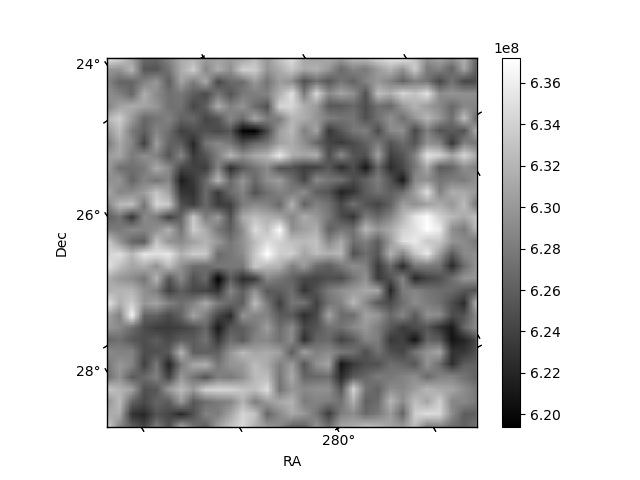
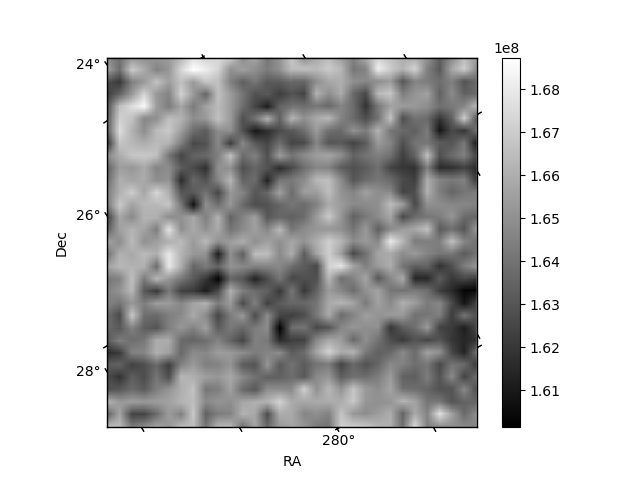
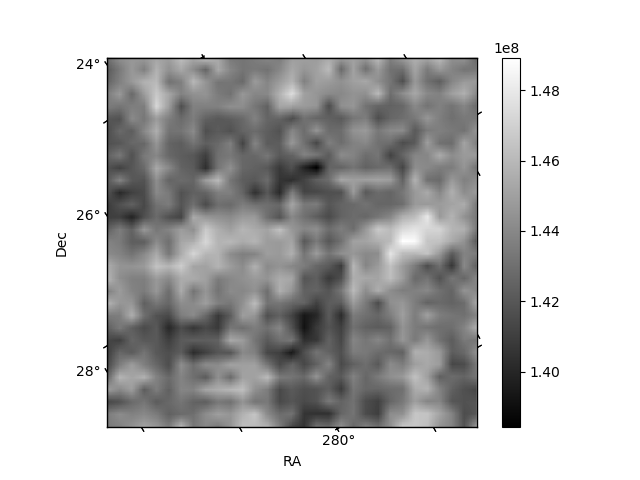
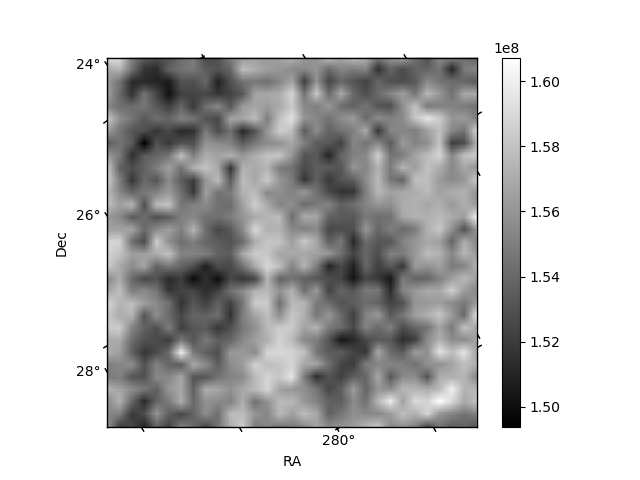
Histogram calculated using DETX and DETY for each event in the final _common_clean file
| Quadrant A | 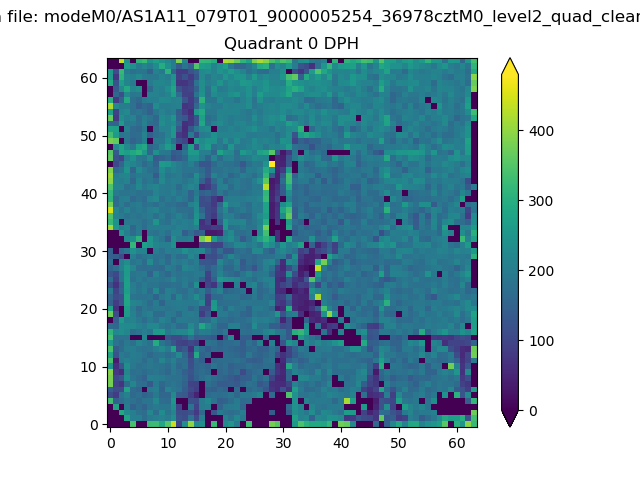 |
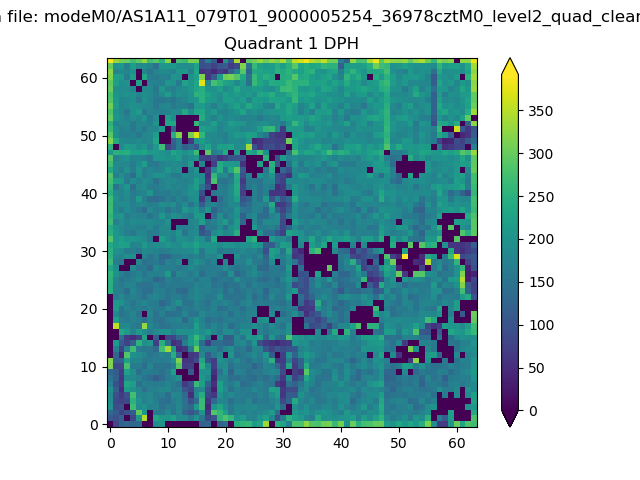 |
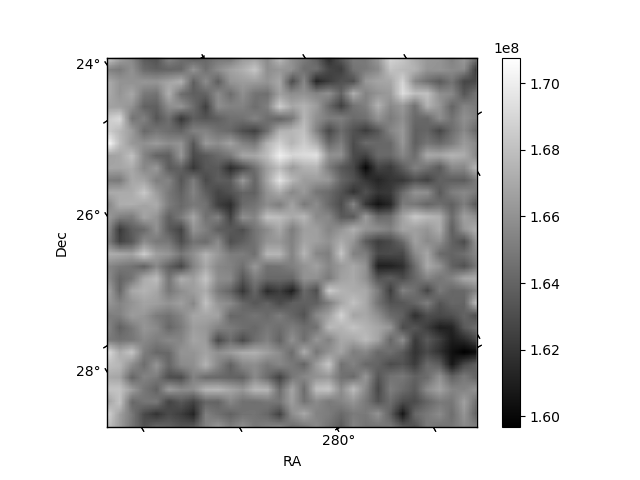
Quadrant B |
|---|---|---|---|
| Quadrant D | 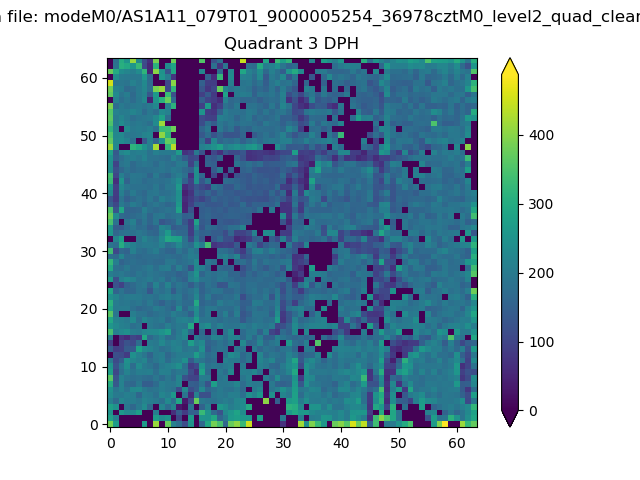 |
 |
Quadrant C |
| Plot type | Count rate plots | Images |
|---|---|---|
| Comparison with Poisson distribution Blue bars denote a histogram of data divided into 1 sec bins. Red curve is a Poisson curve with rate = median count rate of data. |
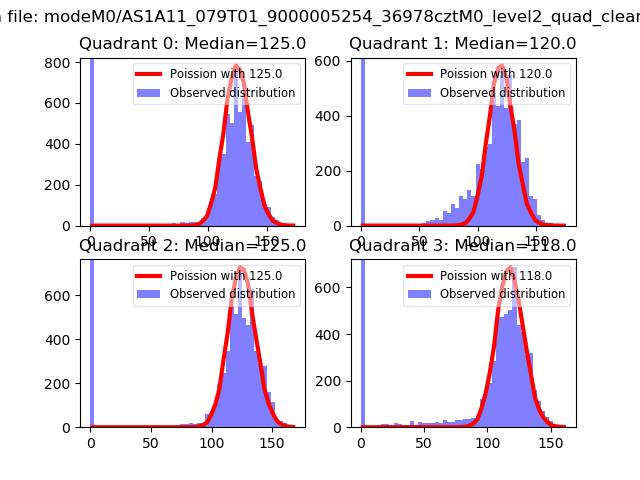 |
 |
| Quadrant-wise count rates Data is divided into 100 sec bins |
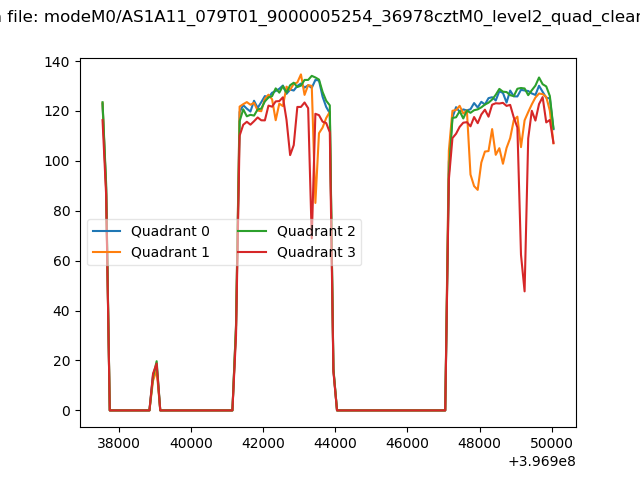 |
|
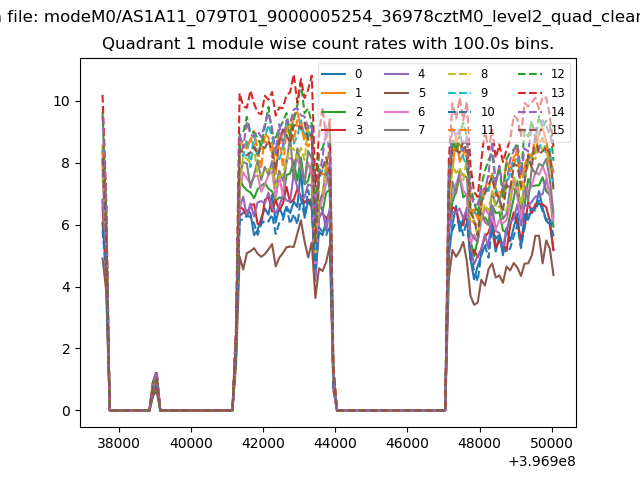
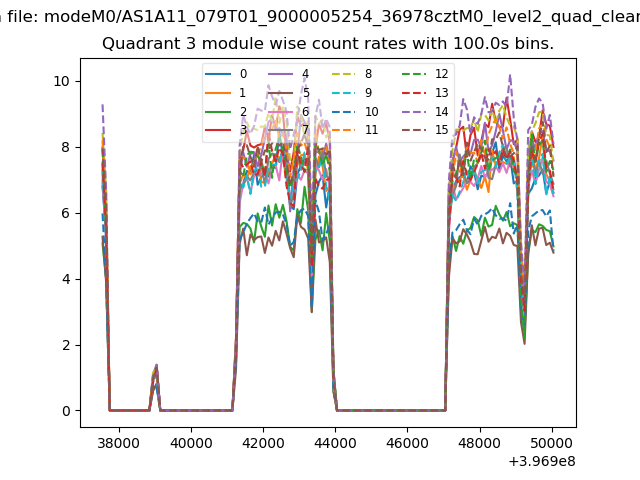
| Module-wise count rates for Quadrant A Data is divided into 100 sec bins |
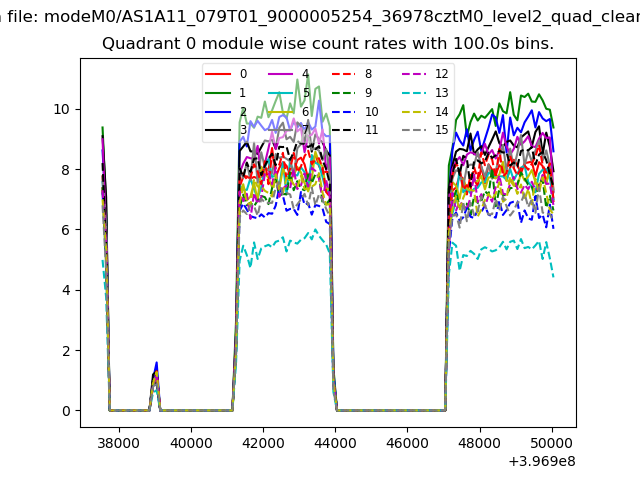 |
 |
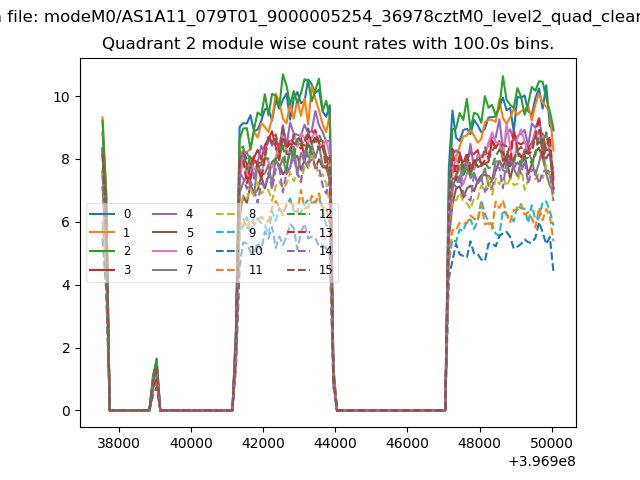
| Module-wise count rates for Quadrant B Data is divided into 100 sec bins |
 |
 |
| Module-wise count rates for Quadrant C Data is divided into 100 sec bins |
 |
 |
| Module-wise count rates for Quadrant D Data is divided into 100 sec bins |
 |
 |
| Parameter | Plot |
|---|---|
| CZT HV Monitor | 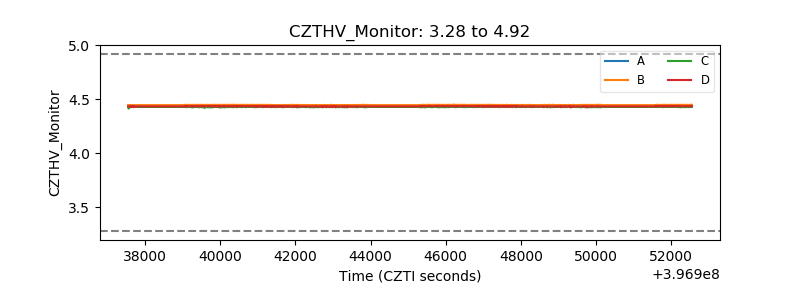 |
| D_VDD | 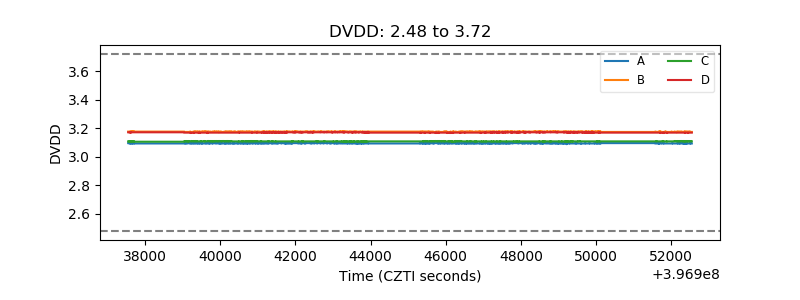 |
| Temperature 1 | 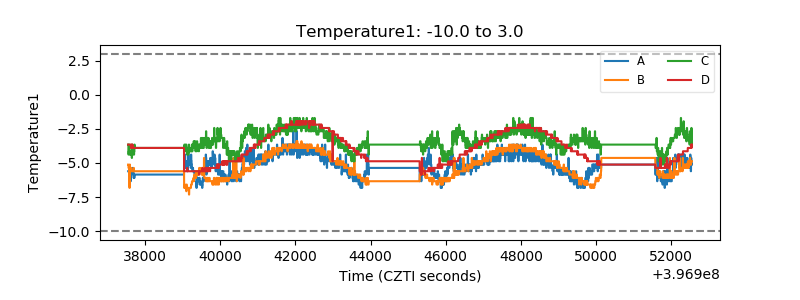 |
| Veto HV Monitor | 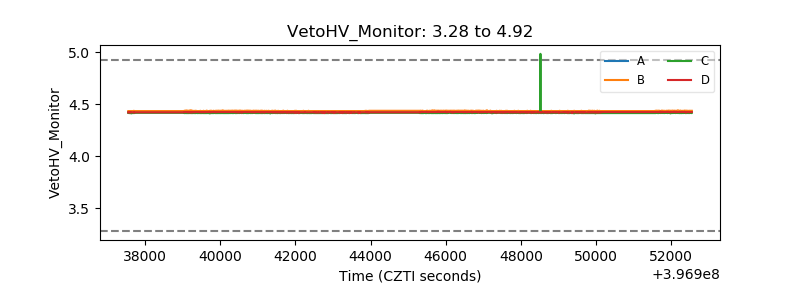 |
| Veto LLD | 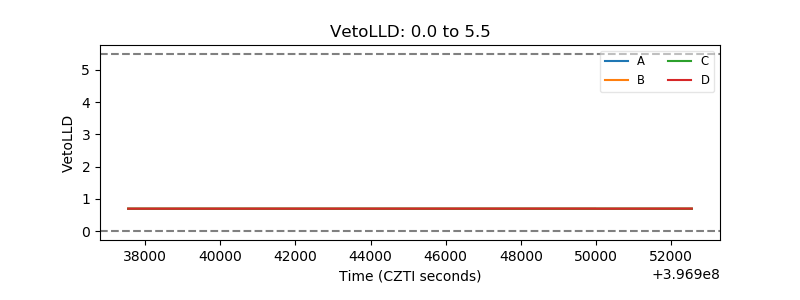 |
| Alpha Counter | 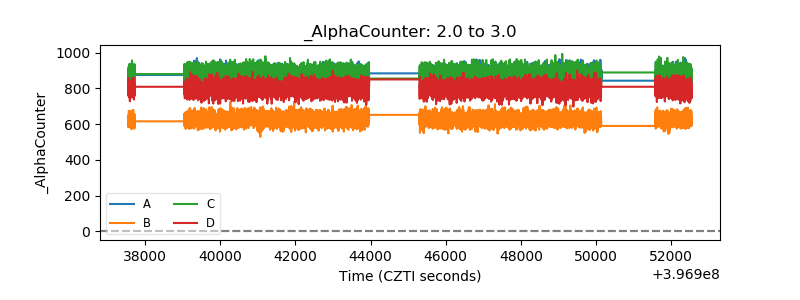 |
| _CPM_Rate | 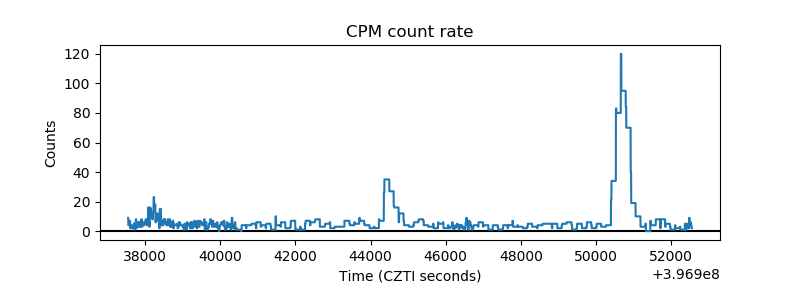 |
| CZT Counter | 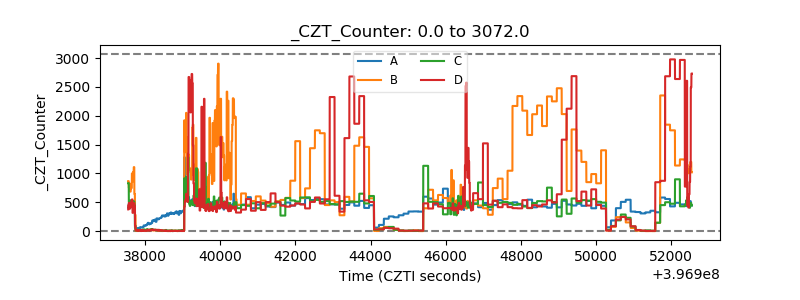 |
| +2.5 Volts monitor | 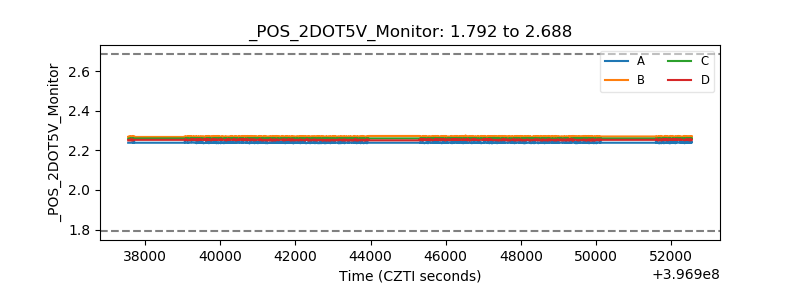 |
| +5 Volts monitor | 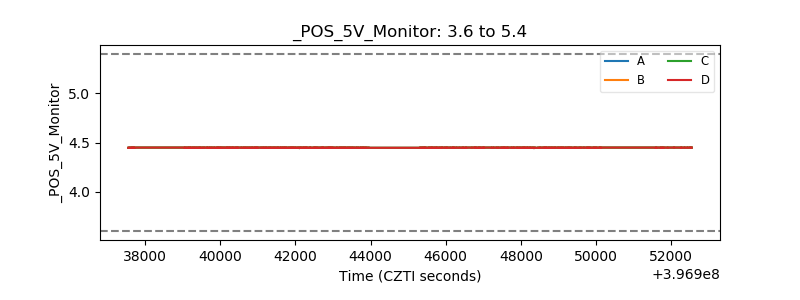 |
| _ROLL_ROT | 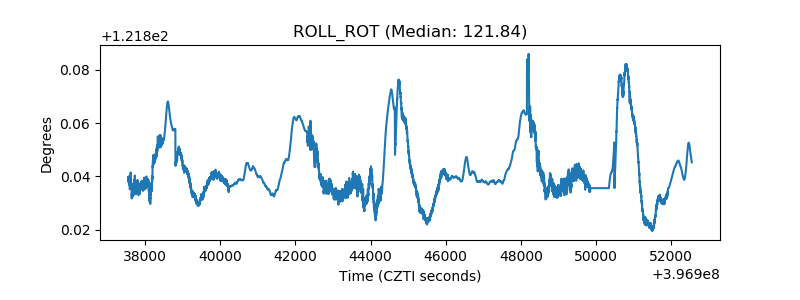 |
| _Roll_DEC | 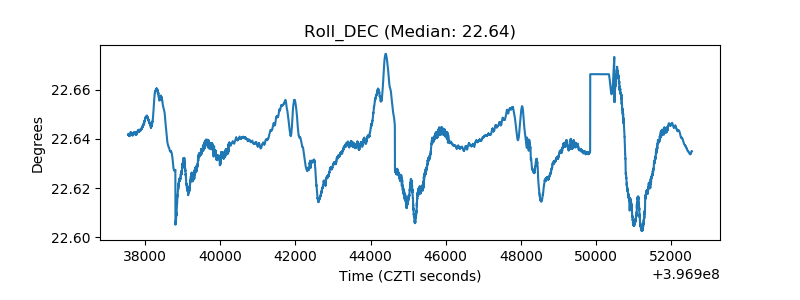 |
| _Roll_RA | 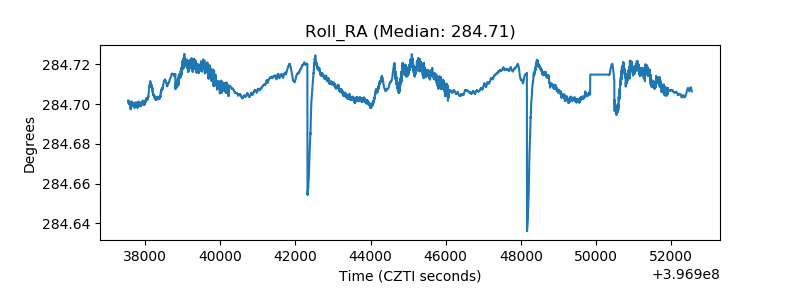 |
| Veto Counter | 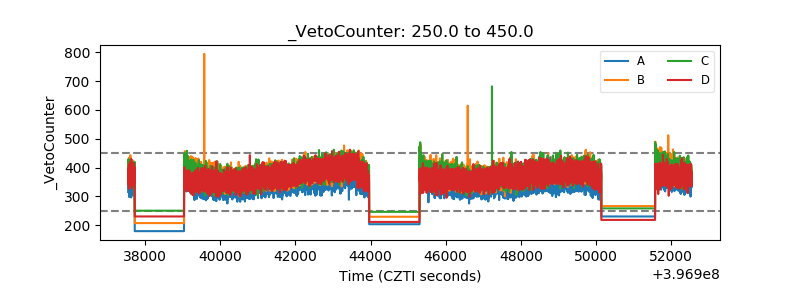 |