| Param | Original file | Final file |
|---|---|---|
| Filename | modeM0/AS1A11_079T01_9000005254_36979cztM0_level2.evt | modeM0/AS1A11_079T01_9000005254_36979cztM0_level2_quad_clean.evt |
| Size (bytes) | 1,570,844,160 | 176,633,280 |
| Size | 1.5 GB | 168.5 MB |
| Events in quadrant A | 7,284,656 | 1,122,206 |
| Events in quadrant B | 19,477,781 | 1,032,409 |
| Events in quadrant C | 7,807,825 | 1,125,117 |
| Events in quadrant D | 11,973,948 | 1,013,708 |
| Mode SS | |||
|---|---|---|---|
| Quadrant | BADHDUFLAG | Total packets | Discarded packets |
| A | 0 | 314 | 0 |
| B | 0 | 314 | 0 |
| C | 0 | 314 | 0 |
| D | 0 | 314 | 0 |
| Mode M9 | |||
|---|---|---|---|
| Quadrant | BADHDUFLAG | Total packets | Discarded packets |
| A | 0 | 42 | 0 |
| B | 0 | 42 | 0 |
| C | 0 | 42 | 0 |
| D | 0 | 42 | 0 |
| Mode M0 | |||
|---|---|---|---|
| Quadrant | BADHDUFLAG | Total packets | Discarded packets |
| A | 0 | 31323 | 4 |
| B | 0 | 68277 | 3 |
| C | 0 | 32190 | 3 |
| D | 0 | 46082 | 3 |
| Quadrant | Total seconds | Saturated seconds | Saturation percentage |
|---|---|---|---|
| A | 15275 | 25 | 0.163666% |
| B | 15275 | 3584 | 23.463175% |
| C | 15275 | 59 | 0.386252% |
| D | 15275 | 1542 | 10.094926% |
Noise dominated data is calculated using 1-second bins in cleaned event files. If a bin has >2000 counts, and if more than 50% of those come from <1% of pixels, then it is considered to be noise-dominated and hence unusable.
| Quadrant | # 1 sec bins | Bins with >0 counts | Bins with >2000 counts | High rate bins dominated by noise | Noise dominated (total time) | Noise dominated (detector-on time) | Marked lightcurve |
|---|---|---|---|---|---|---|---|
| A | 19574 | 15278 | 4 | 4 | 0.02% | 0.03% | 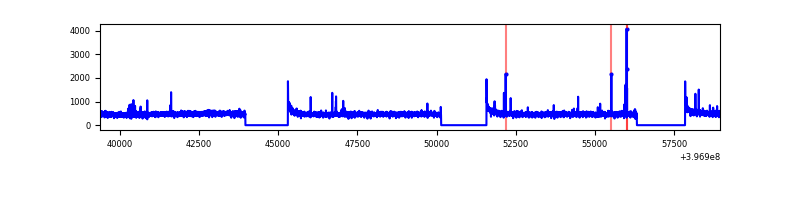 |
| B | 19574 | 15278 | 2884 | 2884 | 14.73% | 18.88% | 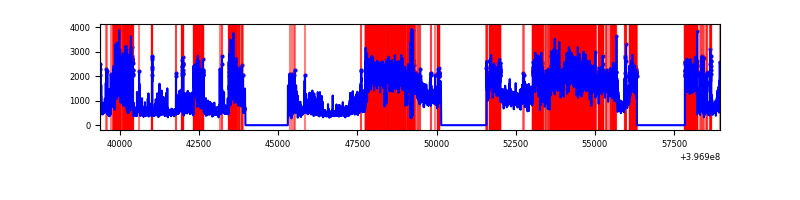 |
| C | 19574 | 15278 | 43 | 43 | 0.22% | 0.28% | 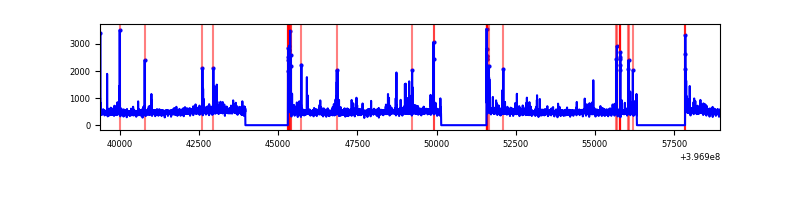 |
| D | 19574 | 15278 | 1435 | 1435 | 7.33% | 9.39% | 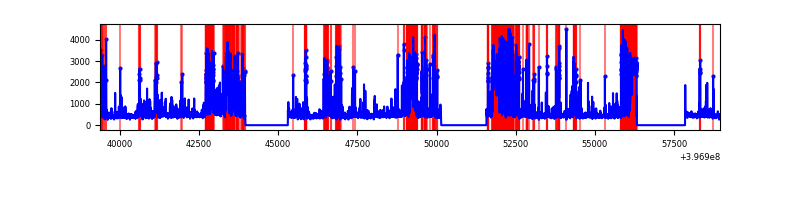 |
Top three noisy pixels from each quadrant. If the there are fewer than three noisy pixels in the level2.evt file, extra rows are filled as -1
| Pixel properties | Quadrant properties | ||||||
|---|---|---|---|---|---|---|---|
| Quadrant | DetID | PixID | Counts | Sigma | Mean | Median | Sigma |
| A | 10 | 83 | 473062 | 1346.87 | 1740 | 1703 | 350.0 |
| A | 9 | 143 | 72259 | 201.61 | 1740 | 1703 | 350.0 |
| A | 13 | 254 | 19360 | 50.45 | 1740 | 1703 | 350.0 |
| B | 5 | 184 | 11861681 | 37842.21 | 1649 | 1605 | 313.4 |
| B | 4 | 81 | 646033 | 2056.19 | 1649 | 1605 | 313.4 |
| B | 0 | 221 | 216566 | 685.88 | 1649 | 1605 | 313.4 |
| C | 15 | 214 | 643958 | 1621.11 | 1701 | 1713 | 396.2 |
| C | 0 | 10 | 293826 | 737.33 | 1701 | 1713 | 396.2 |
| C | 14 | 254 | 169855 | 424.41 | 1701 | 1713 | 396.2 |
| D | 12 | 17 | 4247138 | 10766.43 | 1614 | 1567 | 394.3 |
| D | 13 | 171 | 725579 | 1836.04 | 1614 | 1567 | 394.3 |
| D | 2 | 250 | 431194 | 1089.5 | 1614 | 1567 | 394.3 |
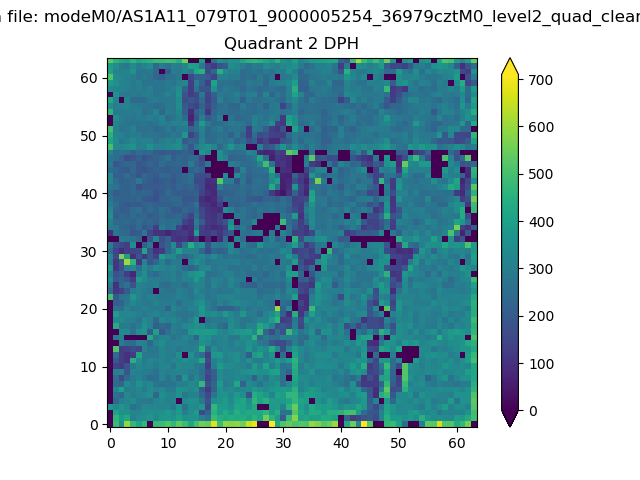
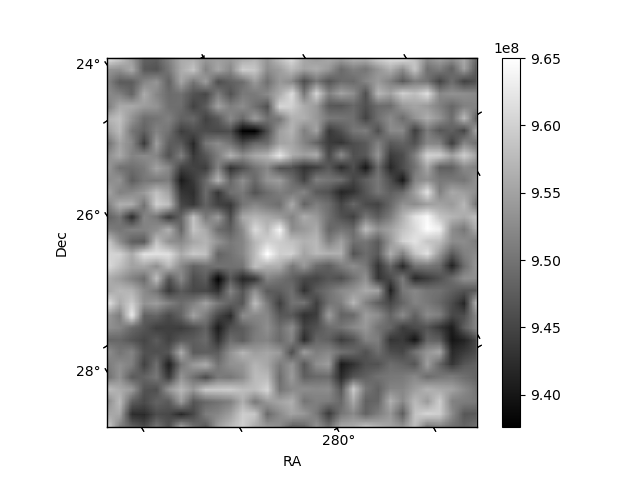
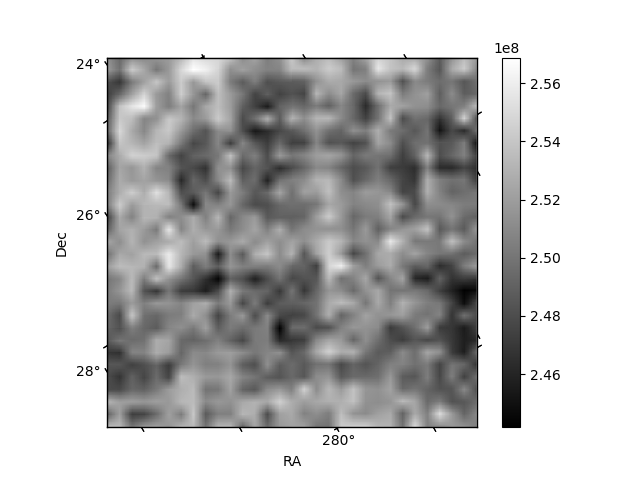
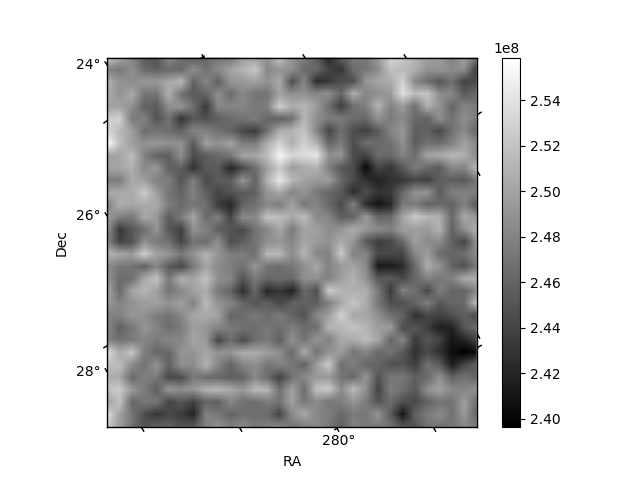
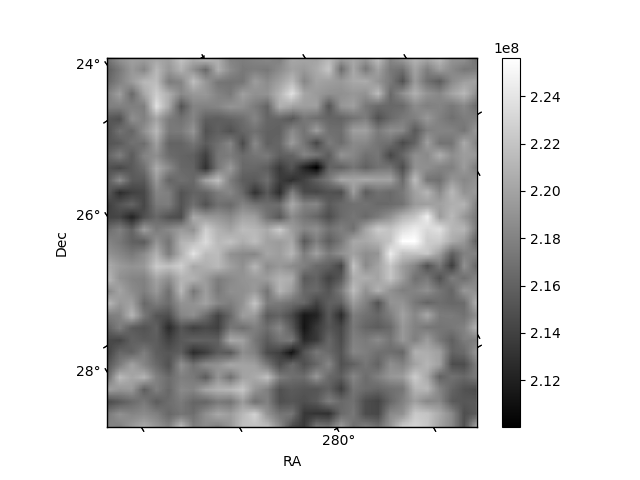
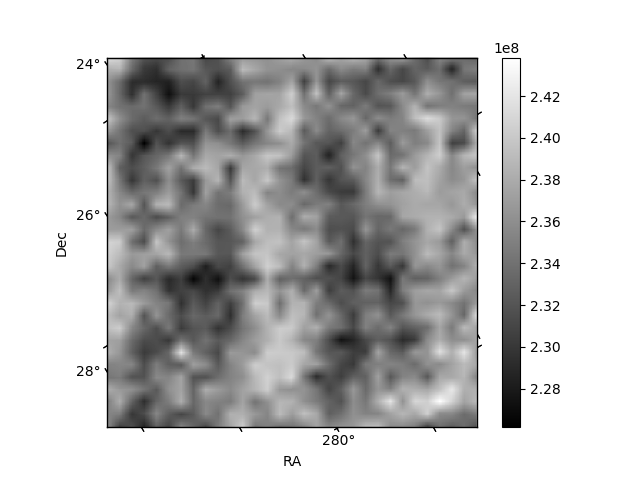
Histogram calculated using DETX and DETY for each event in the final _common_clean file
| Quadrant A | 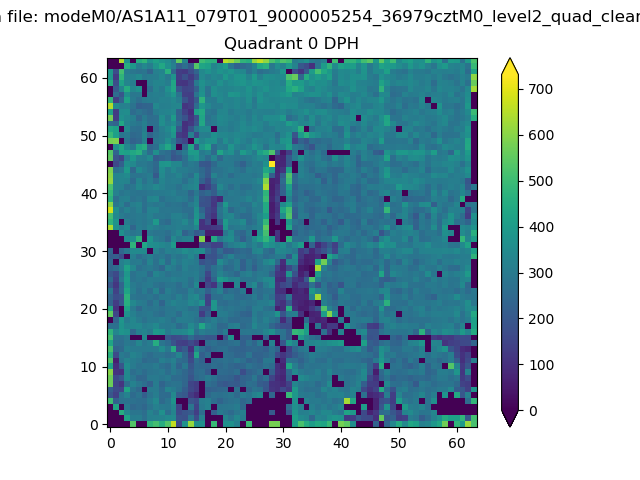 |
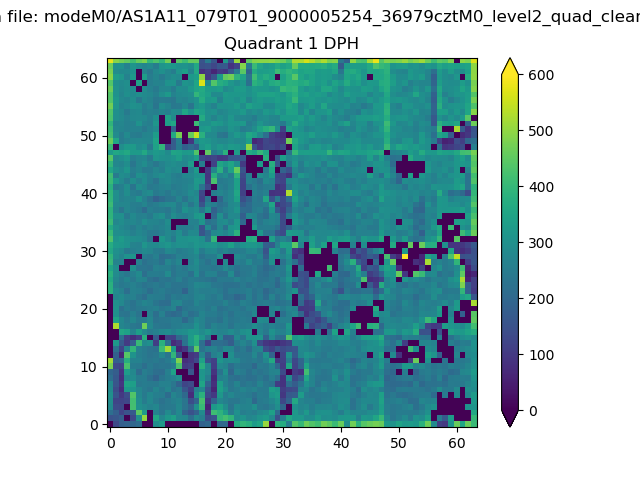 |
Quadrant B |
|---|---|---|---|
| Quadrant D | 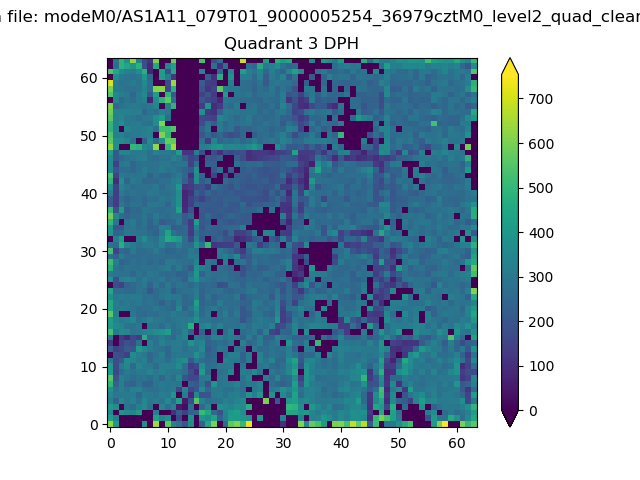 |
 |
Quadrant C |
| Plot type | Count rate plots | Images |
|---|---|---|
| Comparison with Poisson distribution Blue bars denote a histogram of data divided into 1 sec bins. Red curve is a Poisson curve with rate = median count rate of data. |
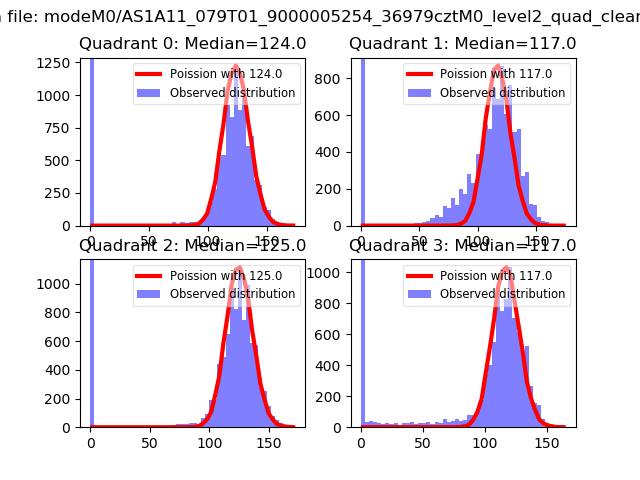 |
 |
| Quadrant-wise count rates Data is divided into 100 sec bins |
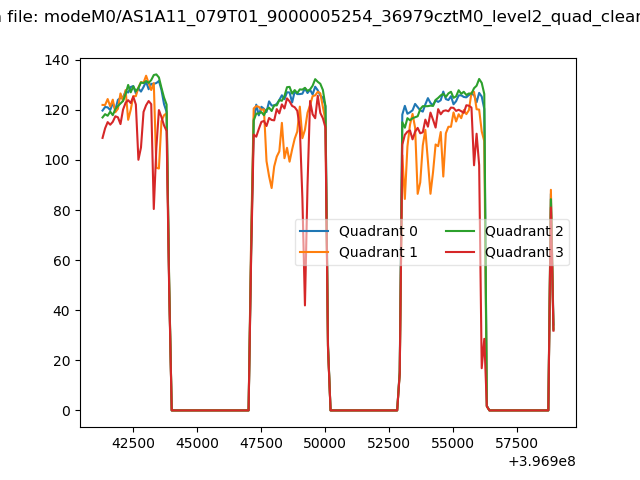 |
|
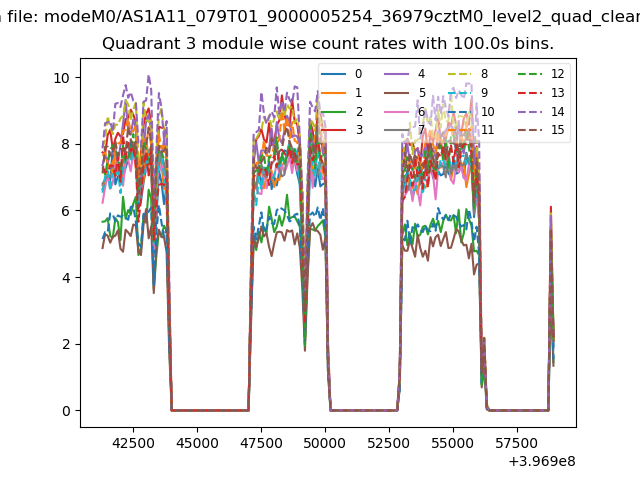
| Module-wise count rates for Quadrant A Data is divided into 100 sec bins |
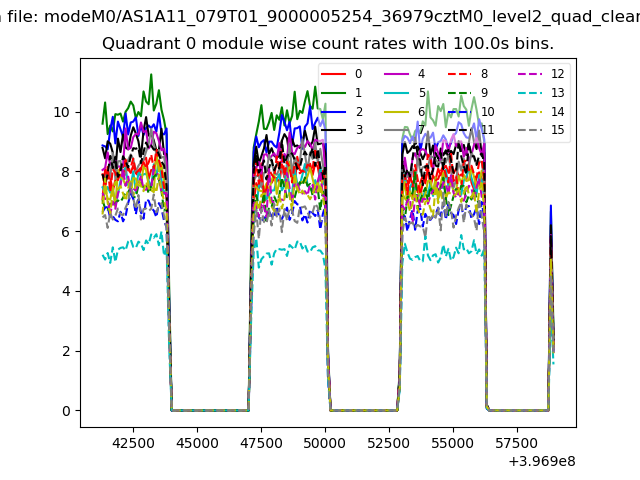 |
 |
| Module-wise count rates for Quadrant B Data is divided into 100 sec bins |
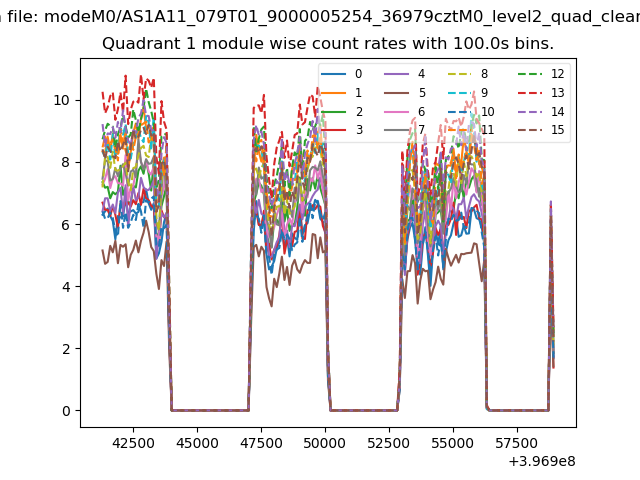 |
 |
| Module-wise count rates for Quadrant C Data is divided into 100 sec bins |
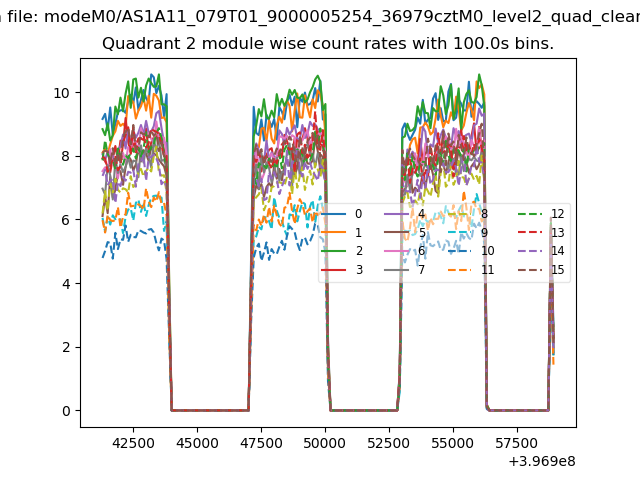 |
 |
| Module-wise count rates for Quadrant D Data is divided into 100 sec bins |
 |
 |
| Parameter | Plot |
|---|---|
| CZT HV Monitor | 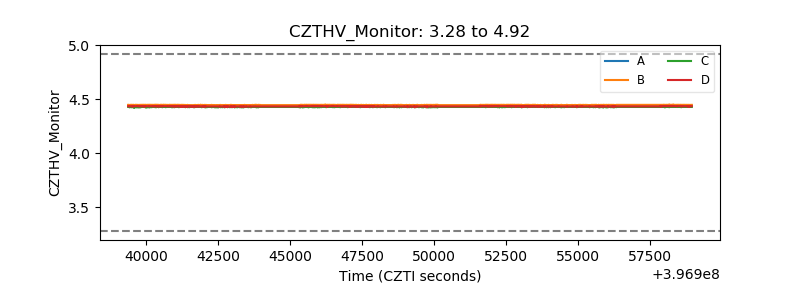 |
| D_VDD | 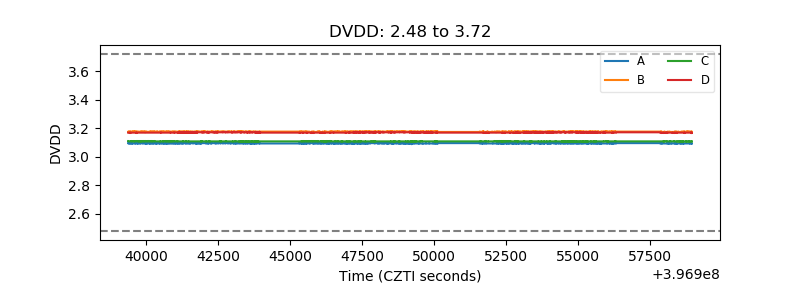 |
| Temperature 1 | 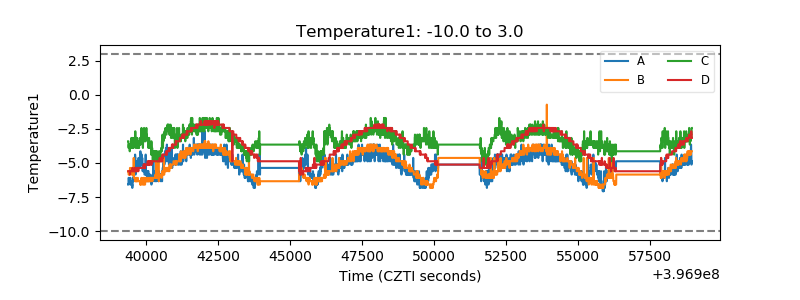 |
| Veto HV Monitor | 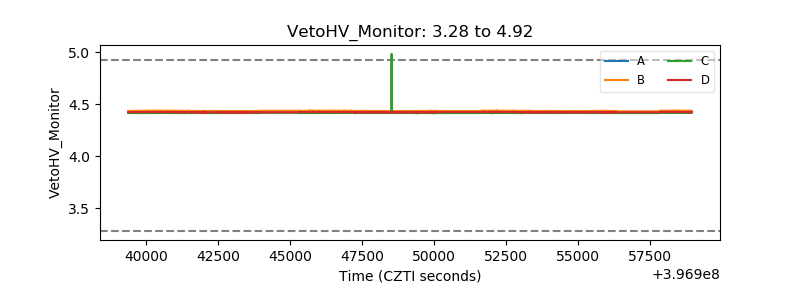 |
| Veto LLD | 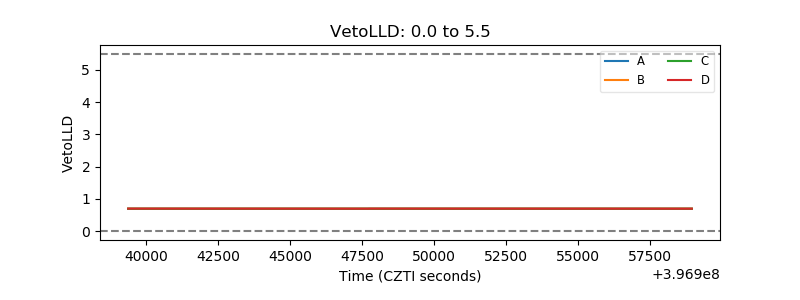 |
| Alpha Counter | 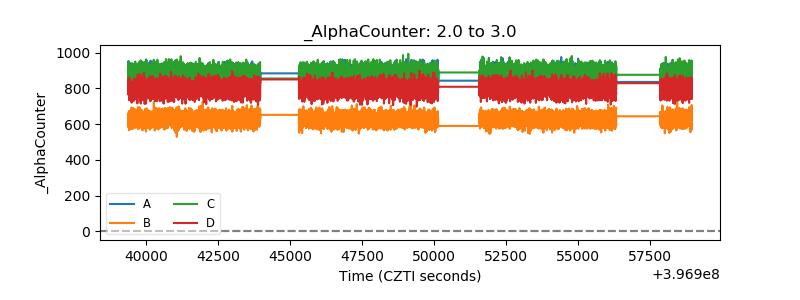 |
| _CPM_Rate | 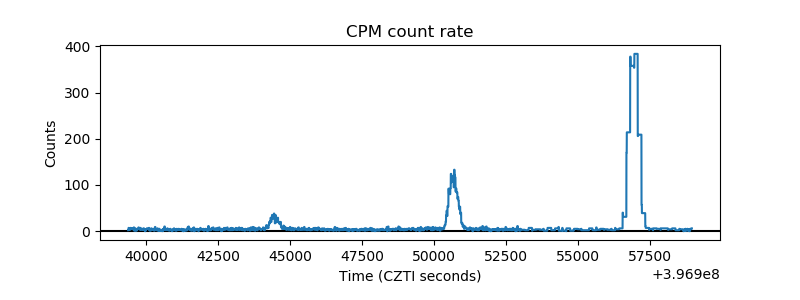 |
| CZT Counter | 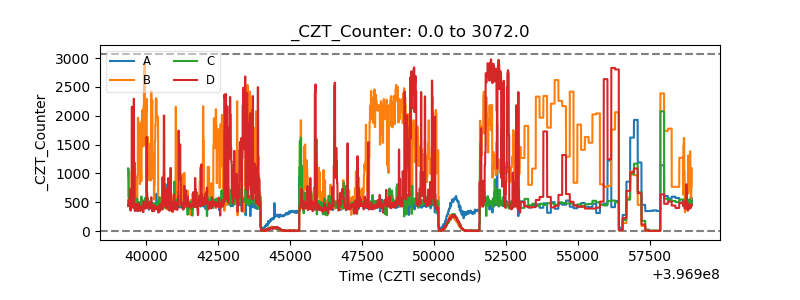 |
| +2.5 Volts monitor | 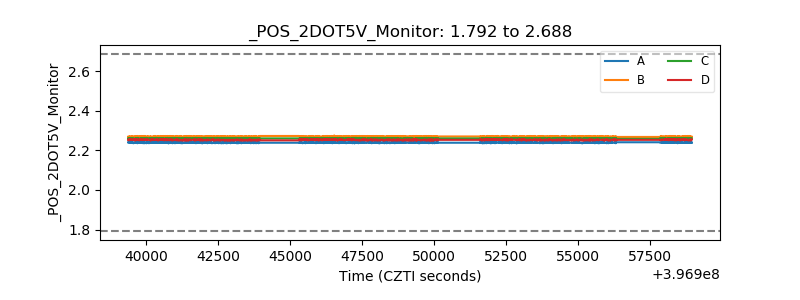 |
| +5 Volts monitor | 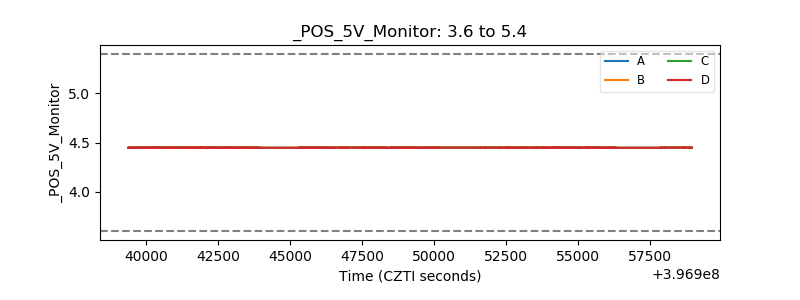 |
| _ROLL_ROT | 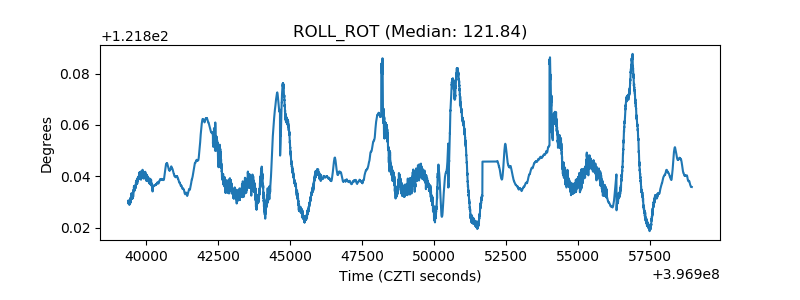 |
| _Roll_DEC | 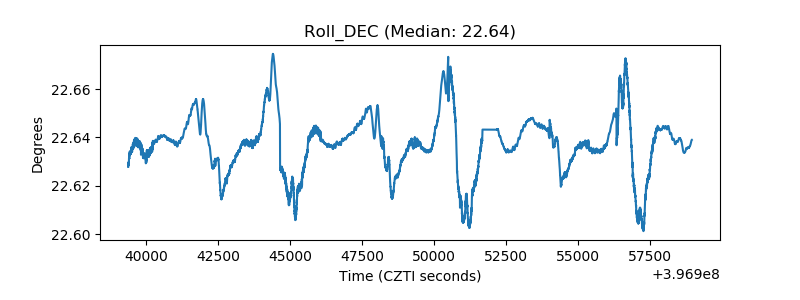 |
| _Roll_RA | 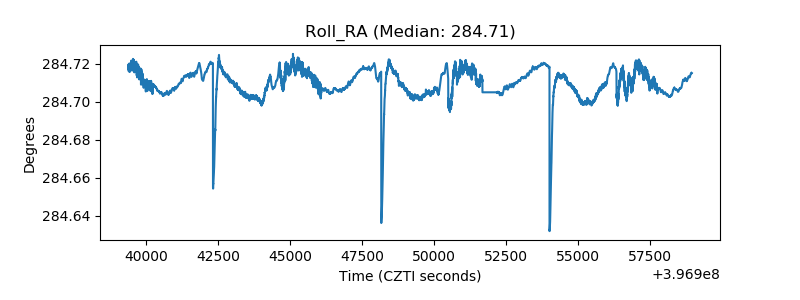 |
| Veto Counter | 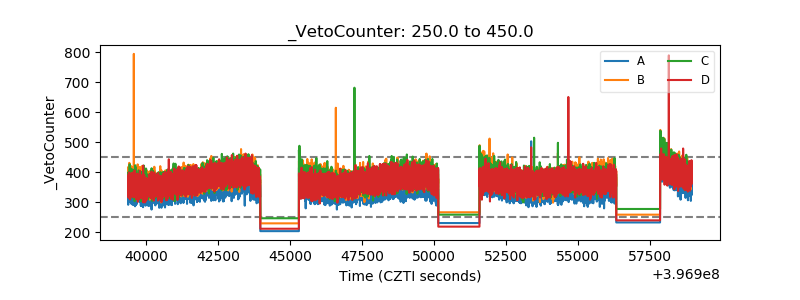 |