| Param | Original file | Final file |
|---|---|---|
| Filename | modeM0/AS1A11_079T01_9000005254_36980cztM0_level2.evt | modeM0/AS1A11_079T01_9000005254_36980cztM0_level2_quad_clean.evt |
| Size (bytes) | 605,615,040 | 75,453,120 |
| Size | 577.6 MB | 72.0 MB |
| Events in quadrant A | 2,804,202 | 500,164 |
| Events in quadrant B | 8,008,855 | 461,406 |
| Events in quadrant C | 2,987,928 | 499,396 |
| Events in quadrant D | 4,161,881 | 432,114 |
| Mode SS | |||
|---|---|---|---|
| Quadrant | BADHDUFLAG | Total packets | Discarded packets |
| A | 0 | 116 | 0 |
| B | 0 | 116 | 0 |
| C | 0 | 116 | 0 |
| D | 0 | 116 | 0 |
| Mode M9 | |||
|---|---|---|---|
| Quadrant | BADHDUFLAG | Total packets | Discarded packets |
| A | 0 | 31 | 0 |
| B | 0 | 31 | 0 |
| C | 0 | 31 | 0 |
| D | 0 | 31 | 0 |
| Mode M0 | |||
|---|---|---|---|
| Quadrant | BADHDUFLAG | Total packets | Discarded packets |
| A | 0 | 11931 | 3 |
| B | 0 | 27696 | 2 |
| C | 0 | 12210 | 2 |
| D | 0 | 16074 | 2 |
| Quadrant | Total seconds | Saturated seconds | Saturation percentage |
|---|---|---|---|
| A | 5589 | 22 | 0.393630% |
| B | 5589 | 1353 | 24.208266% |
| C | 5589 | 70 | 1.252460% |
| D | 5589 | 551 | 9.858651% |
Noise dominated data is calculated using 1-second bins in cleaned event files. If a bin has >2000 counts, and if more than 50% of those come from <1% of pixels, then it is considered to be noise-dominated and hence unusable.
| Quadrant | # 1 sec bins | Bins with >0 counts | Bins with >2000 counts | High rate bins dominated by noise | Noise dominated (total time) | Noise dominated (detector-on time) | Marked lightcurve |
|---|---|---|---|---|---|---|---|
| A | 8785 | 5591 | 3 | 3 | 0.03% | 0.05% | 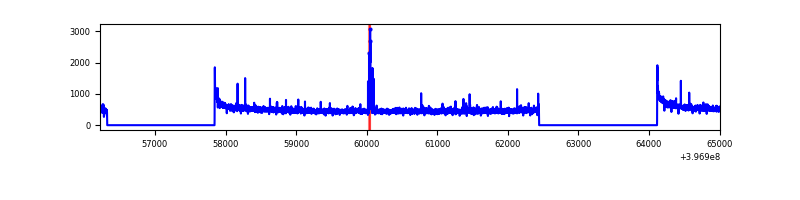 |
| B | 8784 | 5590 | 924 | 924 | 10.52% | 16.53% | 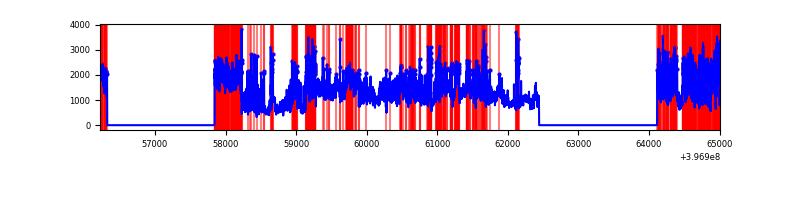 |
| C | 8785 | 5591 | 42 | 42 | 0.48% | 0.75% | 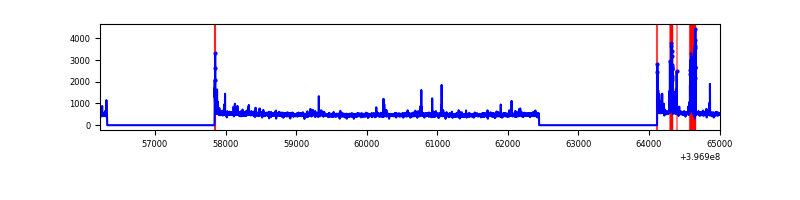 |
| D | 8785 | 5591 | 530 | 530 | 6.03% | 9.48% | 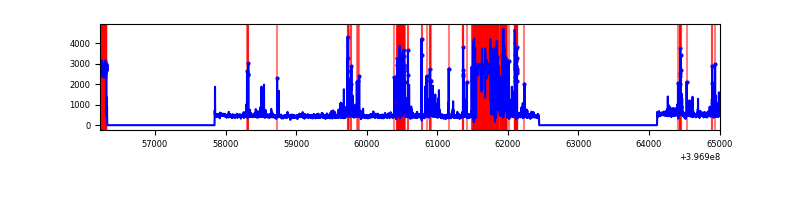 |
Top three noisy pixels from each quadrant. If the there are fewer than three noisy pixels in the level2.evt file, extra rows are filled as -1
| Pixel properties | Quadrant properties | ||||||
|---|---|---|---|---|---|---|---|
| Quadrant | DetID | PixID | Counts | Sigma | Mean | Median | Sigma |
| A | 10 | 83 | 218618 | 1644.6 | 653 | 641 | 132.5 |
| A | 9 | 143 | 58059 | 433.21 | 653 | 641 | 132.5 |
| A | 3 | 137 | 6936 | 47.49 | 653 | 641 | 132.5 |
| B | 5 | 184 | 5458533 | 45983.68 | 607 | 590 | 118.7 |
| B | 0 | 221 | 49110 | 408.79 | 607 | 590 | 118.7 |
| B | 4 | 81 | 42161 | 350.24 | 607 | 590 | 118.7 |
| C | 15 | 214 | 241394 | 1634.54 | 632 | 636 | 147.3 |
| C | 10 | 20 | 178060 | 1204.56 | 632 | 636 | 147.3 |
| C | 0 | 10 | 51209 | 343.35 | 632 | 636 | 147.3 |
| D | 12 | 17 | 1655507 | 11195.97 | 598 | 583 | 147.8 |
| D | 2 | 250 | 106318 | 715.32 | 598 | 583 | 147.8 |
| D | 12 | 6 | 52107 | 348.57 | 598 | 583 | 147.8 |
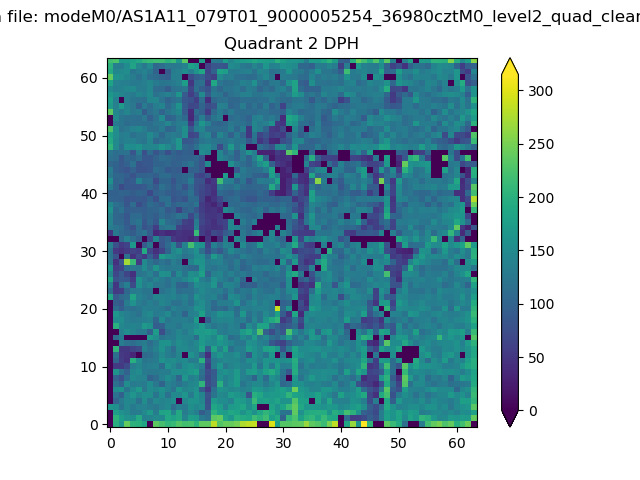
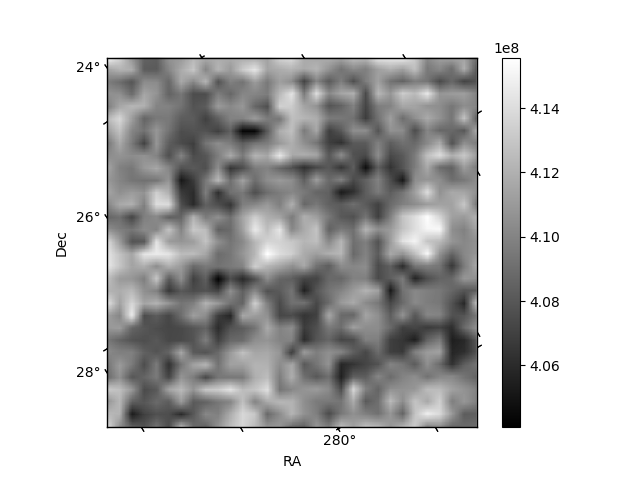
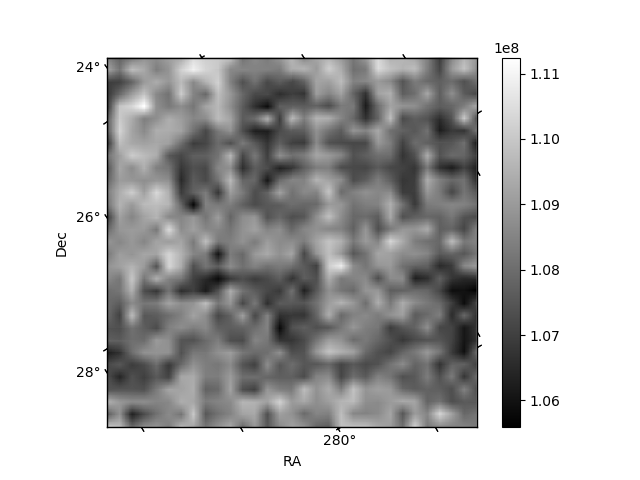
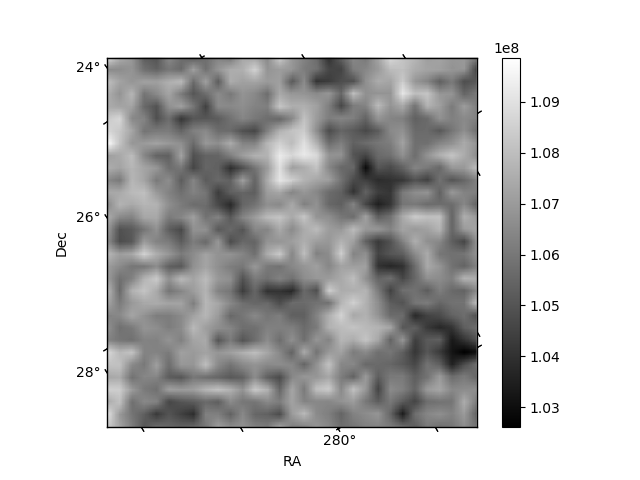
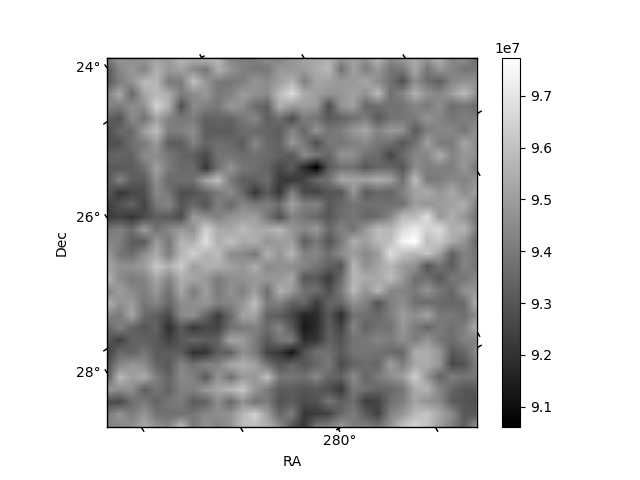
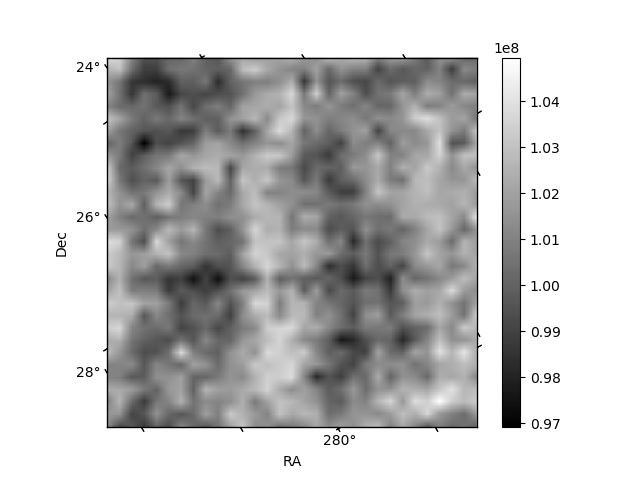
Histogram calculated using DETX and DETY for each event in the final _common_clean file
| Quadrant A | 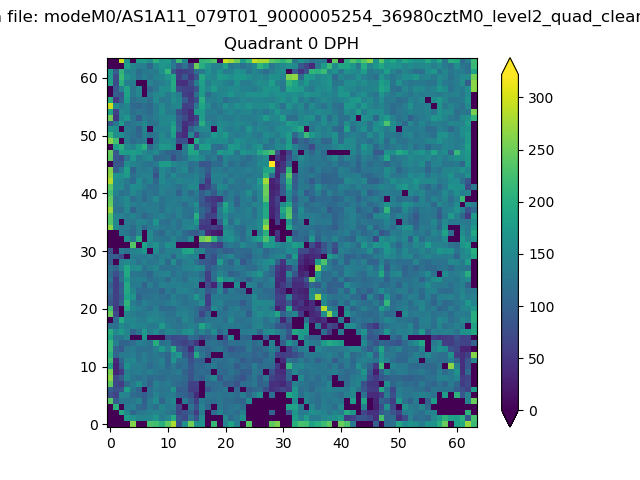 |
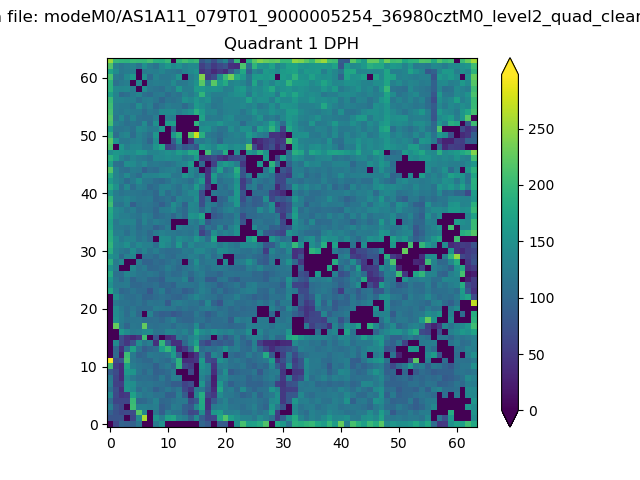 |
Quadrant B |
|---|---|---|---|
| Quadrant D | 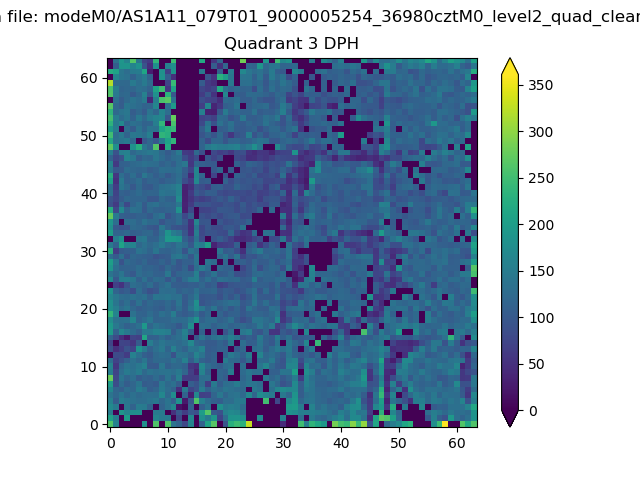 |
 |
Quadrant C |
| Plot type | Count rate plots | Images |
|---|---|---|
| Comparison with Poisson distribution Blue bars denote a histogram of data divided into 1 sec bins. Red curve is a Poisson curve with rate = median count rate of data. |
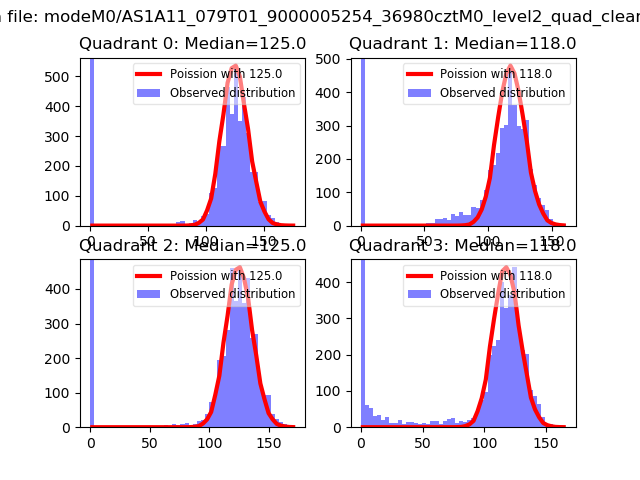 |
 |
| Quadrant-wise count rates Data is divided into 100 sec bins |
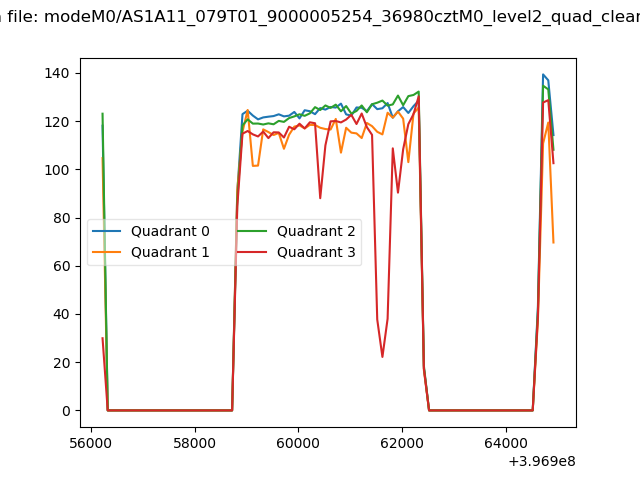 |
|
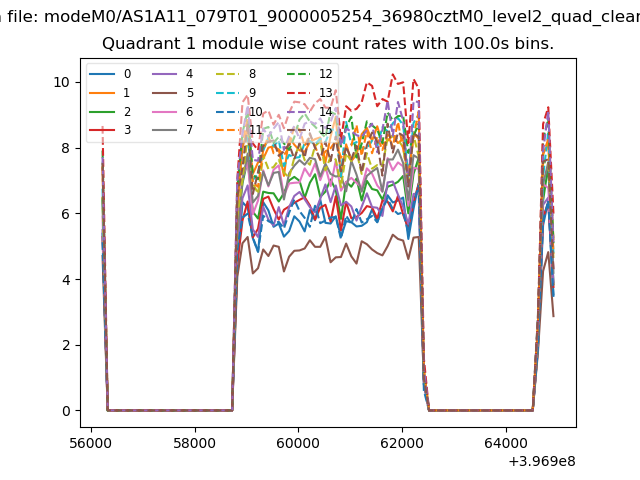
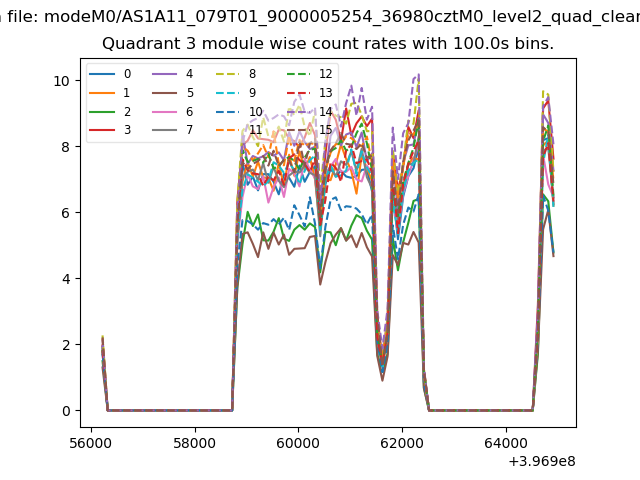
| Module-wise count rates for Quadrant A Data is divided into 100 sec bins |
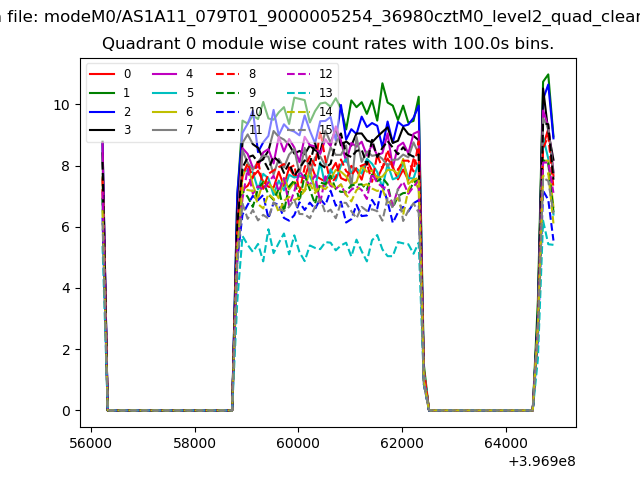 |
 |
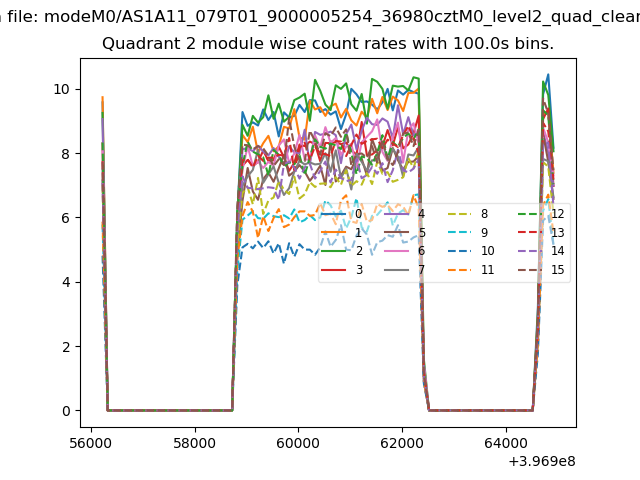
| Module-wise count rates for Quadrant B Data is divided into 100 sec bins |
 |
 |
| Module-wise count rates for Quadrant C Data is divided into 100 sec bins |
 |
 |
| Module-wise count rates for Quadrant D Data is divided into 100 sec bins |
 |
 |
| Parameter | Plot |
|---|---|
| CZT HV Monitor | 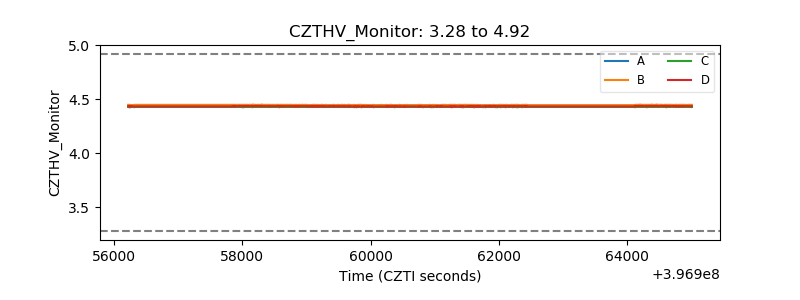 |
| D_VDD | 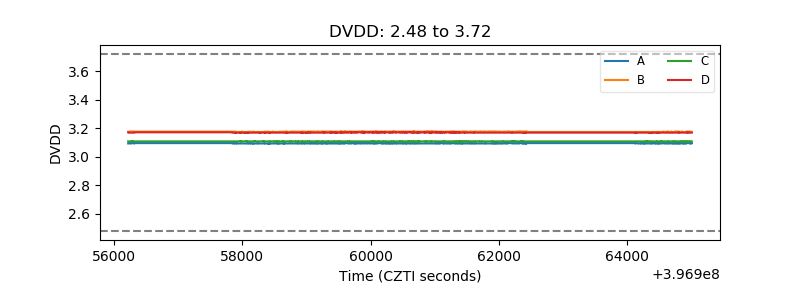 |
| Temperature 1 | 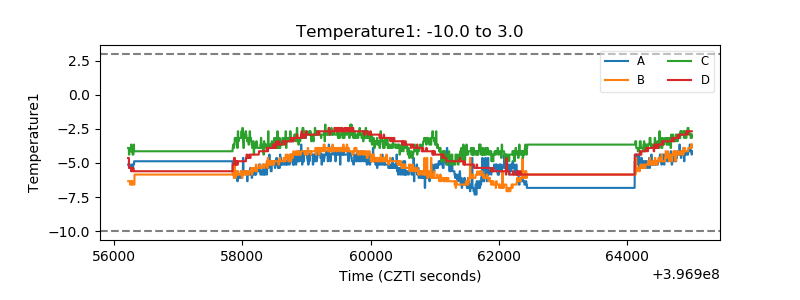 |
| Veto HV Monitor | 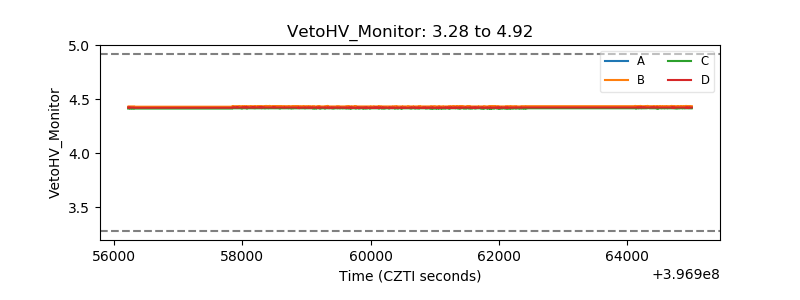 |
| Veto LLD | 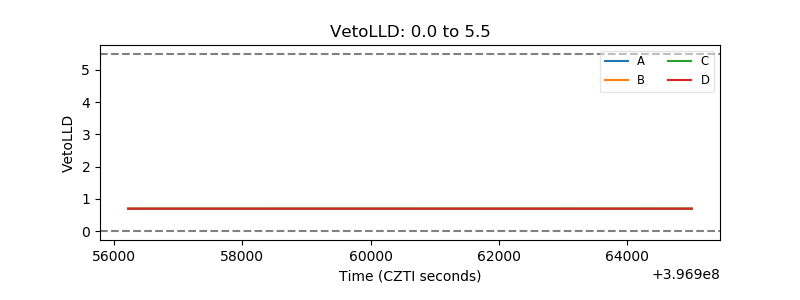 |
| Alpha Counter | 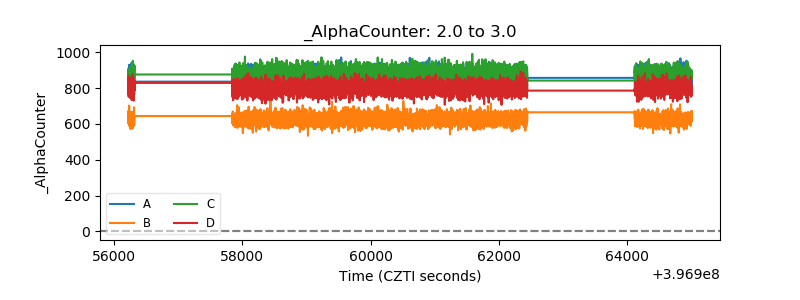 |
| _CPM_Rate | 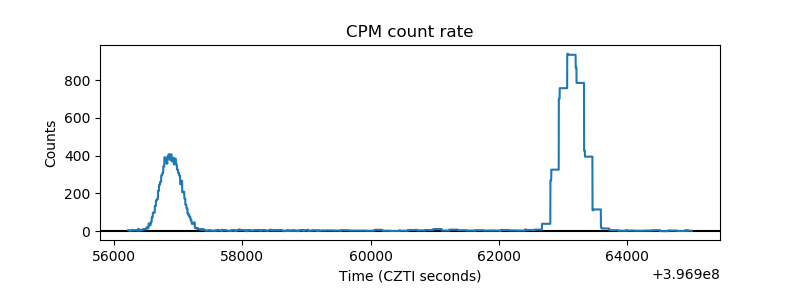 |
| CZT Counter | 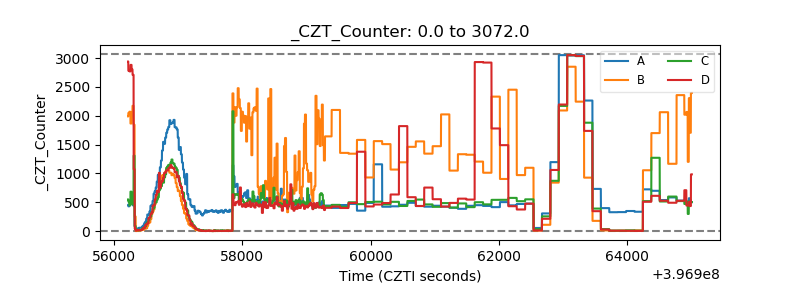 |
| +2.5 Volts monitor | 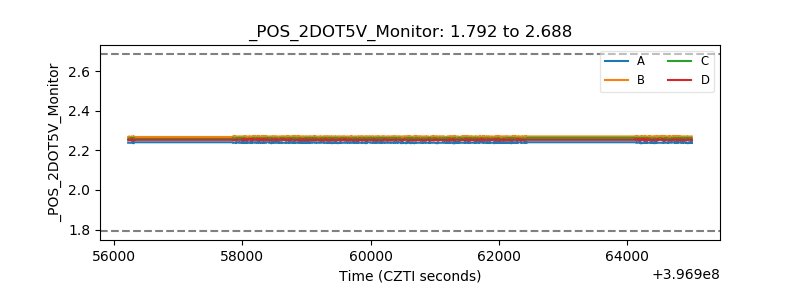 |
| +5 Volts monitor | 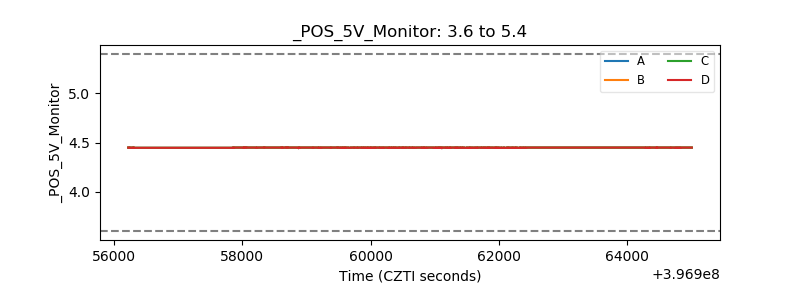 |
| _ROLL_ROT | 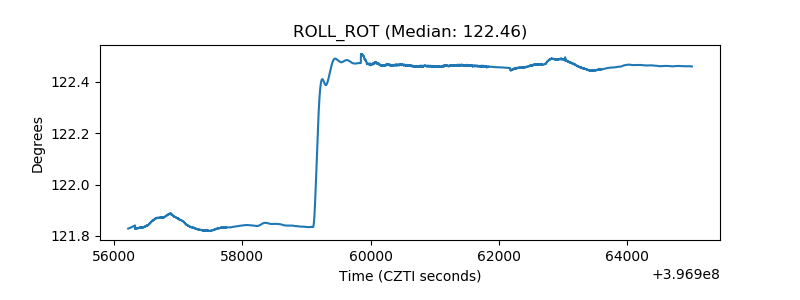 |
| _Roll_DEC | 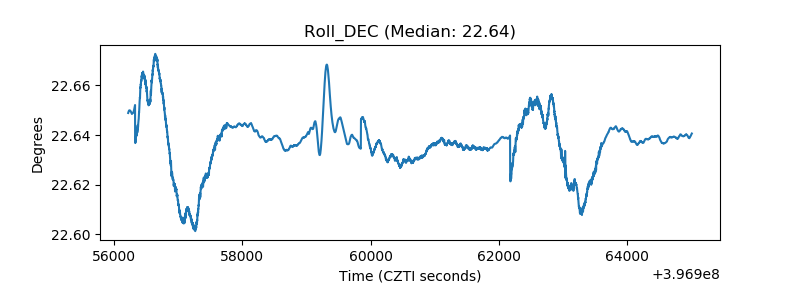 |
| _Roll_RA | 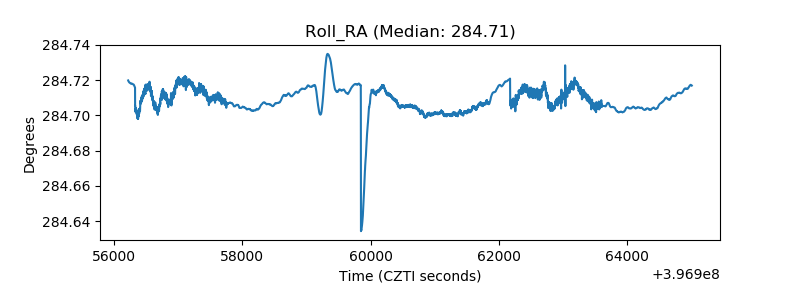 |
| Veto Counter | 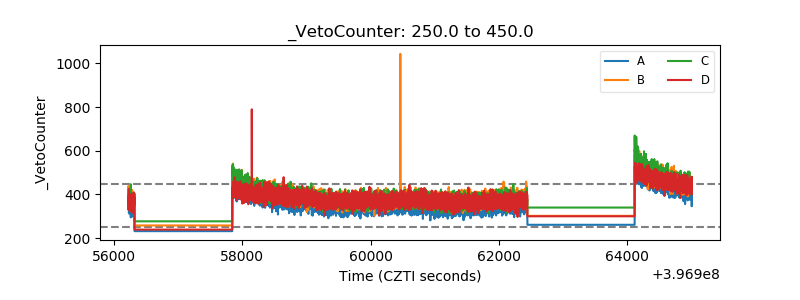 |