| Param | Original file | Final file |
|---|---|---|
| Filename | modeM0/AS1A11_079T01_9000005254_36982cztM0_level2.evt | modeM0/AS1A11_079T01_9000005254_36982cztM0_level2_quad_clean.evt |
| Size (bytes) | 2,629,860,480 | 318,588,480 |
| Size | 2.4 GB | 303.8 MB |
| Events in quadrant A | 11,674,912 | 2,135,942 |
| Events in quadrant B | 35,522,080 | 1,777,926 |
| Events in quadrant C | 12,481,809 | 2,136,024 |
| Events in quadrant D | 18,343,022 | 1,933,767 |
| Mode SS | |||
|---|---|---|---|
| Quadrant | BADHDUFLAG | Total packets | Discarded packets |
| A | 0 | 496 | 0 |
| B | 0 | 496 | 0 |
| C | 0 | 496 | 0 |
| D | 0 | 496 | 0 |
| Mode M9 | |||
|---|---|---|---|
| Quadrant | BADHDUFLAG | Total packets | Discarded packets |
| A | 0 | 76 | 0 |
| B | 0 | 76 | 0 |
| C | 0 | 76 | 0 |
| D | 0 | 76 | 0 |
| Mode M0 | |||
|---|---|---|---|
| Quadrant | BADHDUFLAG | Total packets | Discarded packets |
| A | 0 | 50163 | 6 |
| B | 0 | 122087 | 13 |
| C | 0 | 51477 | 5 |
| D | 0 | 70952 | 5 |
| Quadrant | Total seconds | Saturated seconds | Saturation percentage |
|---|---|---|---|
| A | 24153 | 47 | 0.194593% |
| B | 24152 | 7812 | 32.345147% |
| C | 24153 | 133 | 0.550656% |
| D | 24153 | 2193 | 9.079617% |
Noise dominated data is calculated using 1-second bins in cleaned event files. If a bin has >2000 counts, and if more than 50% of those come from <1% of pixels, then it is considered to be noise-dominated and hence unusable.
| Quadrant | # 1 sec bins | Bins with >0 counts | Bins with >2000 counts | High rate bins dominated by noise | Noise dominated (total time) | Noise dominated (detector-on time) | Marked lightcurve |
|---|---|---|---|---|---|---|---|
| A | 31918 | 24158 | 8 | 8 | 0.03% | 0.03% | 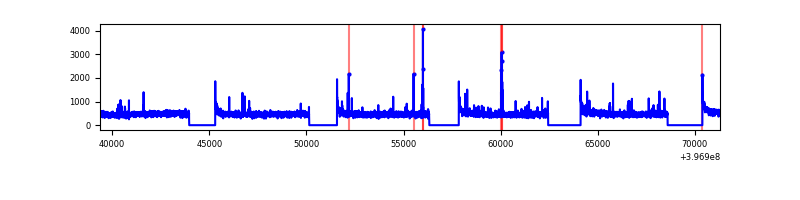 |
| B | 31918 | 24157 | 6533 | 6533 | 20.47% | 27.04% | 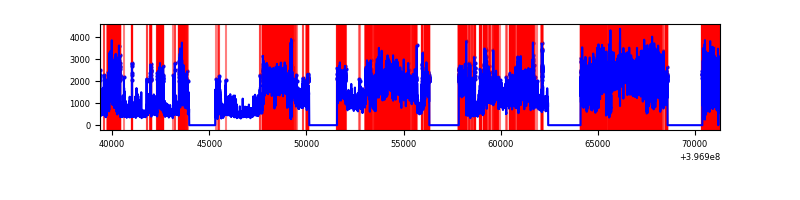 |
| C | 31918 | 24158 | 89 | 89 | 0.28% | 0.37% |  |
| D | 31918 | 24158 | 2059 | 2059 | 6.45% | 8.52% | 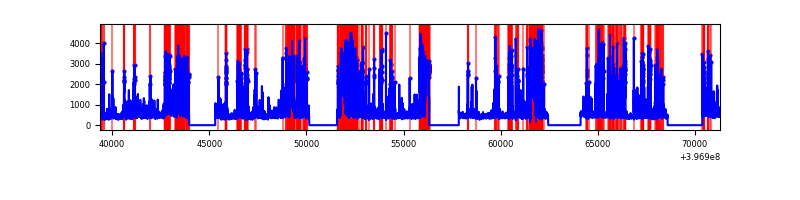 |
Top three noisy pixels from each quadrant. If the there are fewer than three noisy pixels in the level2.evt file, extra rows are filled as -1
| Pixel properties | Quadrant properties | ||||||
|---|---|---|---|---|---|---|---|
| Quadrant | DetID | PixID | Counts | Sigma | Mean | Median | Sigma |
| A | 10 | 83 | 757951 | 1360.51 | 2781 | 2724 | 555.1 |
| A | 9 | 143 | 149785 | 264.92 | 2781 | 2724 | 555.1 |
| A | 13 | 254 | 30239 | 49.57 | 2781 | 2724 | 555.1 |
| B | 5 | 184 | 24387525 | 51758.85 | 2477 | 2408 | 471.1 |
| B | 4 | 81 | 733216 | 1551.18 | 2477 | 2408 | 471.1 |
| B | 0 | 221 | 268650 | 565.11 | 2477 | 2408 | 471.1 |
| C | 15 | 214 | 1019739 | 1625.37 | 2715 | 2737 | 625.7 |
| C | 0 | 10 | 375159 | 595.2 | 2715 | 2737 | 625.7 |
| C | 10 | 20 | 225513 | 356.04 | 2715 | 2737 | 625.7 |
| D | 12 | 17 | 6355995 | 10038.54 | 2597 | 2526 | 632.9 |
| D | 13 | 171 | 726606 | 1144.05 | 2597 | 2526 | 632.9 |
| D | 2 | 250 | 714241 | 1124.52 | 2597 | 2526 | 632.9 |
Histogram calculated using DETX and DETY for each event in the final _common_clean file
| Quadrant A | 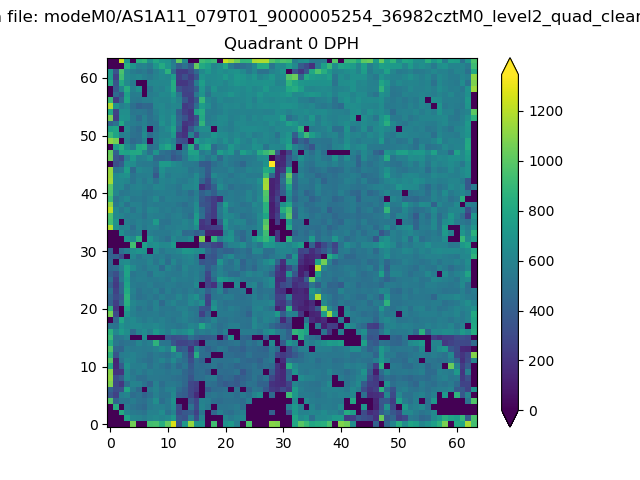 |
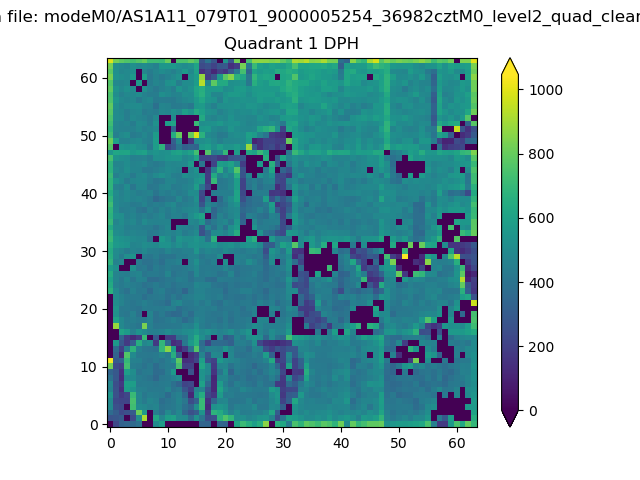 |
Quadrant B |
|---|---|---|---|
| Quadrant D | 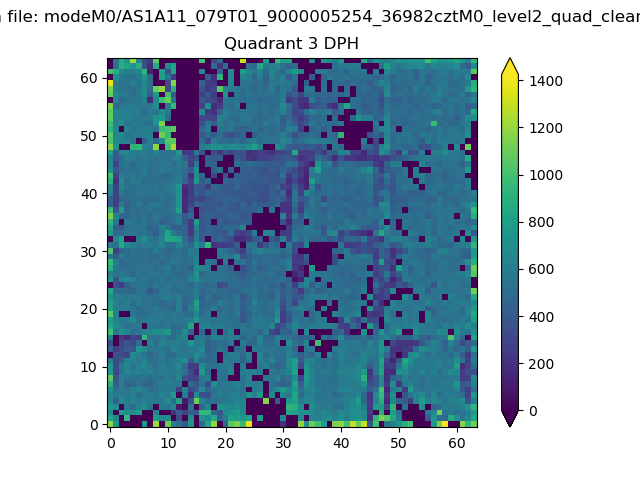 |
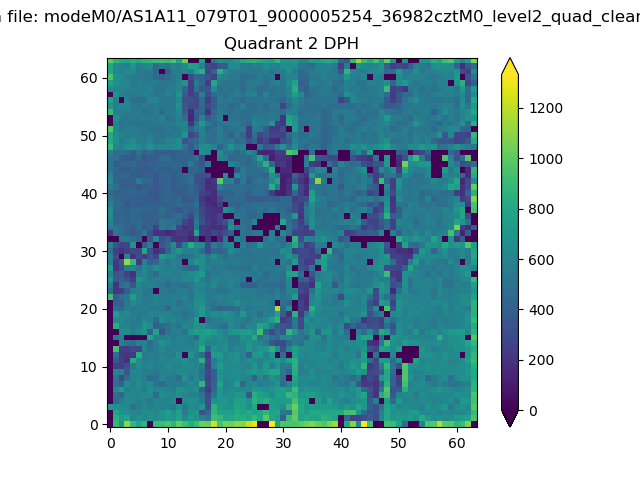 |
Quadrant C |
| Plot type | Count rate plots | Images |
|---|---|---|
| Comparison with Poisson distribution Blue bars denote a histogram of data divided into 1 sec bins. Red curve is a Poisson curve with rate = median count rate of data. |
 |
 |
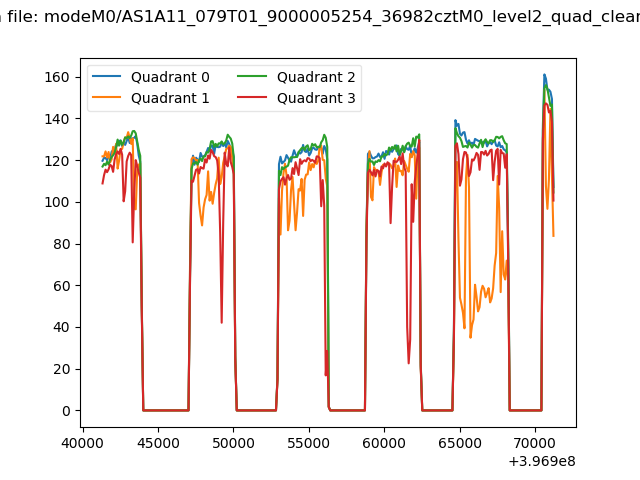
| Quadrant-wise count rates Data is divided into 100 sec bins |
 |
|
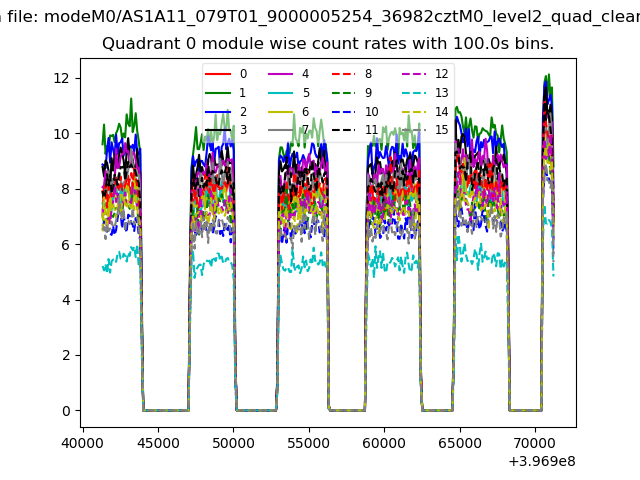
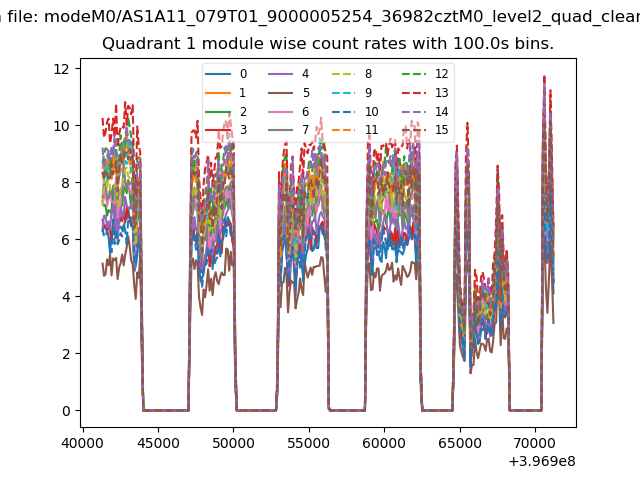
| Module-wise count rates for Quadrant A Data is divided into 100 sec bins |
 |
 |
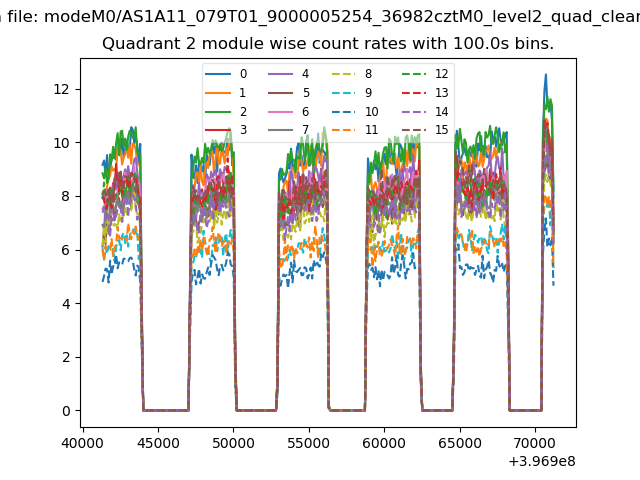
| Module-wise count rates for Quadrant B Data is divided into 100 sec bins |
 |
 |
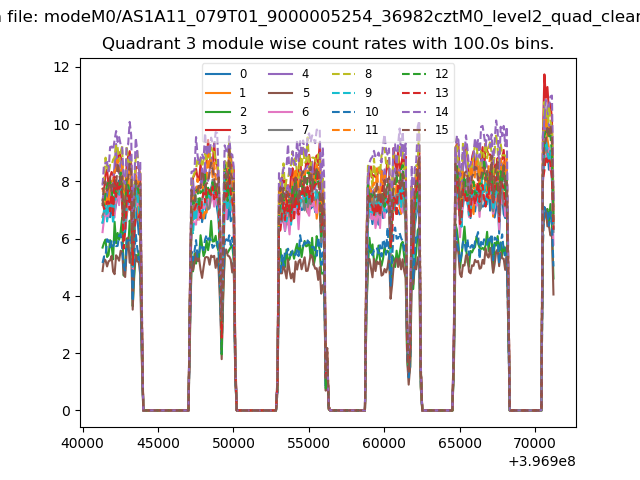
| Module-wise count rates for Quadrant C Data is divided into 100 sec bins |
 |
 |
| Module-wise count rates for Quadrant D Data is divided into 100 sec bins |
 |
 |
| Parameter | Plot |
|---|---|
| CZT HV Monitor | 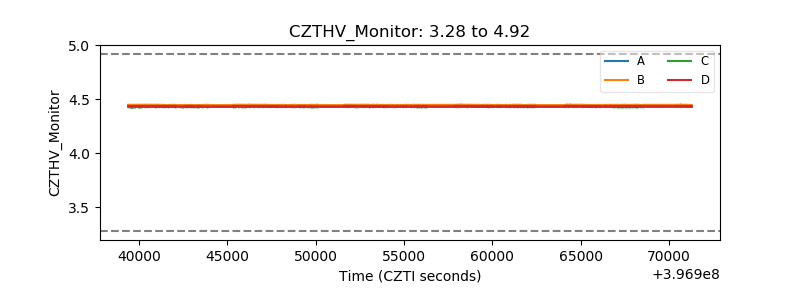 |
| D_VDD | 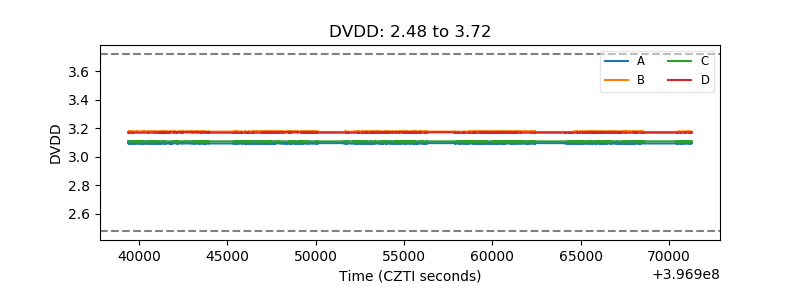 |
| Temperature 1 | 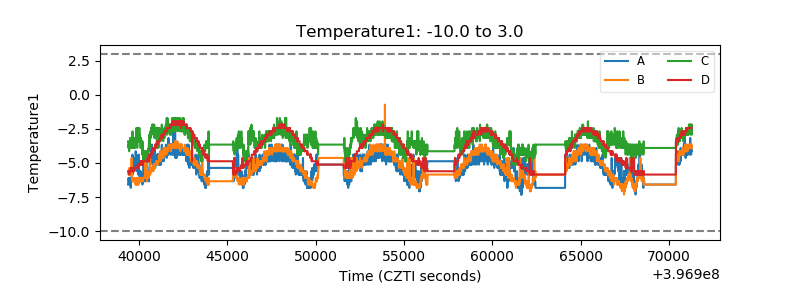 |
| Veto HV Monitor | 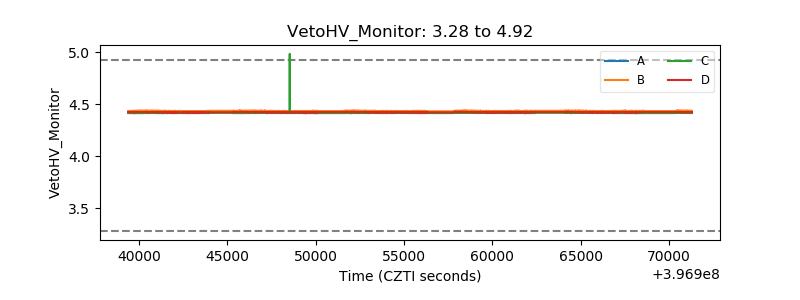 |
| Veto LLD | 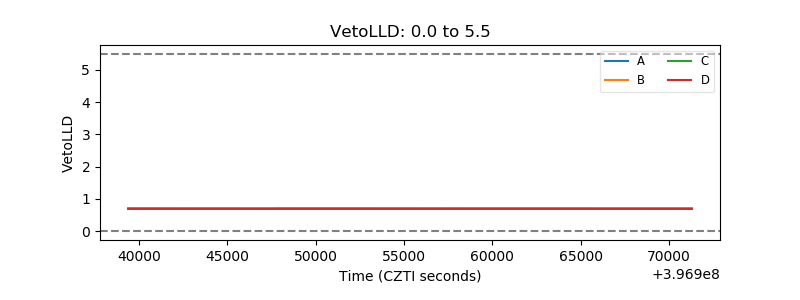 |
| Alpha Counter | 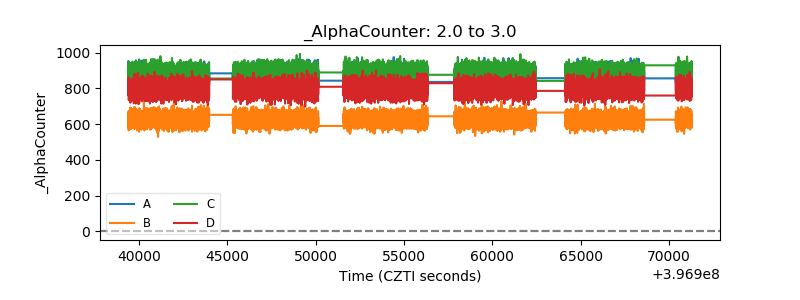 |
| _CPM_Rate | 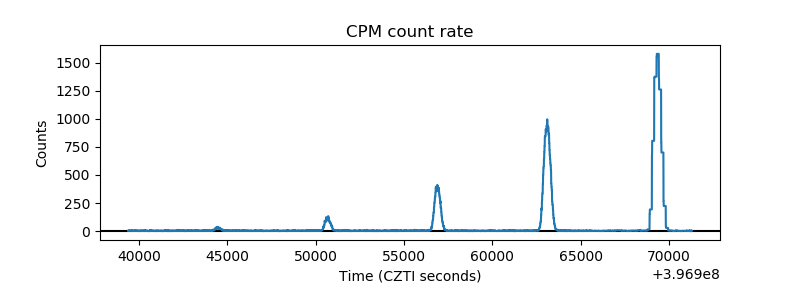 |
| CZT Counter | 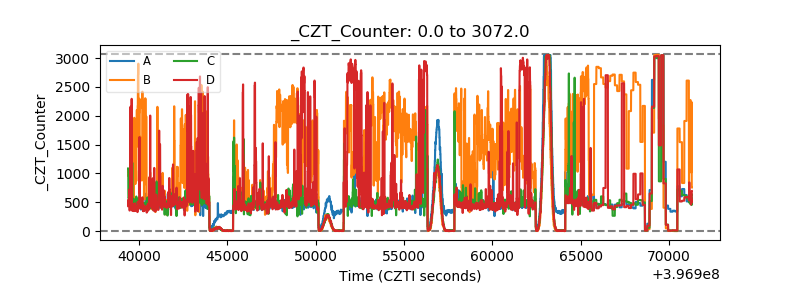 |
| +2.5 Volts monitor | 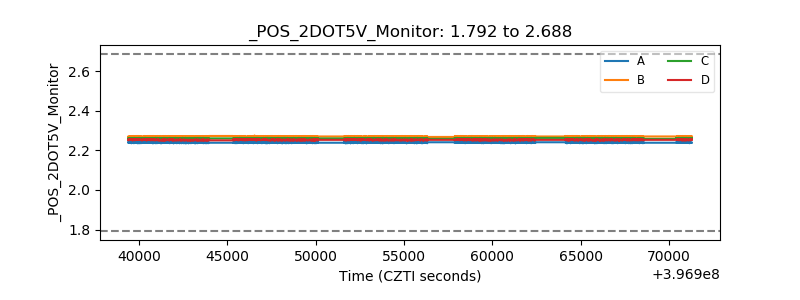 |
| +5 Volts monitor | 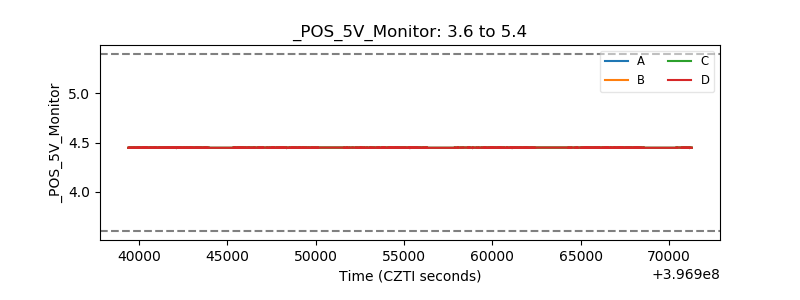 |
| _ROLL_ROT |  |
| _Roll_DEC | 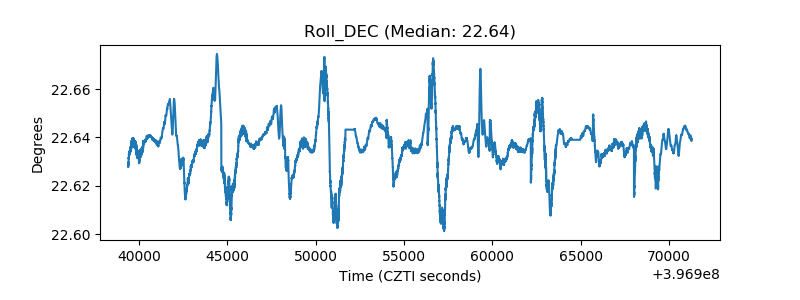 |
| _Roll_RA | 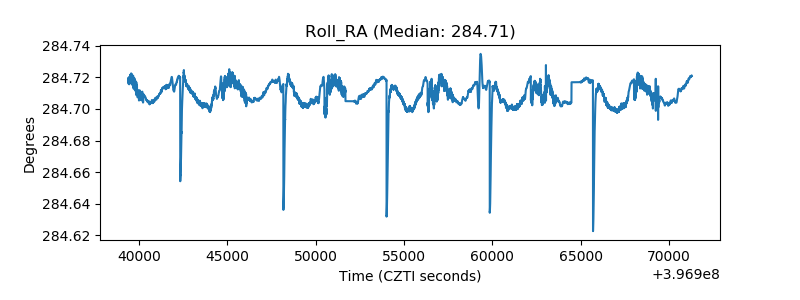 |
| Veto Counter | 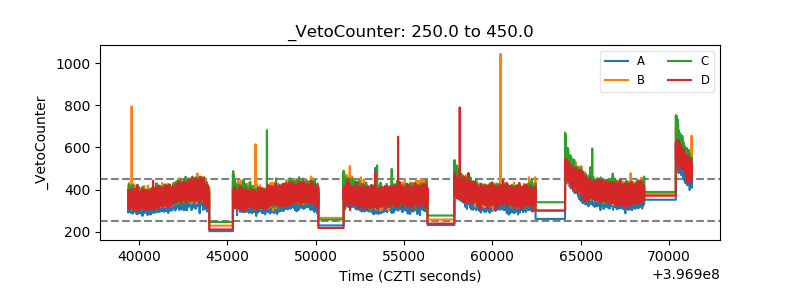 |