| Param | Original file | Final file |
|---|---|---|
| Filename | modeM0/AS1A11_079T01_9000005254_36985cztM0_level2.evt | modeM0/AS1A11_079T01_9000005254_36985cztM0_level2_quad_clean.evt |
| Size (bytes) | 1,111,752,000 | 216,982,080 |
| Size | 1.0 GB | 206.9 MB |
| Events in quadrant A | 6,682,750 | 1,459,537 |
| Events in quadrant B | 11,481,025 | 1,375,072 |
| Events in quadrant C | 7,143,888 | 1,469,394 |
| Events in quadrant D | 7,497,529 | 1,382,561 |
| Mode SS | |||
|---|---|---|---|
| Quadrant | BADHDUFLAG | Total packets | Discarded packets |
| A | 0 | 262 | 0 |
| B | 0 | 262 | 0 |
| C | 0 | 262 | 0 |
| D | 0 | 262 | 0 |
| Mode M9 | |||
|---|---|---|---|
| Quadrant | BADHDUFLAG | Total packets | Discarded packets |
| A | 0 | 62 | 0 |
| B | 0 | 62 | 0 |
| C | 0 | 62 | 0 |
| D | 0 | 62 | 0 |
| Mode M0 | |||
|---|---|---|---|
| Quadrant | BADHDUFLAG | Total packets | Discarded packets |
| A | 0 | 27571 | 4 |
| B | 0 | 42791 | 3 |
| C | 0 | 28797 | 5 |
| D | 0 | 30651 | 3 |
| Quadrant | Total seconds | Saturated seconds | Saturation percentage |
|---|---|---|---|
| A | 12809 | 26 | 0.202982% |
| B | 12809 | 1470 | 11.476306% |
| C | 12808 | 87 | 0.679263% |
| D | 12809 | 346 | 2.701226% |
Noise dominated data is calculated using 1-second bins in cleaned event files. If a bin has >2000 counts, and if more than 50% of those come from <1% of pixels, then it is considered to be noise-dominated and hence unusable.
| Quadrant | # 1 sec bins | Bins with >0 counts | Bins with >2000 counts | High rate bins dominated by noise | Noise dominated (total time) | Noise dominated (detector-on time) | Marked lightcurve |
|---|---|---|---|---|---|---|---|
| A | 18907 | 12812 | 7 | 7 | 0.04% | 0.05% | 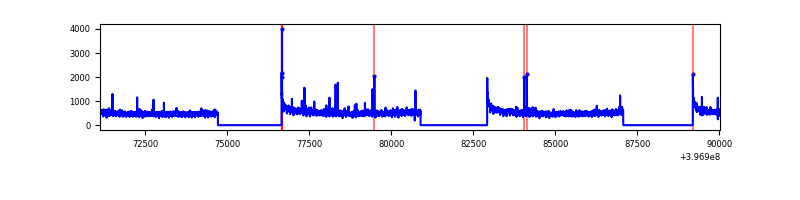 |
| B | 18907 | 12812 | 1011 | 1011 | 5.35% | 7.89% | 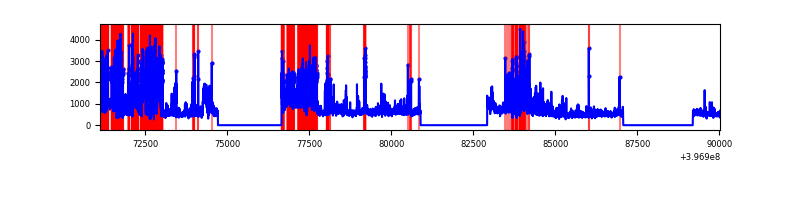 |
| C | 18907 | 12812 | 73 | 73 | 0.39% | 0.57% | 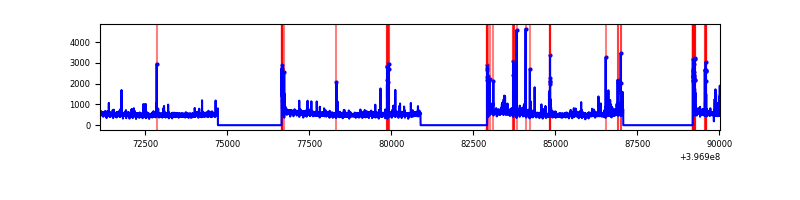 |
| D | 18907 | 12812 | 336 | 336 | 1.78% | 2.62% |  |
Top three noisy pixels from each quadrant. If the there are fewer than three noisy pixels in the level2.evt file, extra rows are filled as -1
| Pixel properties | Quadrant properties | ||||||
|---|---|---|---|---|---|---|---|
| Quadrant | DetID | PixID | Counts | Sigma | Mean | Median | Sigma |
| A | 10 | 83 | 426689 | 1381.94 | 1566 | 1542 | 307.6 |
| A | 15 | 222 | 102673 | 328.73 | 1566 | 1542 | 307.6 |
| A | 9 | 143 | 79545 | 253.55 | 1566 | 1542 | 307.6 |
| B | 5 | 184 | 5011187 | 18181.74 | 1486 | 1448 | 275.5 |
| B | 0 | 221 | 196077 | 706.36 | 1486 | 1448 | 275.5 |
| B | 5 | 172 | 147725 | 530.88 | 1486 | 1448 | 275.5 |
| C | 15 | 214 | 541682 | 1529.37 | 1542 | 1561 | 353.2 |
| C | 0 | 10 | 248744 | 699.91 | 1542 | 1561 | 353.2 |
| C | 0 | 207 | 136214 | 381.28 | 1542 | 1561 | 353.2 |
| D | 2 | 250 | 666760 | 1818.99 | 1526 | 1493 | 365.7 |
| D | 12 | 17 | 390130 | 1062.62 | 1526 | 1493 | 365.7 |
| D | 13 | 249 | 228309 | 620.16 | 1526 | 1493 | 365.7 |
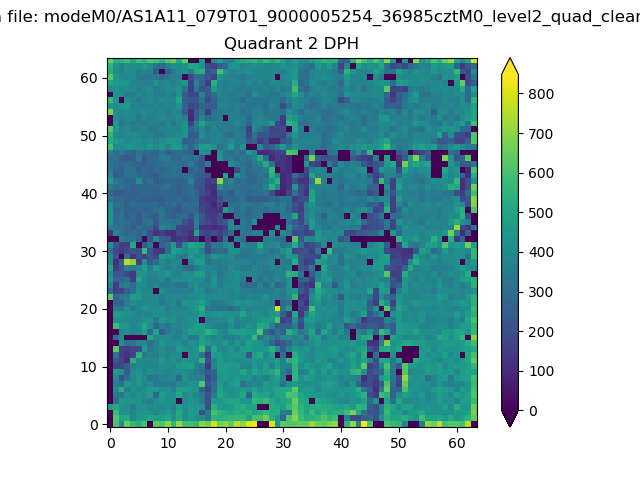
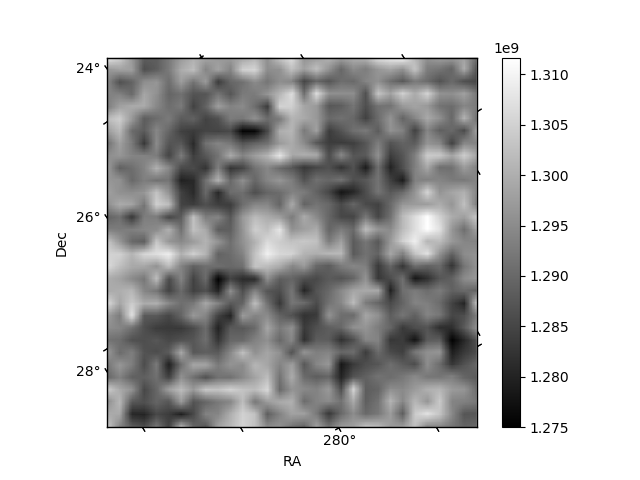
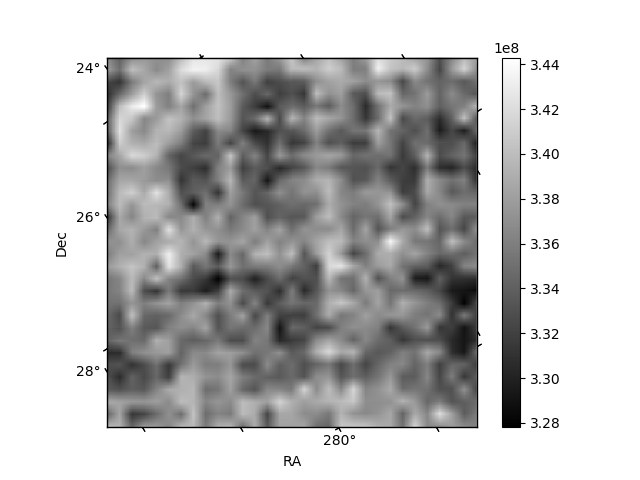
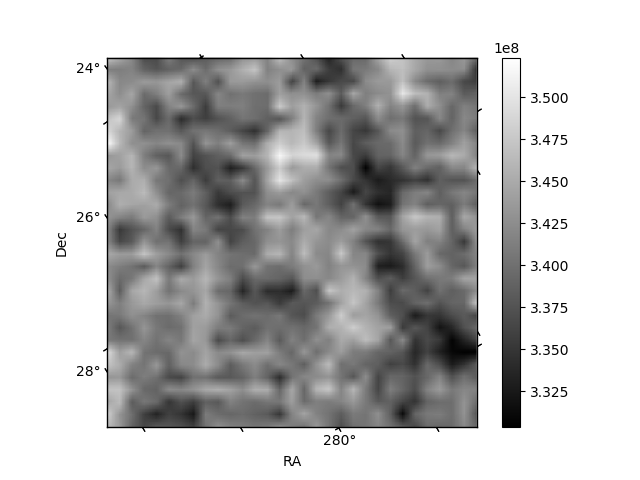
Histogram calculated using DETX and DETY for each event in the final _common_clean file
| Quadrant A |  |
 |
Quadrant B |
|---|---|---|---|
| Quadrant D |  |
 |
Quadrant C |
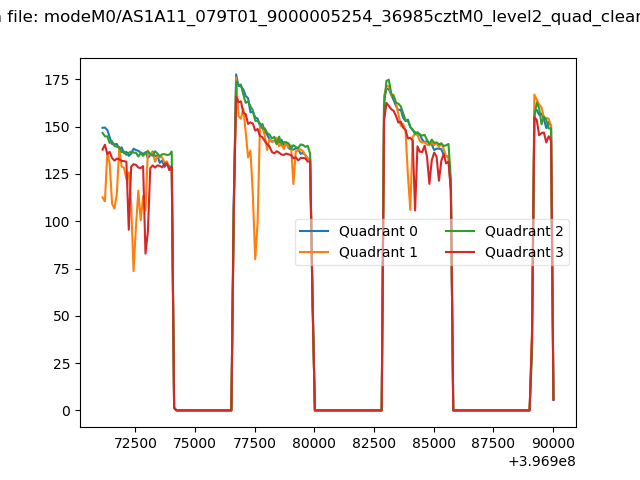
| Plot type | Count rate plots | Images |
|---|---|---|
| Comparison with Poisson distribution Blue bars denote a histogram of data divided into 1 sec bins. Red curve is a Poisson curve with rate = median count rate of data. |
 |
 |
| Quadrant-wise count rates Data is divided into 100 sec bins |
 |
|
| Module-wise count rates for Quadrant A Data is divided into 100 sec bins |
 |
 |
| Module-wise count rates for Quadrant B Data is divided into 100 sec bins |
 |
 |
| Module-wise count rates for Quadrant C Data is divided into 100 sec bins |
 |
 |
| Module-wise count rates for Quadrant D Data is divided into 100 sec bins |
 |
 |
| Parameter | Plot |
|---|---|
| CZT HV Monitor |  |
| D_VDD |  |
| Temperature 1 | 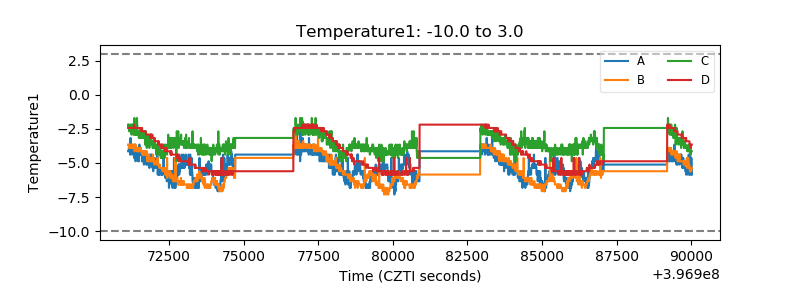 |
| Veto HV Monitor | 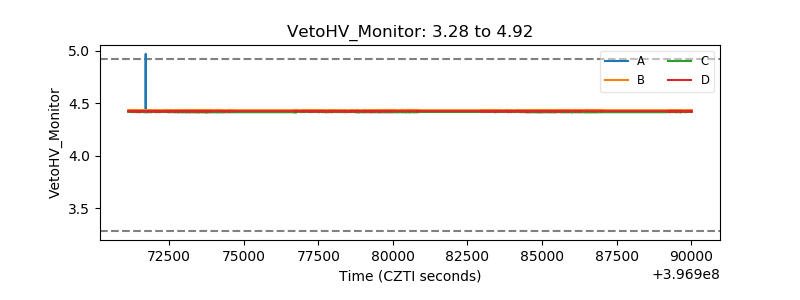 |
| Veto LLD | 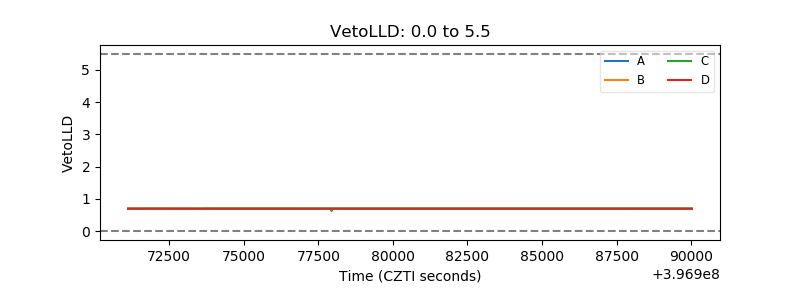 |
| Alpha Counter | 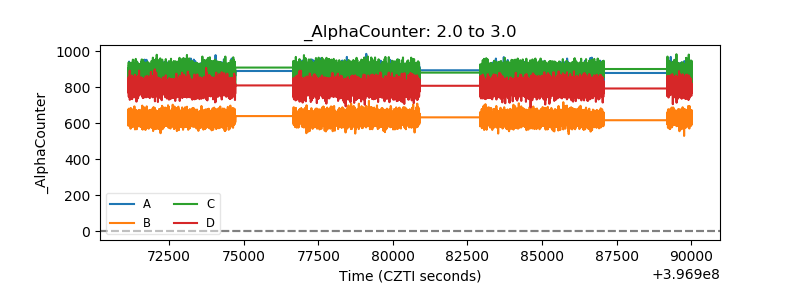 |
| _CPM_Rate | 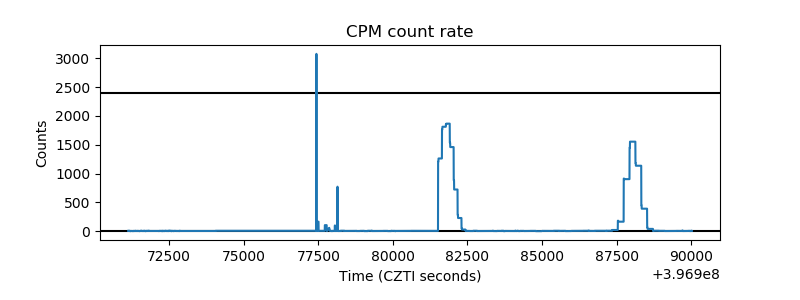 |
| CZT Counter | 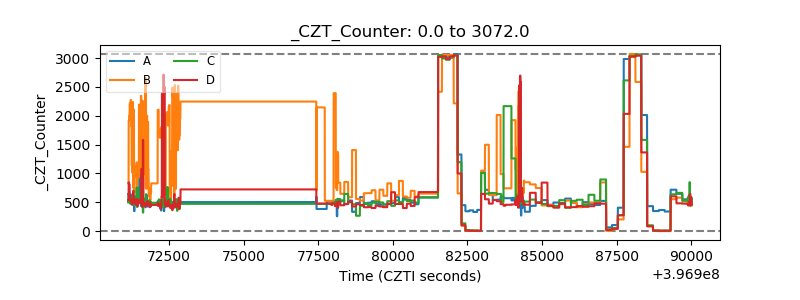 |
| +2.5 Volts monitor | 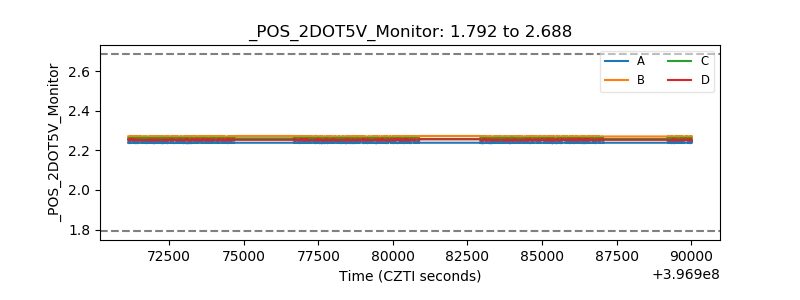 |
| +5 Volts monitor |  |
| _ROLL_ROT |  |
| _Roll_DEC | 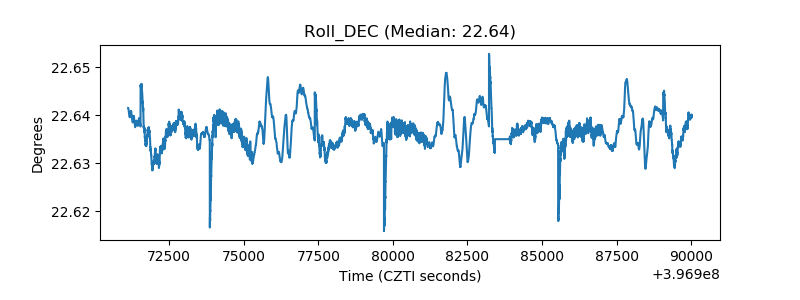 |
| _Roll_RA | 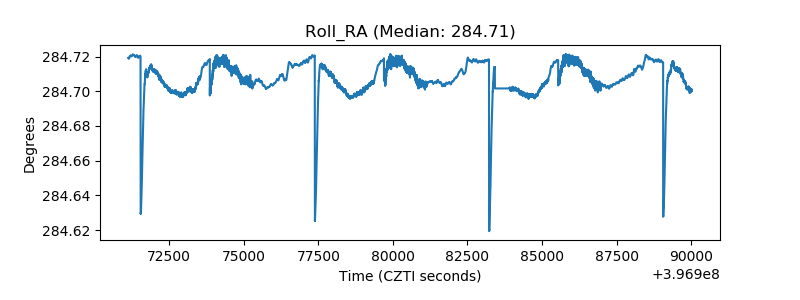 |
| Veto Counter |  |