| Param | Original file | Final file |
|---|---|---|
| Filename | modeM0/AS1A11_079T01_9000005254_36986cztM0_level2.evt | modeM0/AS1A11_079T01_9000005254_36986cztM0_level2_quad_clean.evt |
| Size (bytes) | 1,425,021,120 | 268,286,400 |
| Size | 1.3 GB | 255.9 MB |
| Events in quadrant A | 8,964,738 | 1,778,869 |
| Events in quadrant B | 13,747,119 | 1,701,979 |
| Events in quadrant C | 9,411,836 | 1,795,744 |
| Events in quadrant D | 9,900,470 | 1,690,809 |
| Mode SS | |||
|---|---|---|---|
| Quadrant | BADHDUFLAG | Total packets | Discarded packets |
| A | 0 | 342 | 0 |
| B | 0 | 342 | 0 |
| C | 0 | 342 | 0 |
| D | 0 | 342 | 0 |
| Mode M9 | |||
|---|---|---|---|
| Quadrant | BADHDUFLAG | Total packets | Discarded packets |
| A | 0 | 84 | 0 |
| B | 0 | 84 | 0 |
| C | 0 | 84 | 0 |
| D | 0 | 84 | 0 |
| Mode M0 | |||
|---|---|---|---|
| Quadrant | BADHDUFLAG | Total packets | Discarded packets |
| A | 0 | 36841 | 5 |
| B | 0 | 51973 | 4 |
| C | 0 | 37908 | 4 |
| D | 0 | 40430 | 4 |
| Quadrant | Total seconds | Saturated seconds | Saturation percentage |
|---|---|---|---|
| A | 16808 | 39 | 0.232032% |
| B | 16808 | 1483 | 8.823179% |
| C | 16808 | 122 | 0.725845% |
| D | 16808 | 435 | 2.588053% |
Noise dominated data is calculated using 1-second bins in cleaned event files. If a bin has >2000 counts, and if more than 50% of those come from <1% of pixels, then it is considered to be noise-dominated and hence unusable.
| Quadrant | # 1 sec bins | Bins with >0 counts | Bins with >2000 counts | High rate bins dominated by noise | Noise dominated (total time) | Noise dominated (detector-on time) | Marked lightcurve |
|---|---|---|---|---|---|---|---|
| A | 25059 | 16812 | 11 | 11 | 0.04% | 0.07% | 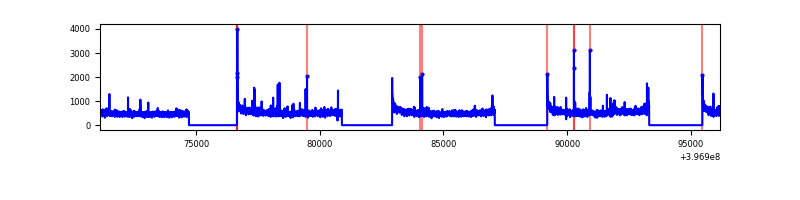 |
| B | 25059 | 16812 | 1017 | 1017 | 4.06% | 6.05% | 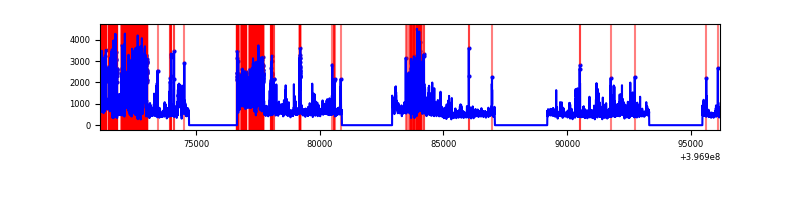 |
| C | 25059 | 16812 | 100 | 100 | 0.40% | 0.59% | 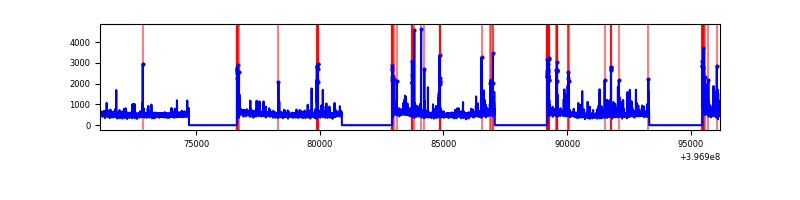 |
| D | 25059 | 16812 | 425 | 425 | 1.70% | 2.53% | 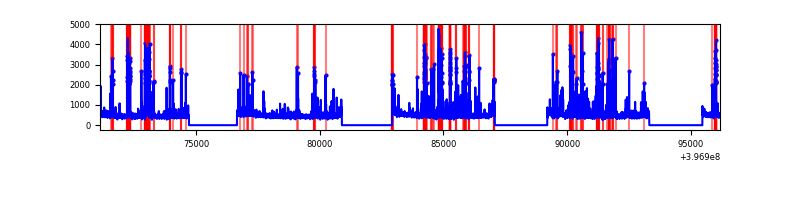 |
Top three noisy pixels from each quadrant. If the there are fewer than three noisy pixels in the level2.evt file, extra rows are filled as -1
| Pixel properties | Quadrant properties | ||||||
|---|---|---|---|---|---|---|---|
| Quadrant | DetID | PixID | Counts | Sigma | Mean | Median | Sigma |
| A | 10 | 83 | 560347 | 1397.13 | 2032 | 1998 | 399.6 |
| A | 15 | 222 | 403512 | 1004.69 | 2032 | 1998 | 399.6 |
| A | 9 | 143 | 96111 | 235.5 | 2032 | 1998 | 399.6 |
| B | 5 | 184 | 5167192 | 14135.24 | 1953 | 1901 | 365.4 |
| B | 0 | 221 | 277040 | 752.94 | 1953 | 1901 | 365.4 |
| B | 4 | 81 | 248174 | 673.95 | 1953 | 1901 | 365.4 |
| C | 15 | 214 | 710631 | 1540.22 | 2004 | 2024 | 460.1 |
| C | 0 | 10 | 338517 | 731.4 | 2004 | 2024 | 460.1 |
| C | 0 | 207 | 233422 | 502.97 | 2004 | 2024 | 460.1 |
| D | 2 | 250 | 790844 | 1663.99 | 1979 | 1936 | 474.1 |
| D | 12 | 6 | 606038 | 1274.19 | 1979 | 1936 | 474.1 |
| D | 12 | 17 | 448359 | 941.61 | 1979 | 1936 | 474.1 |
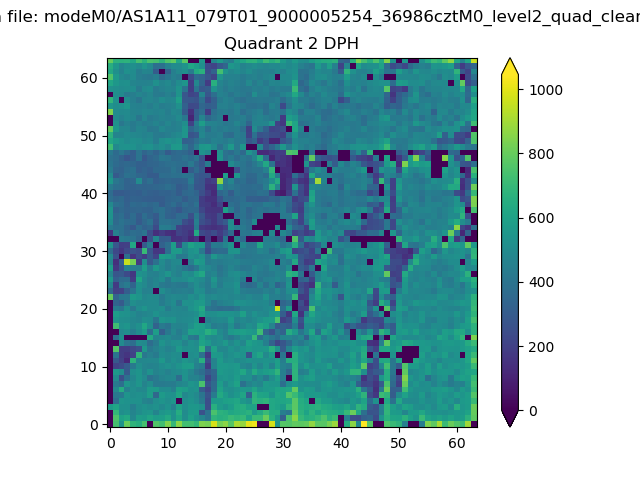
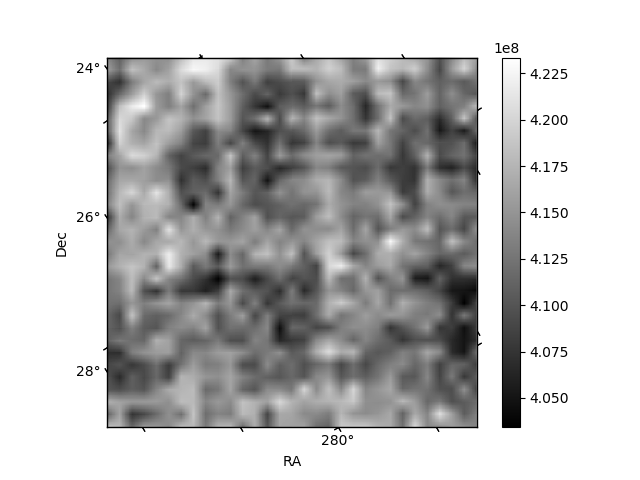
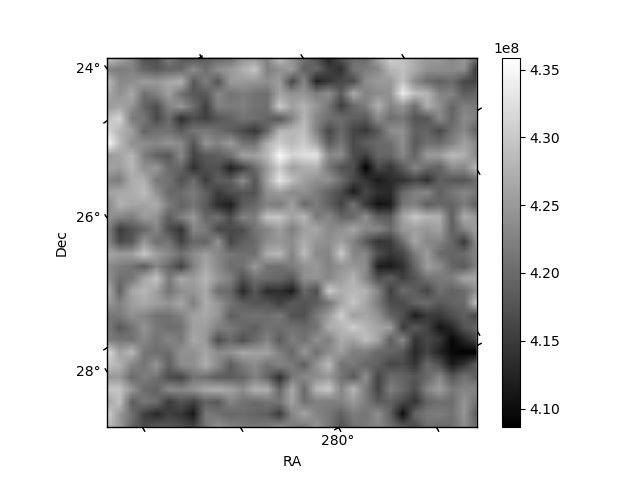
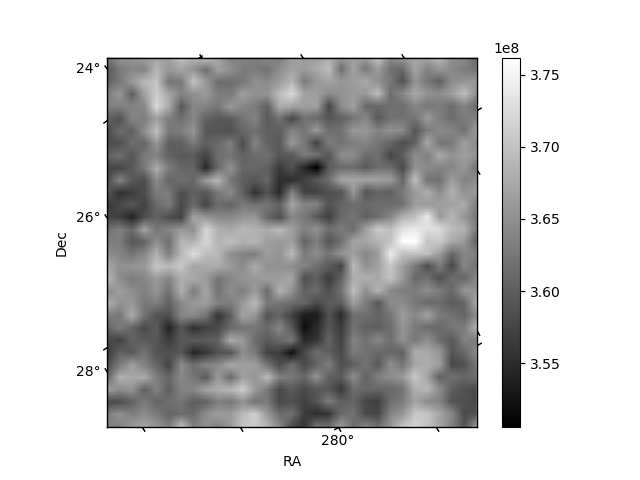
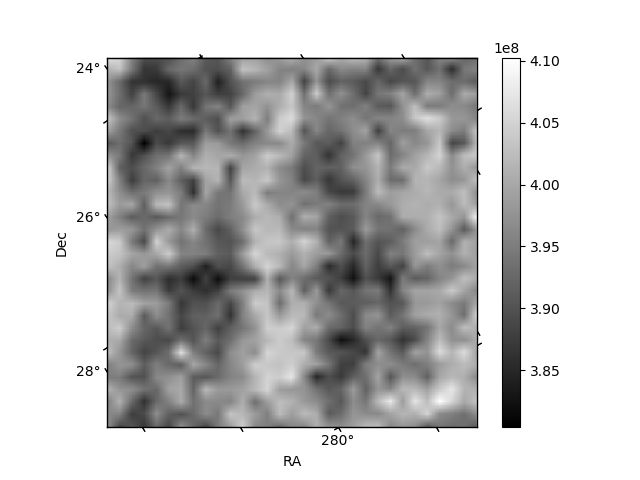
Histogram calculated using DETX and DETY for each event in the final _common_clean file
| Quadrant A |  |
 |
Quadrant B |
|---|---|---|---|
| Quadrant D |  |
 |
Quadrant C |
| Plot type | Count rate plots | Images |
|---|---|---|
| Comparison with Poisson distribution Blue bars denote a histogram of data divided into 1 sec bins. Red curve is a Poisson curve with rate = median count rate of data. |
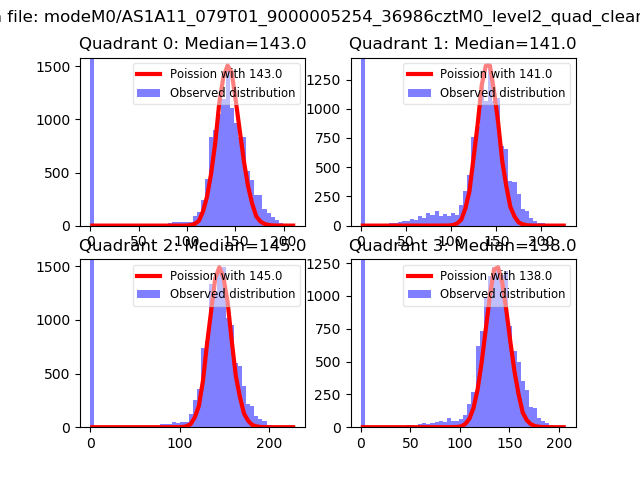 |
 |
| Quadrant-wise count rates Data is divided into 100 sec bins |
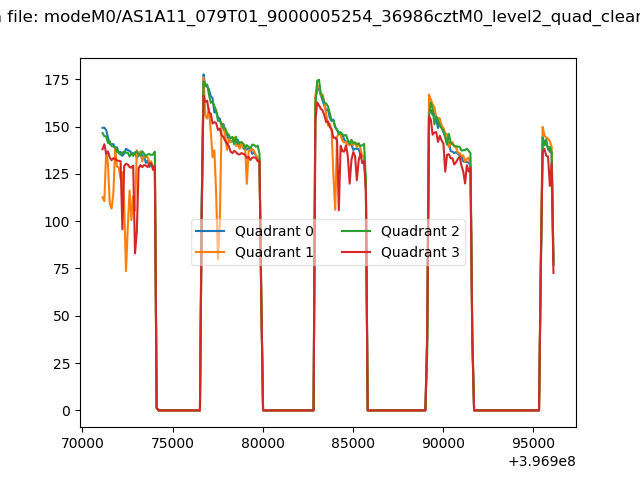 |
|
| Module-wise count rates for Quadrant A Data is divided into 100 sec bins |
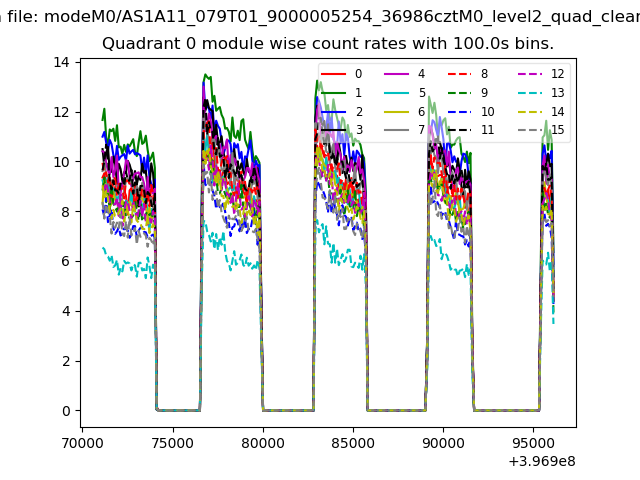 |
 |
| Module-wise count rates for Quadrant B Data is divided into 100 sec bins |
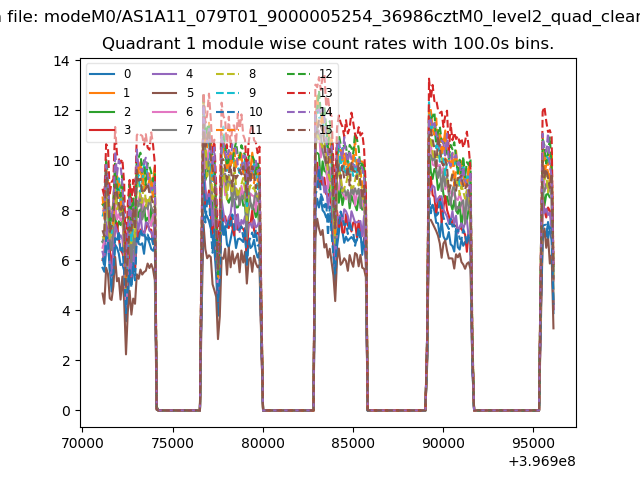 |
 |
| Module-wise count rates for Quadrant C Data is divided into 100 sec bins |
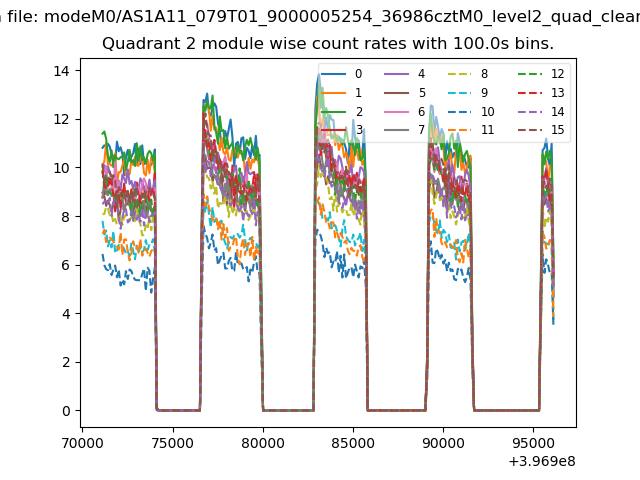 |
 |
| Module-wise count rates for Quadrant D Data is divided into 100 sec bins |
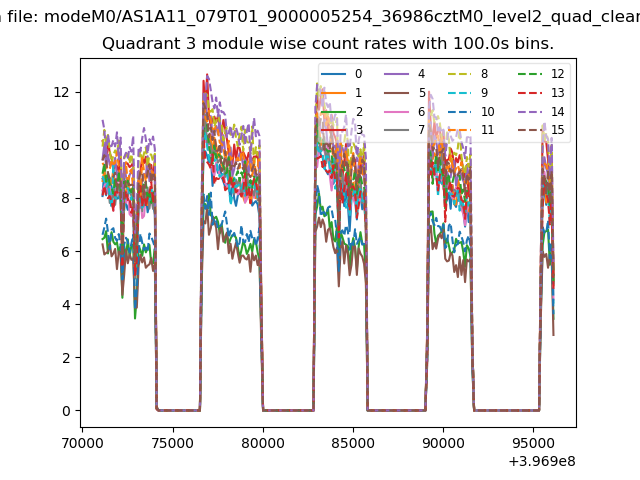 |
 |
| Parameter | Plot |
|---|---|
| CZT HV Monitor | 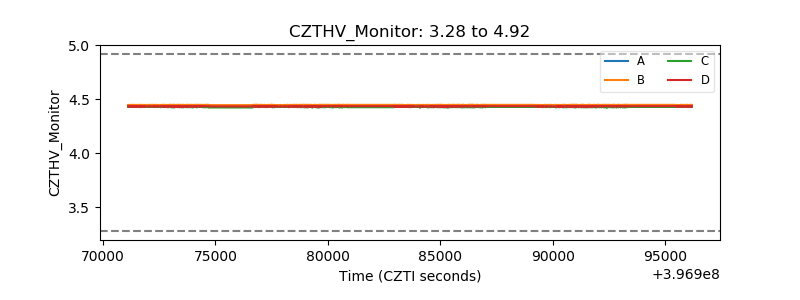 |
| D_VDD | 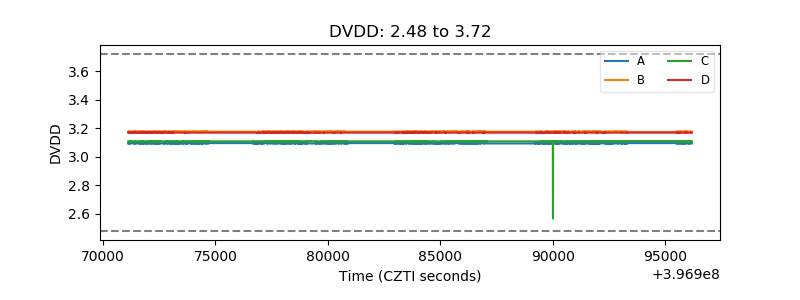 |
| Temperature 1 | 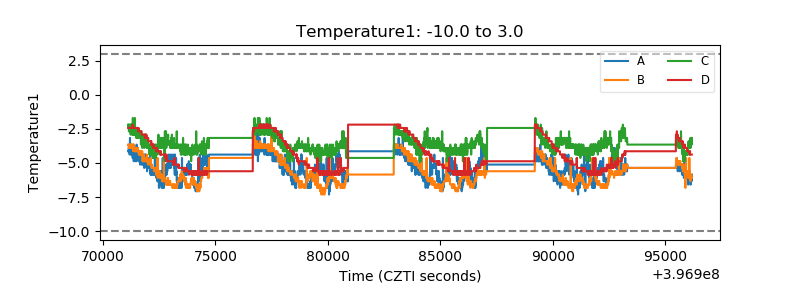 |
| Veto HV Monitor | 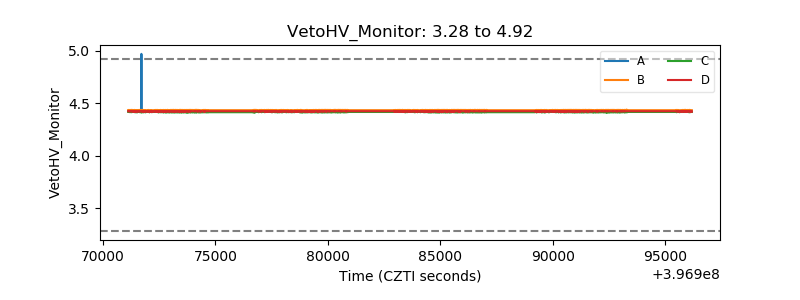 |
| Veto LLD | 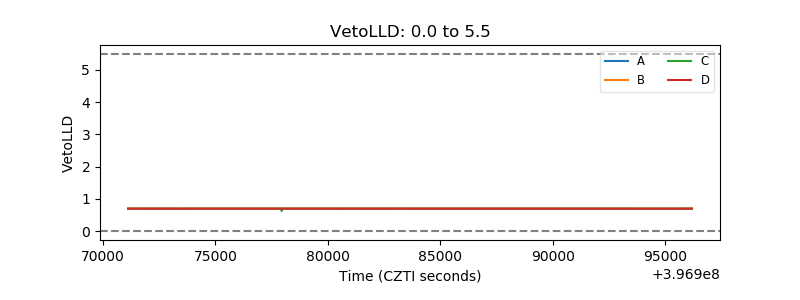 |
| Alpha Counter | 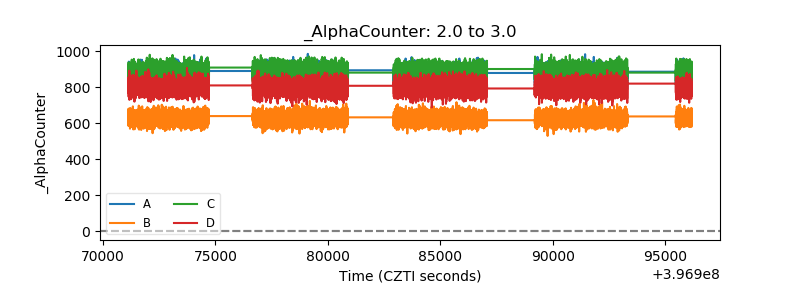 |
| _CPM_Rate | 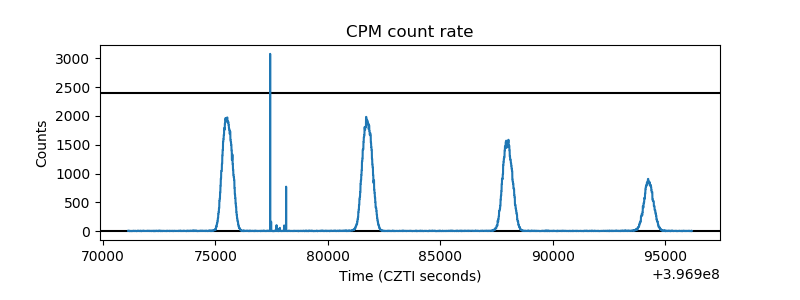 |
| CZT Counter | 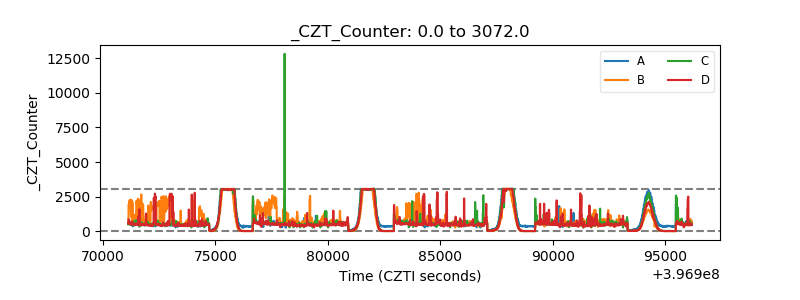 |
| +2.5 Volts monitor | 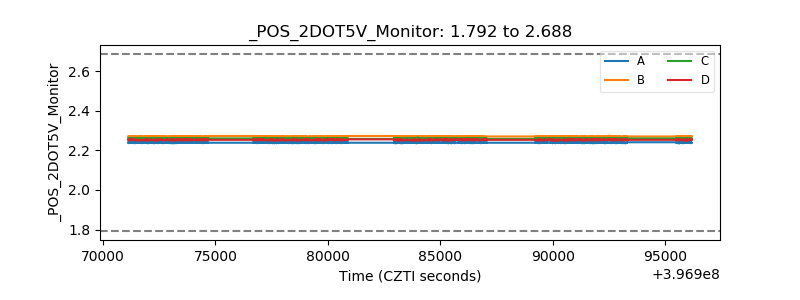 |
| +5 Volts monitor | 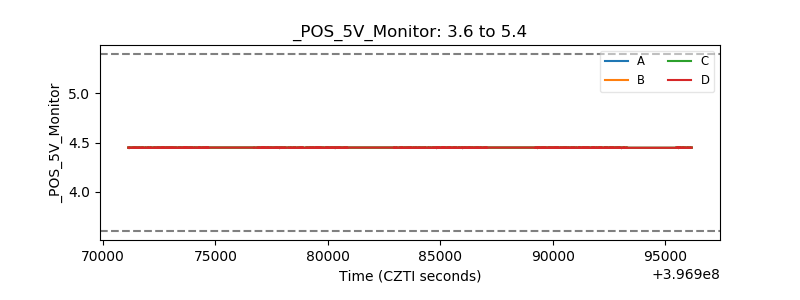 |
| _ROLL_ROT | 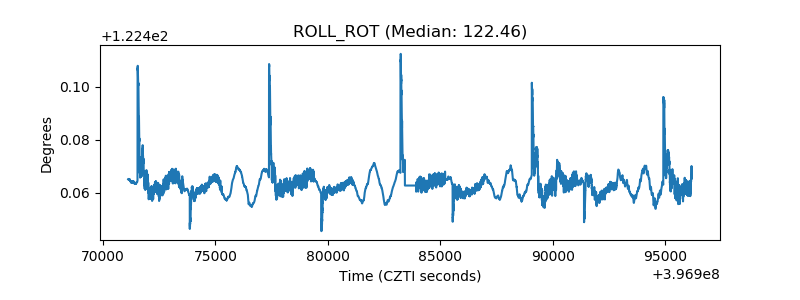 |
| _Roll_DEC | 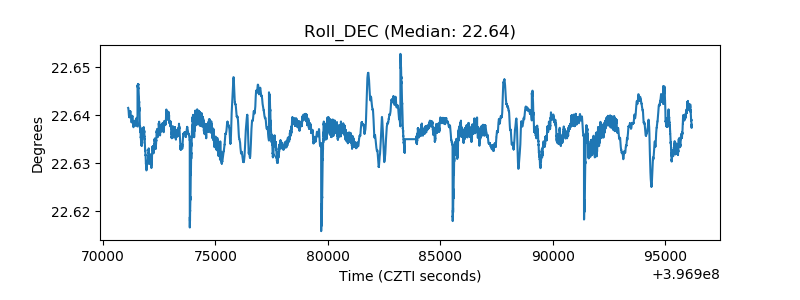 |
| _Roll_RA | 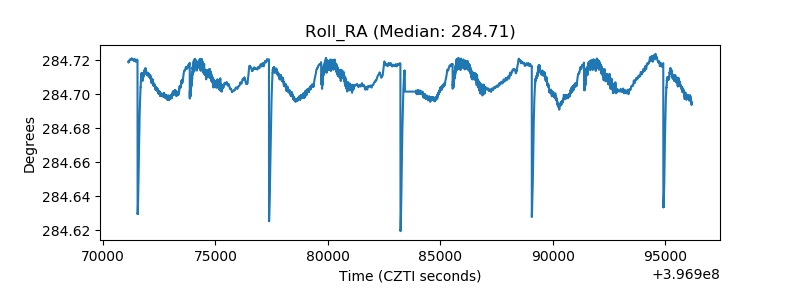 |
| Veto Counter | 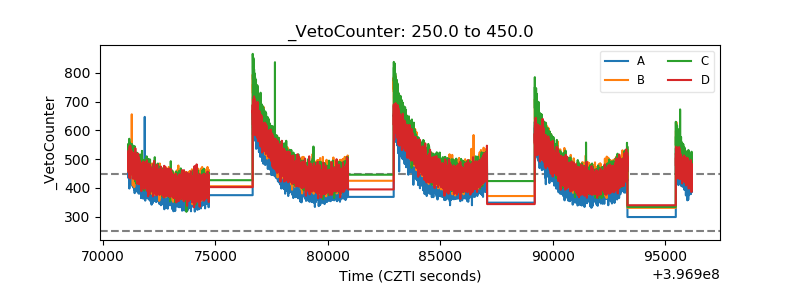 |