| Param | Original file | Final file |
|---|---|---|
| Filename | modeM0/AS1A11_079T01_9000005254_36987cztM0_level2.evt | modeM0/AS1A11_079T01_9000005254_36987cztM0_level2_quad_clean.evt |
| Size (bytes) | 394,565,760 | 60,217,920 |
| Size | 376.3 MB | 57.4 MB |
| Events in quadrant A | 2,891,290 | 364,061 |
| Events in quadrant B | 2,949,896 | 371,396 |
| Events in quadrant C | 3,035,427 | 368,575 |
| Events in quadrant D | 2,717,560 | 352,959 |
| Mode SS | |||
|---|---|---|---|
| Quadrant | BADHDUFLAG | Total packets | Discarded packets |
| A | 0 | 108 | 0 |
| B | 0 | 108 | 0 |
| C | 0 | 108 | 0 |
| D | 0 | 108 | 0 |
| Mode M9 | |||
|---|---|---|---|
| Quadrant | BADHDUFLAG | Total packets | Discarded packets |
| A | 0 | 42 | 0 |
| B | 0 | 42 | 0 |
| C | 0 | 42 | 0 |
| D | 0 | 42 | 0 |
| Mode M0 | |||
|---|---|---|---|
| Quadrant | BADHDUFLAG | Total packets | Discarded packets |
| A | 0 | 11870 | 6 |
| B | 0 | 12151 | 2 |
| C | 0 | 12206 | 10 |
| D | 0 | 11664 | 18 |
| Quadrant | Total seconds | Saturated seconds | Saturation percentage |
|---|---|---|---|
| A | 5229 | 11 | 0.210365% |
| B | 5231 | 51 | 0.974957% |
| C | 5230 | 77 | 1.472275% |
| D | 5224 | 59 | 1.129403% |
Noise dominated data is calculated using 1-second bins in cleaned event files. If a bin has >2000 counts, and if more than 50% of those come from <1% of pixels, then it is considered to be noise-dominated and hence unusable.
| Quadrant | # 1 sec bins | Bins with >0 counts | Bins with >2000 counts | High rate bins dominated by noise | Noise dominated (total time) | Noise dominated (detector-on time) | Marked lightcurve |
|---|---|---|---|---|---|---|---|
| A | 9418 | 5233 | 1 | 1 | 0.01% | 0.02% | 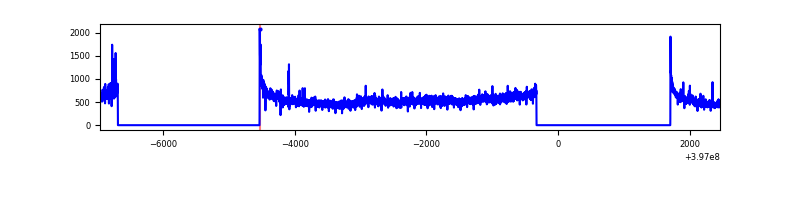 |
| B | 9418 | 5233 | 17 | 17 | 0.18% | 0.32% | 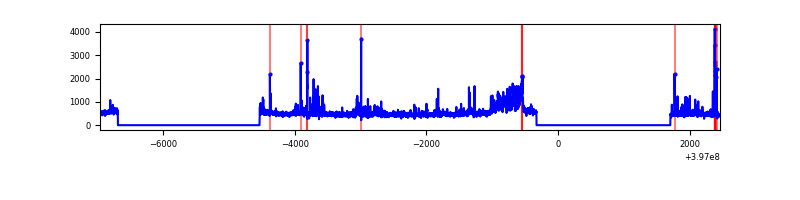 |
| C | 9418 | 5233 | 61 | 61 | 0.65% | 1.17% | 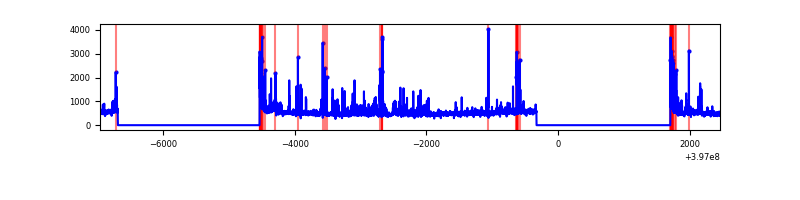 |
| D | 9418 | 5230 | 57 | 57 | 0.61% | 1.09% | 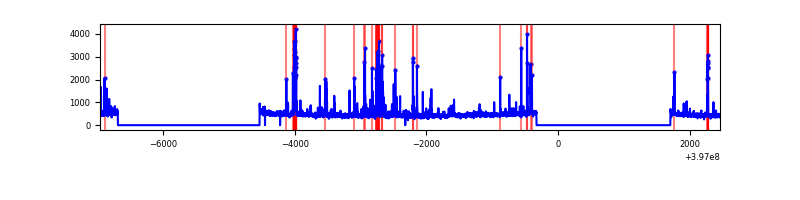 |
Top three noisy pixels from each quadrant. If the there are fewer than three noisy pixels in the level2.evt file, extra rows are filled as -1
| Pixel properties | Quadrant properties | ||||||
|---|---|---|---|---|---|---|---|
| Quadrant | DetID | PixID | Counts | Sigma | Mean | Median | Sigma |
| A | 15 | 222 | 323675 | 2690.2 | 603 | 593 | 120.1 |
| A | 10 | 83 | 214589 | 1781.88 | 603 | 593 | 120.1 |
| A | 9 | 143 | 14446 | 115.35 | 603 | 593 | 120.1 |
| B | 5 | 255 | 263233 | 2281.46 | 601 | 585 | 115.1 |
| B | 4 | 81 | 142312 | 1231.09 | 601 | 585 | 115.1 |
| B | 0 | 221 | 49591 | 425.68 | 601 | 585 | 115.1 |
| C | 15 | 214 | 224627 | 1629.11 | 590 | 596 | 137.5 |
| C | 0 | 207 | 178616 | 1294.53 | 590 | 596 | 137.5 |
| C | 0 | 10 | 172083 | 1247.02 | 590 | 596 | 137.5 |
| D | 12 | 6 | 319427 | 2230.12 | 586 | 572 | 143.0 |
| D | 2 | 250 | 43665 | 301.4 | 586 | 572 | 143.0 |
| D | 2 | 234 | 23381 | 159.53 | 586 | 572 | 143.0 |
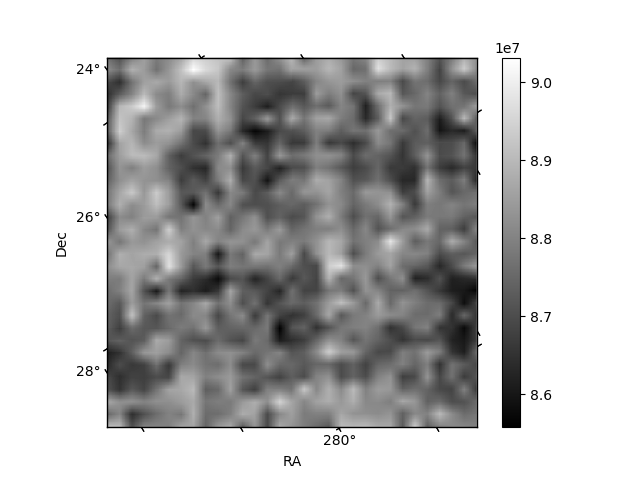
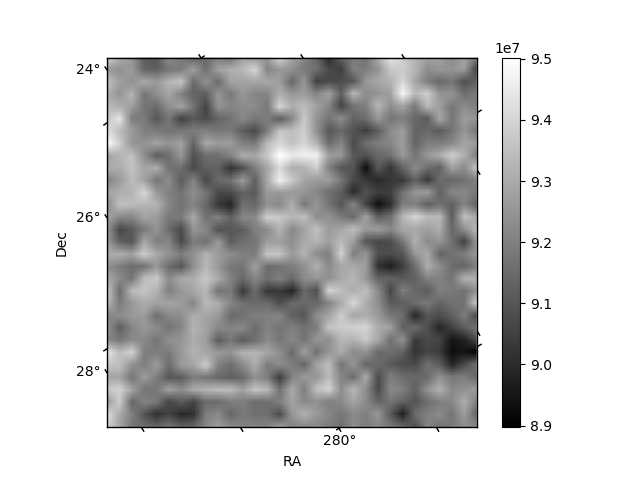
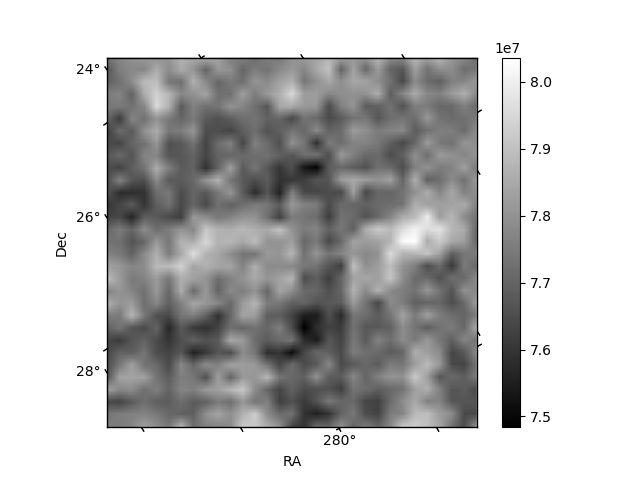
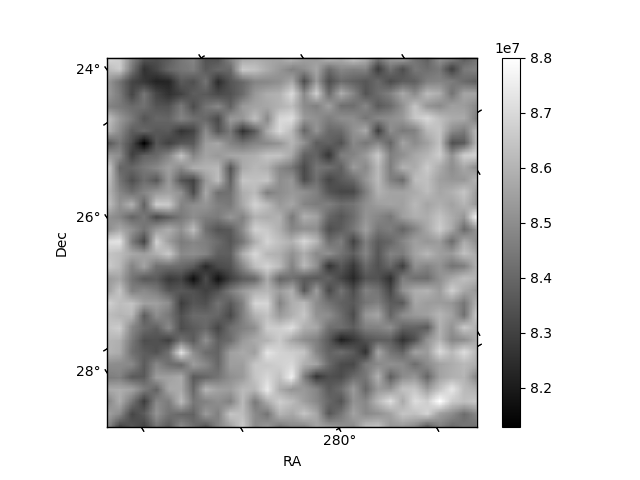
Histogram calculated using DETX and DETY for each event in the final _common_clean file
| Quadrant A | 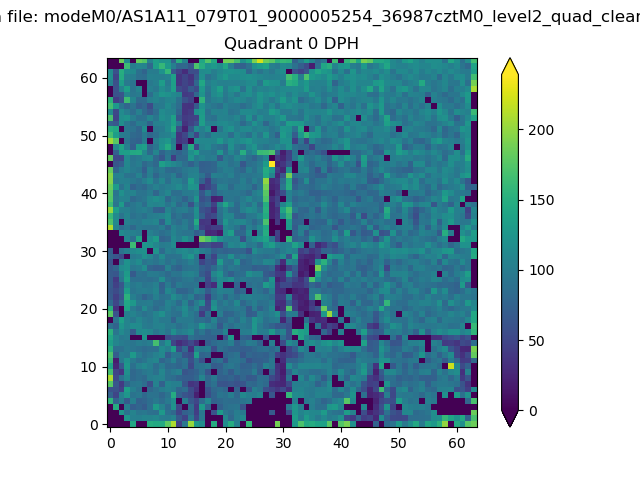 |
 |
Quadrant B |
|---|---|---|---|
| Quadrant D | 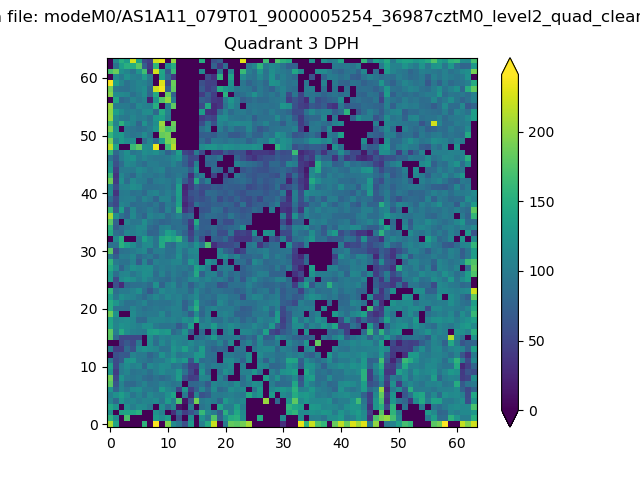 |
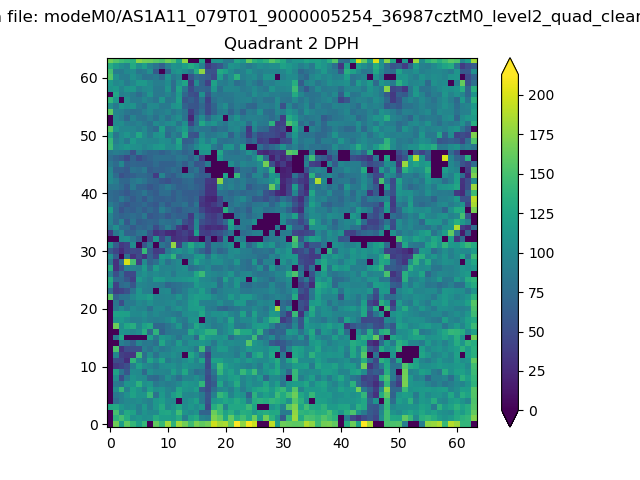 |
Quadrant C |
| Plot type | Count rate plots | Images |
|---|---|---|
| Comparison with Poisson distribution Blue bars denote a histogram of data divided into 1 sec bins. Red curve is a Poisson curve with rate = median count rate of data. |
 |
 |
| Quadrant-wise count rates Data is divided into 100 sec bins |
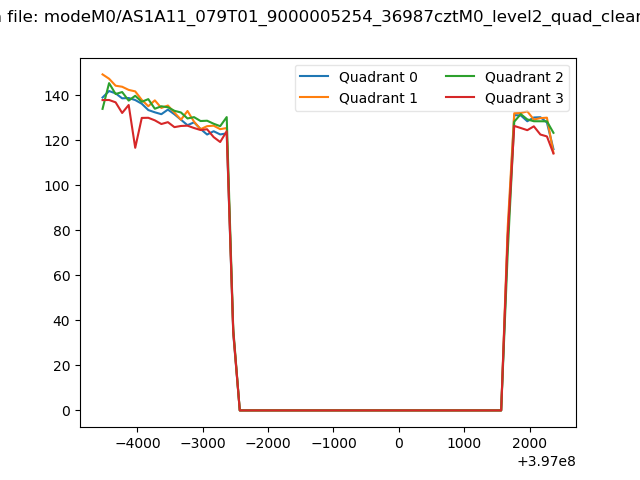 |
|
| Module-wise count rates for Quadrant A Data is divided into 100 sec bins |
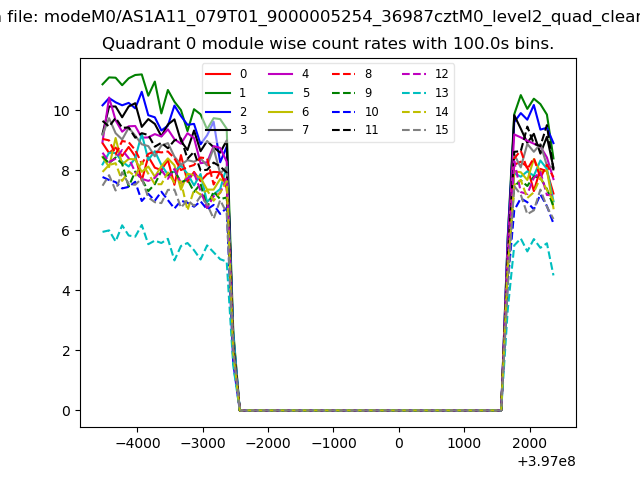 |
 |
| Module-wise count rates for Quadrant B Data is divided into 100 sec bins |
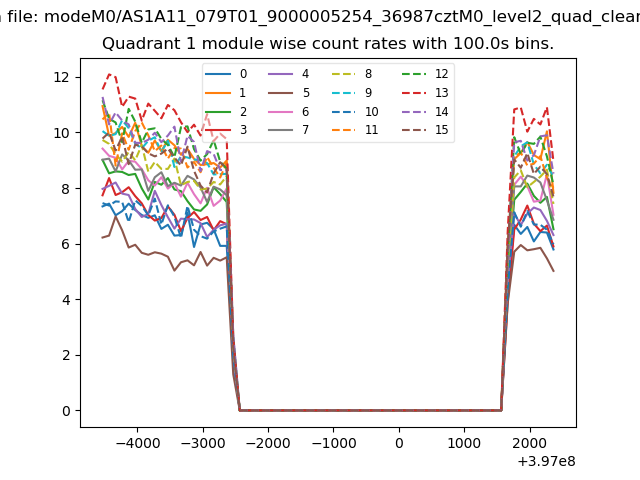 |
 |
| Module-wise count rates for Quadrant C Data is divided into 100 sec bins |
 |
 |
| Module-wise count rates for Quadrant D Data is divided into 100 sec bins |
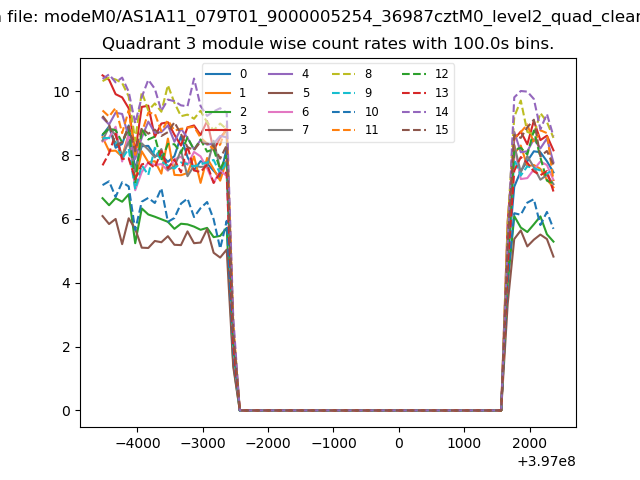 |
 |
| Parameter | Plot |
|---|---|
| CZT HV Monitor | 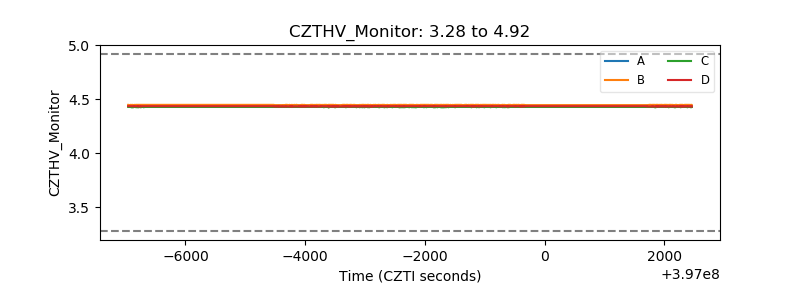 |
| D_VDD | 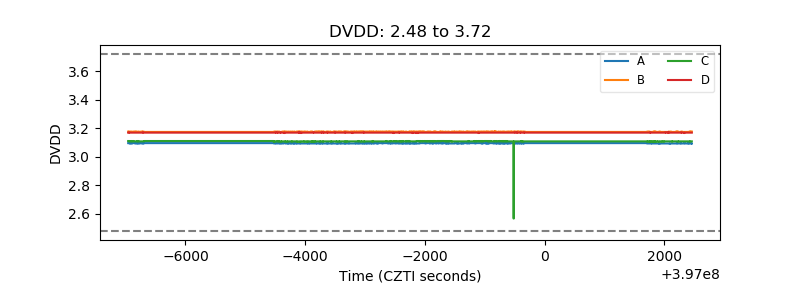 |
| Temperature 1 | 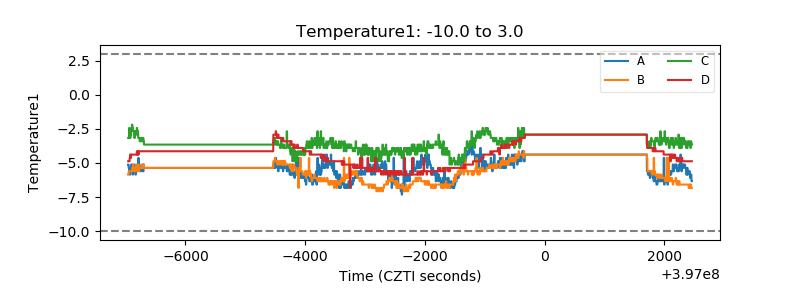 |
| Veto HV Monitor | 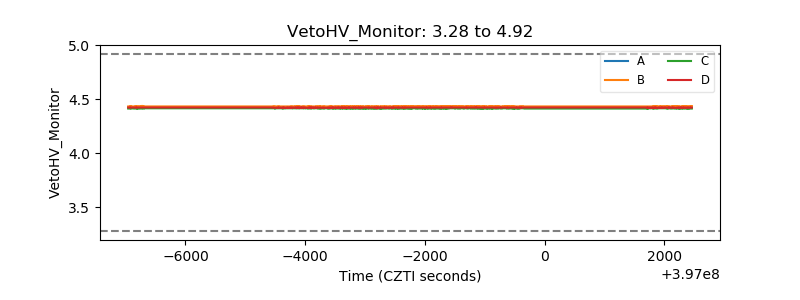 |
| Veto LLD | 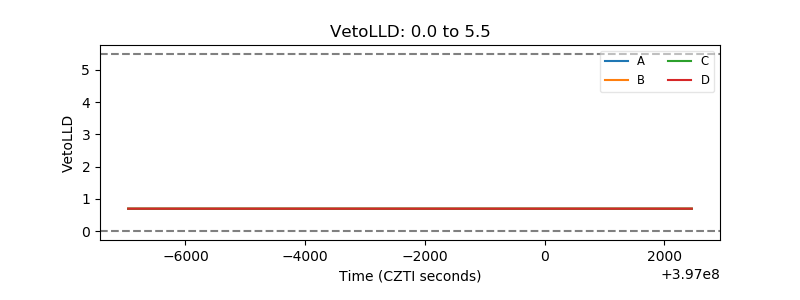 |
| Alpha Counter |  |
| _CPM_Rate | 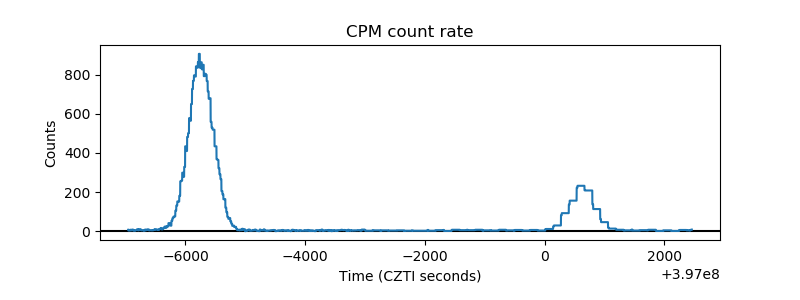 |
| CZT Counter |  |
| +2.5 Volts monitor | 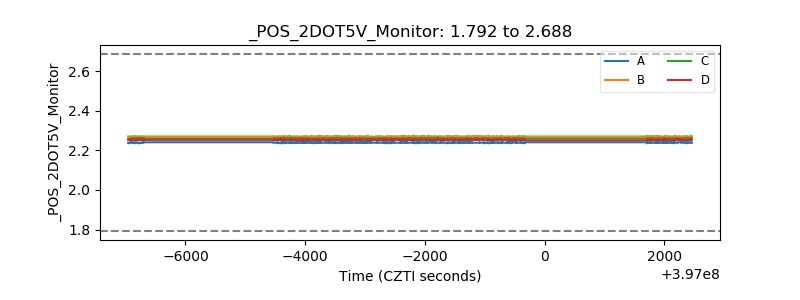 |
| +5 Volts monitor |  |
| _ROLL_ROT | 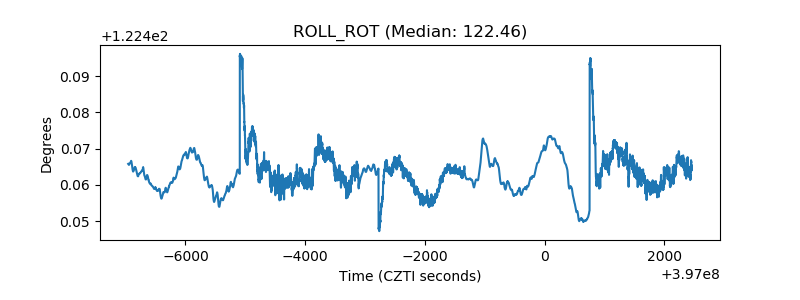 |
| _Roll_DEC | 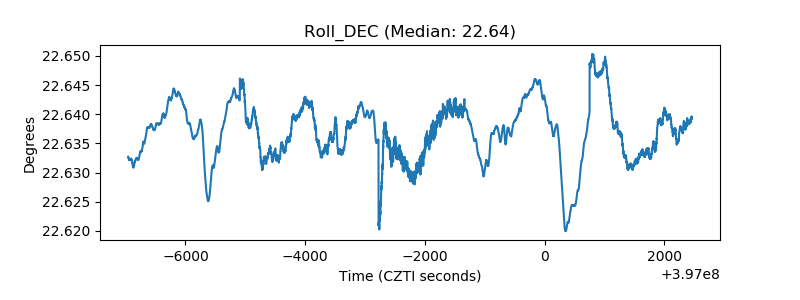 |
| _Roll_RA |  |
| Veto Counter | 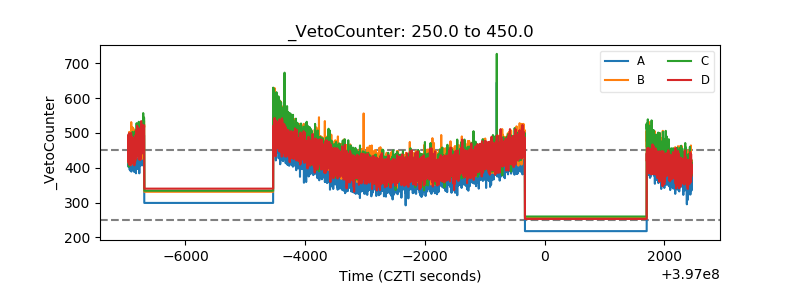 |