| Param | Original file | Final file |
|---|---|---|
| Filename | modeM0/AS1A11_079T01_9000005254_36988cztM0_level2.evt | modeM0/AS1A11_079T01_9000005254_36988cztM0_level2_quad_clean.evt |
| Size (bytes) | 407,073,600 | 62,406,720 |
| Size | 388.2 MB | 59.5 MB |
| Events in quadrant A | 2,715,022 | 385,737 |
| Events in quadrant B | 2,751,730 | 389,281 |
| Events in quadrant C | 2,764,288 | 388,615 |
| Events in quadrant D | 3,736,129 | 353,987 |
| Mode SS | |||
|---|---|---|---|
| Quadrant | BADHDUFLAG | Total packets | Discarded packets |
| A | 0 | 108 | 0 |
| B | 0 | 108 | 0 |
| C | 0 | 108 | 0 |
| D | 0 | 108 | 0 |
| Mode M9 | |||
|---|---|---|---|
| Quadrant | BADHDUFLAG | Total packets | Discarded packets |
| A | 0 | 29 | 0 |
| B | 0 | 29 | 0 |
| C | 0 | 29 | 0 |
| D | 0 | 30 | 0 |
| Mode M0 | |||
|---|---|---|---|
| Quadrant | BADHDUFLAG | Total packets | Discarded packets |
| A | 0 | 11266 | 3 |
| B | 0 | 11710 | 2 |
| C | 0 | 11499 | 2 |
| D | 0 | 14861 | 2 |
| Quadrant | Total seconds | Saturated seconds | Saturation percentage |
|---|---|---|---|
| A | 5309 | 12 | 0.226031% |
| B | 5309 | 59 | 1.111320% |
| C | 5309 | 42 | 0.791109% |
| D | 5309 | 436 | 8.212469% |
Noise dominated data is calculated using 1-second bins in cleaned event files. If a bin has >2000 counts, and if more than 50% of those come from <1% of pixels, then it is considered to be noise-dominated and hence unusable.
| Quadrant | # 1 sec bins | Bins with >0 counts | Bins with >2000 counts | High rate bins dominated by noise | Noise dominated (total time) | Noise dominated (detector-on time) | Marked lightcurve |
|---|---|---|---|---|---|---|---|
| A | 7101 | 5310 | 2 | 2 | 0.03% | 0.04% | 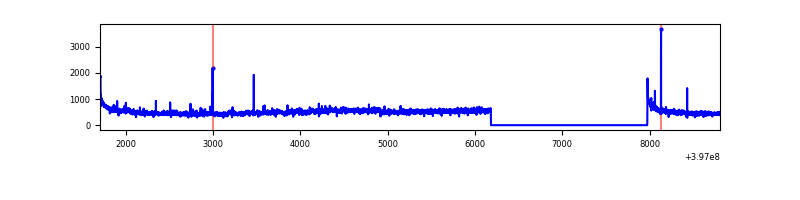 |
| B | 7101 | 5310 | 35 | 35 | 0.49% | 0.66% | 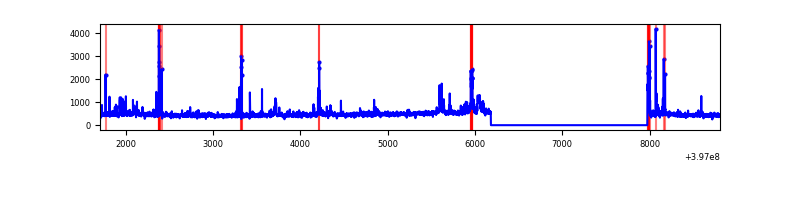 |
| C | 7101 | 5310 | 34 | 34 | 0.48% | 0.64% | 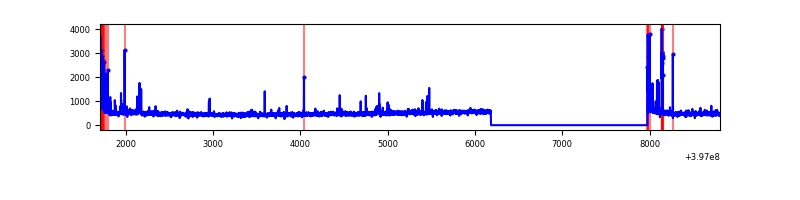 |
| D | 7101 | 5310 | 423 | 423 | 5.96% | 7.97% | 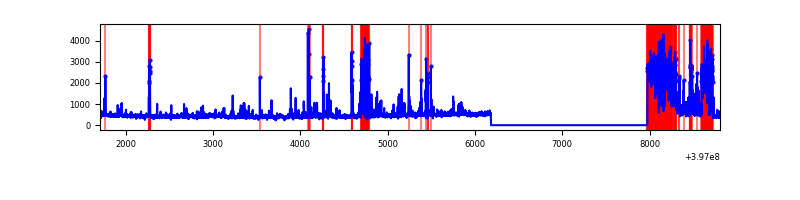 |
Top three noisy pixels from each quadrant. If the there are fewer than three noisy pixels in the level2.evt file, extra rows are filled as -1
| Pixel properties | Quadrant properties | ||||||
|---|---|---|---|---|---|---|---|
| Quadrant | DetID | PixID | Counts | Sigma | Mean | Median | Sigma |
| A | 10 | 83 | 214192 | 1761.17 | 597 | 586 | 121.3 |
| A | 15 | 222 | 151520 | 1244.44 | 597 | 586 | 121.3 |
| A | 9 | 143 | 23591 | 189.67 | 597 | 586 | 121.3 |
| B | 5 | 184 | 205566 | 1777.58 | 593 | 576 | 115.3 |
| B | 4 | 81 | 53239 | 456.67 | 593 | 576 | 115.3 |
| B | 0 | 221 | 38591 | 329.65 | 593 | 576 | 115.3 |
| C | 15 | 214 | 226530 | 1658.35 | 585 | 590 | 136.2 |
| C | 0 | 10 | 147218 | 1076.22 | 585 | 590 | 136.2 |
| C | 14 | 254 | 49316 | 357.64 | 585 | 590 | 136.2 |
| D | 12 | 6 | 1170904 | 8419.47 | 564 | 549 | 139.0 |
| D | 12 | 17 | 228812 | 1642.11 | 564 | 549 | 139.0 |
| D | 10 | 118 | 83578 | 597.3 | 564 | 549 | 139.0 |
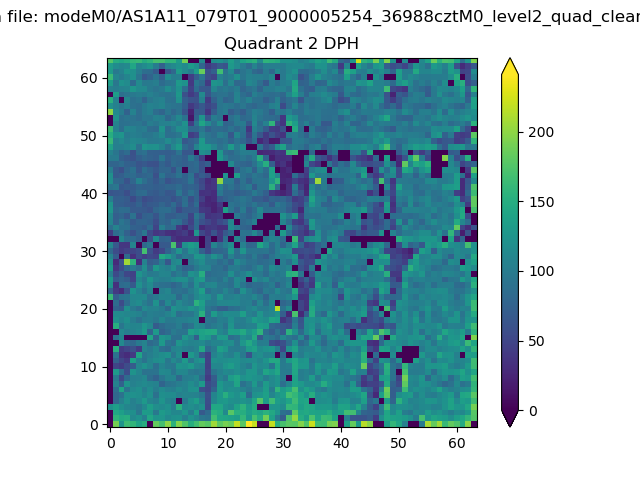
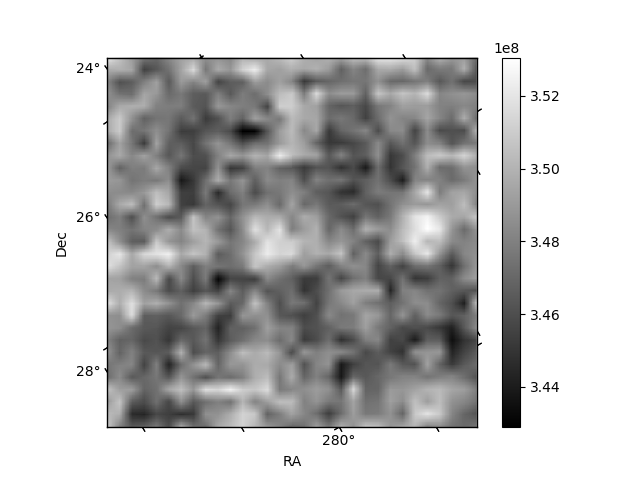
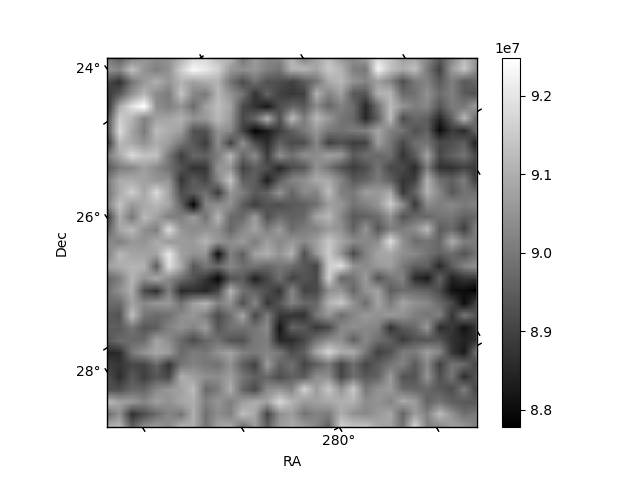
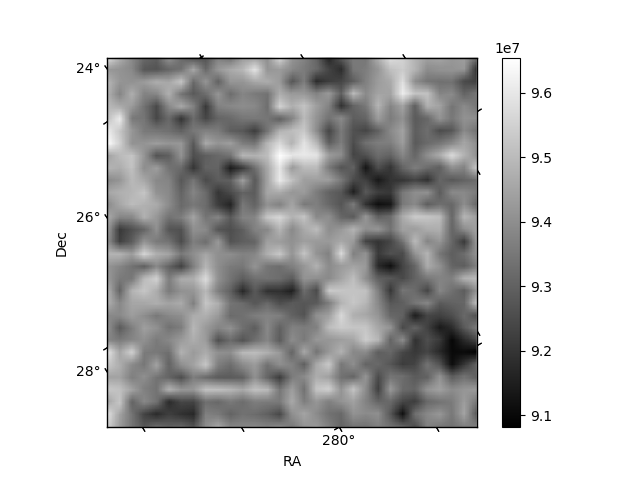
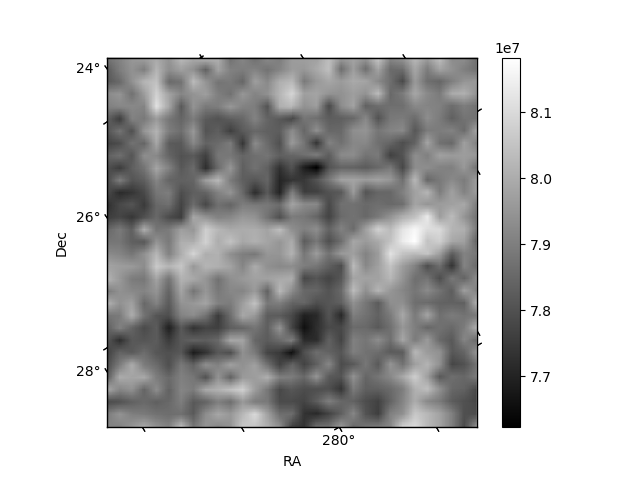
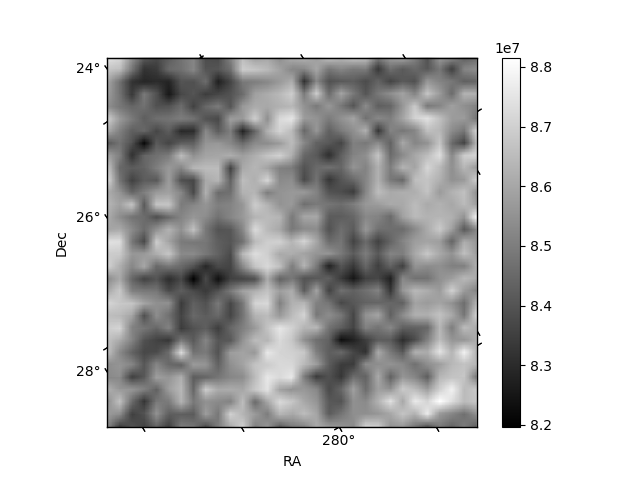
Histogram calculated using DETX and DETY for each event in the final _common_clean file
| Quadrant A | 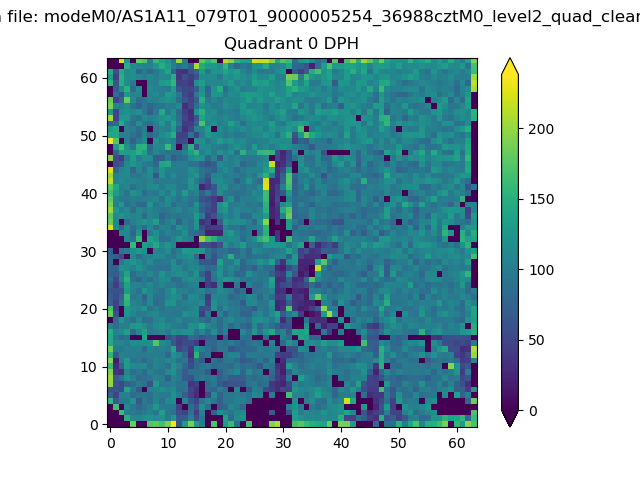 |
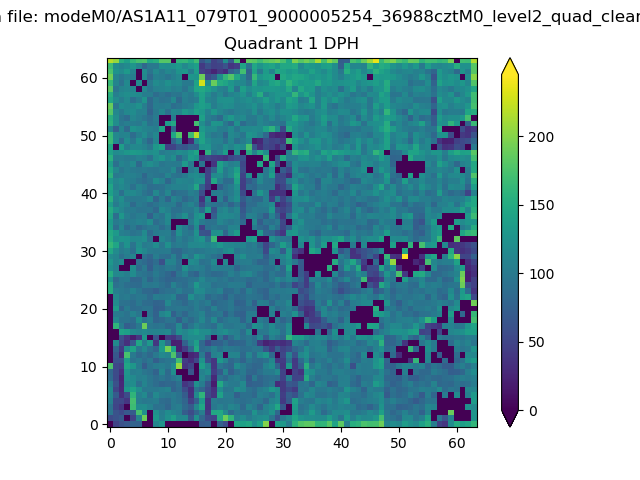 |
Quadrant B |
|---|---|---|---|
| Quadrant D | 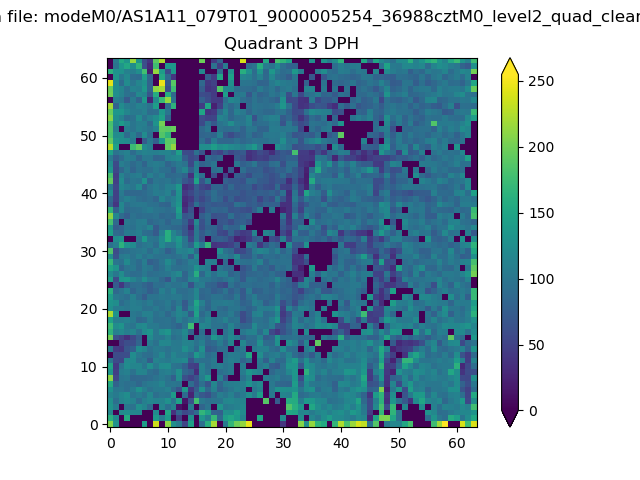 |
 |
Quadrant C |
| Plot type | Count rate plots | Images |
|---|---|---|
| Comparison with Poisson distribution Blue bars denote a histogram of data divided into 1 sec bins. Red curve is a Poisson curve with rate = median count rate of data. |
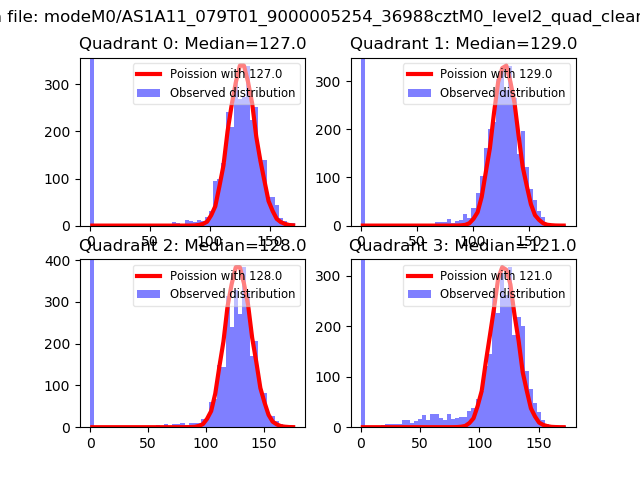 |
 |
| Quadrant-wise count rates Data is divided into 100 sec bins |
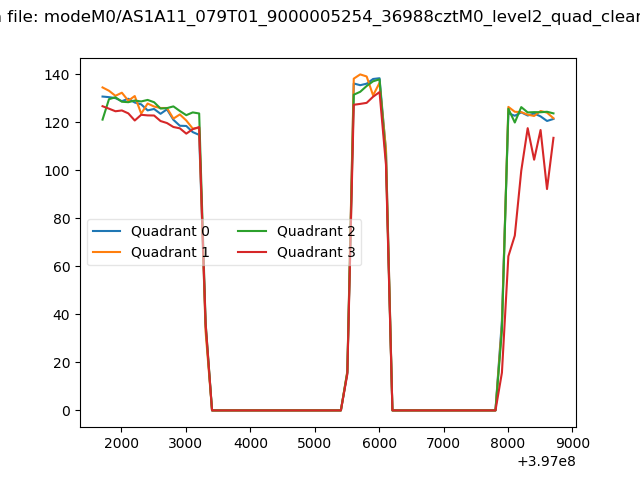 |
|
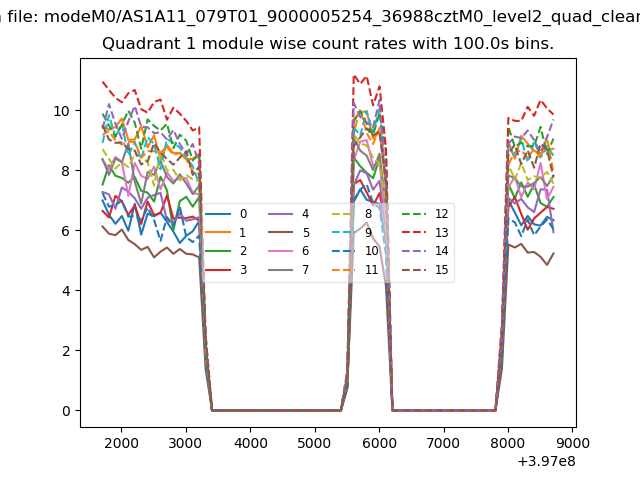
| Module-wise count rates for Quadrant A Data is divided into 100 sec bins |
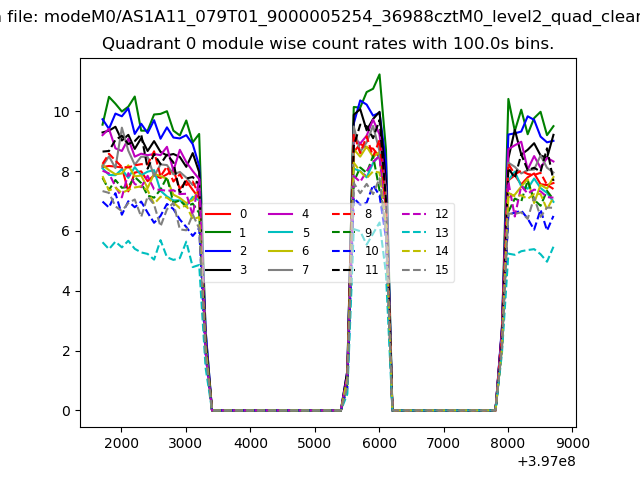 |
 |
| Module-wise count rates for Quadrant B Data is divided into 100 sec bins |
 |
 |
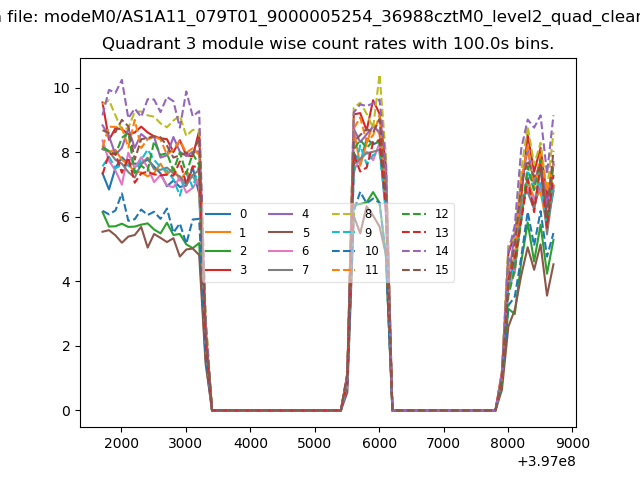
| Module-wise count rates for Quadrant C Data is divided into 100 sec bins |
 |
 |
| Module-wise count rates for Quadrant D Data is divided into 100 sec bins |
 |
 |
| Parameter | Plot |
|---|---|
| CZT HV Monitor | 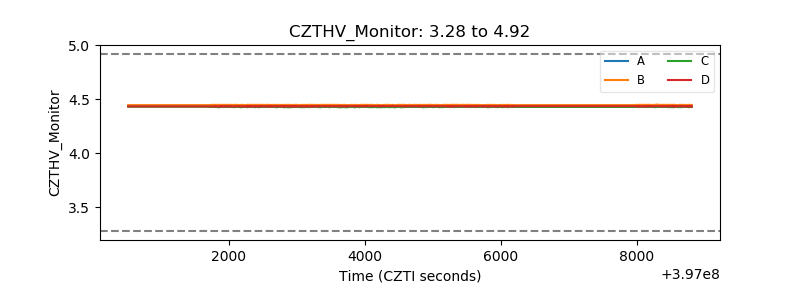 |
| D_VDD |  |
| Temperature 1 | 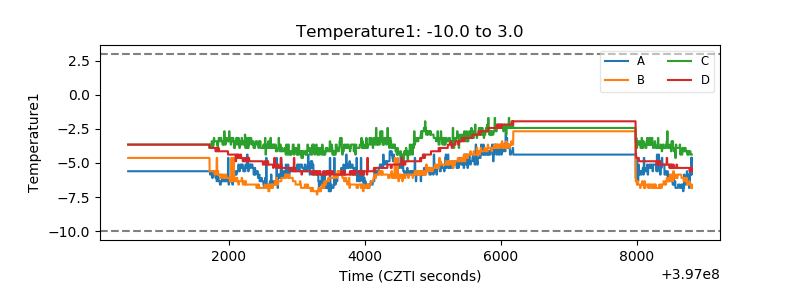 |
| Veto HV Monitor | 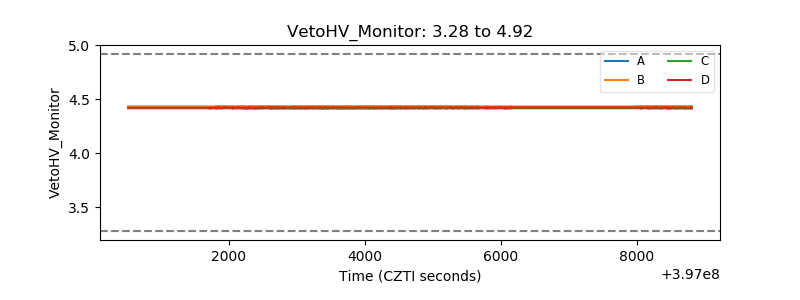 |
| Veto LLD | 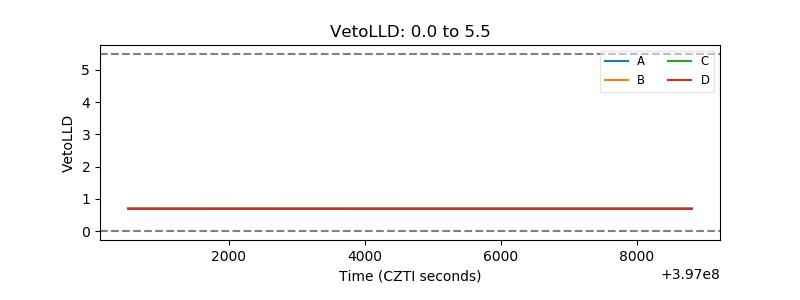 |
| Alpha Counter | 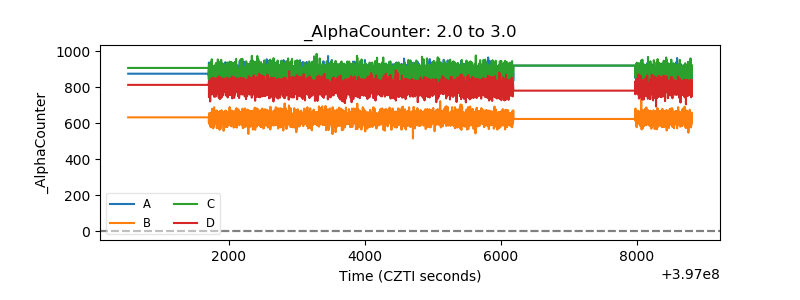 |
| _CPM_Rate | 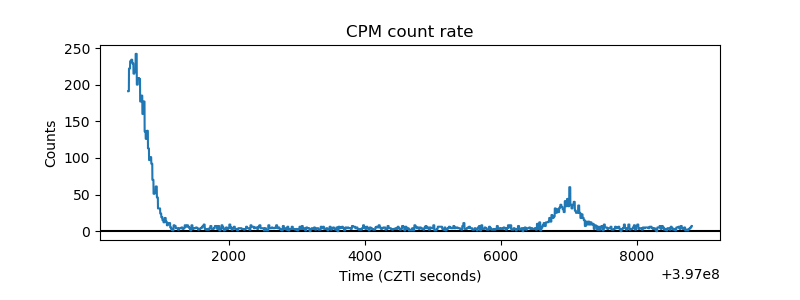 |
| CZT Counter | 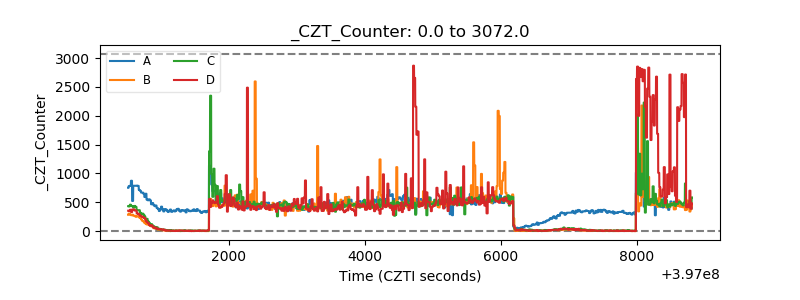 |
| +2.5 Volts monitor | 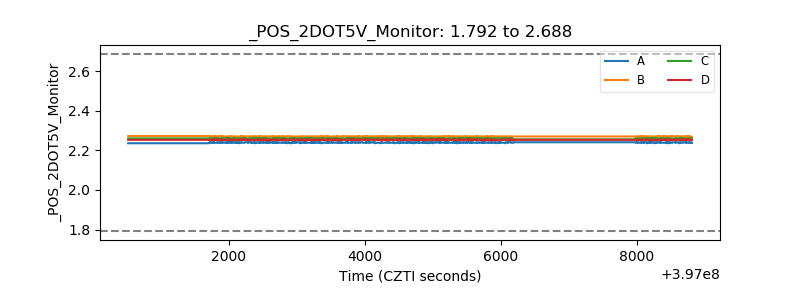 |
| +5 Volts monitor | 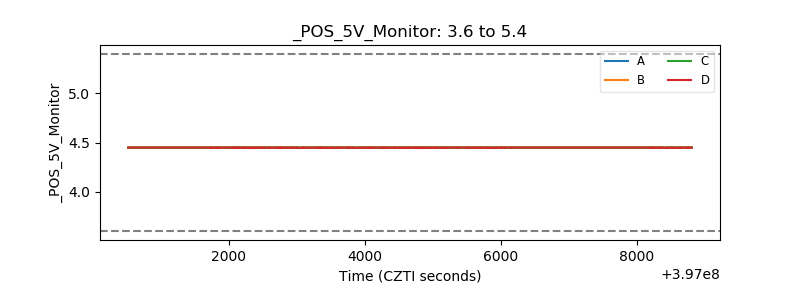 |
| _ROLL_ROT | 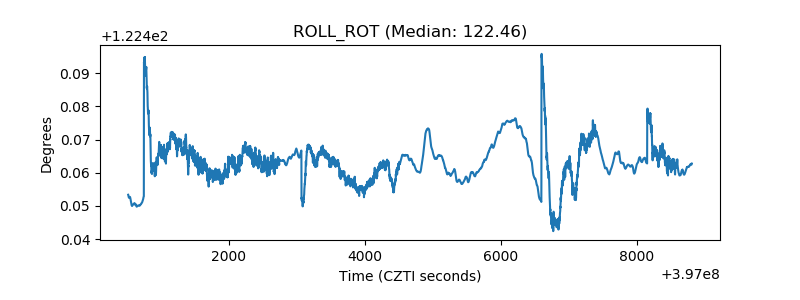 |
| _Roll_DEC | 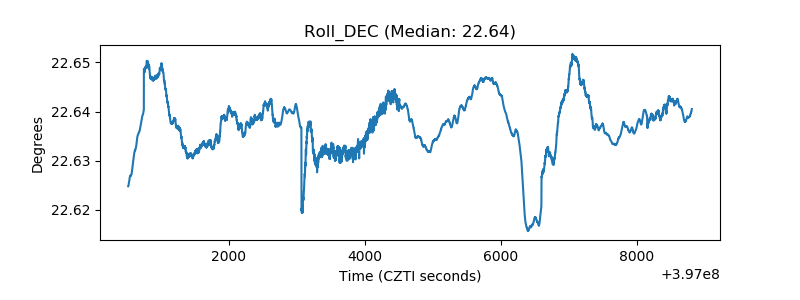 |
| _Roll_RA | 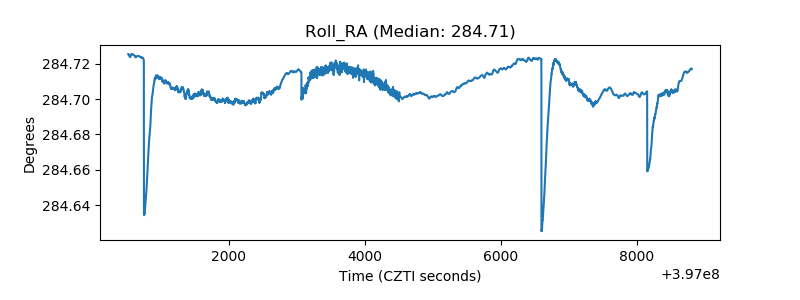 |
| Veto Counter |  |