| Param | Original file | Final file |
|---|---|---|
| Filename | modeM0/AS1A11_079T01_9000005254_36989cztM0_level2.evt | modeM0/AS1A11_079T01_9000005254_36989cztM0_level2_quad_clean.evt |
| Size (bytes) | 742,458,240 | 111,360,960 |
| Size | 708.1 MB | 106.2 MB |
| Events in quadrant A | 4,841,161 | 680,883 |
| Events in quadrant B | 5,647,735 | 684,972 |
| Events in quadrant C | 5,167,390 | 688,993 |
| Events in quadrant D | 6,167,850 | 640,422 |
| Mode SS | |||
|---|---|---|---|
| Quadrant | BADHDUFLAG | Total packets | Discarded packets |
| A | 0 | 210 | 8 |
| B | 0 | 210 | 8 |
| C | 0 | 210 | 10 |
| D | 0 | 210 | 12 |
| Mode M9 | |||
|---|---|---|---|
| Quadrant | BADHDUFLAG | Total packets | Discarded packets |
| A | 0 | 44 | 0 |
| B | 0 | 45 | 1 |
| C | 0 | 44 | 0 |
| D | 0 | 45 | 0 |
| Mode M0 | |||
|---|---|---|---|
| Quadrant | BADHDUFLAG | Total packets | Discarded packets |
| A | 0 | 21369 | 1021 |
| B | 0 | 24416 | 1230 |
| C | 0 | 22270 | 990 |
| D | 0 | 26345 | 1198 |
| Quadrant | Total seconds | Saturated seconds | Saturation percentage |
|---|---|---|---|
| A | 9749 | 26 | 0.266694% |
| B | 9765 | 159 | 1.628264% |
| C | 9782 | 87 | 0.889389% |
| D | 9750 | 520 | 5.333333% |
Noise dominated data is calculated using 1-second bins in cleaned event files. If a bin has >2000 counts, and if more than 50% of those come from <1% of pixels, then it is considered to be noise-dominated and hence unusable.
| Quadrant | # 1 sec bins | Bins with >0 counts | Bins with >2000 counts | High rate bins dominated by noise | Noise dominated (total time) | Noise dominated (detector-on time) | Marked lightcurve |
|---|---|---|---|---|---|---|---|
| A | 13516 | 9841 | 3 | 3 | 0.02% | 0.03% | 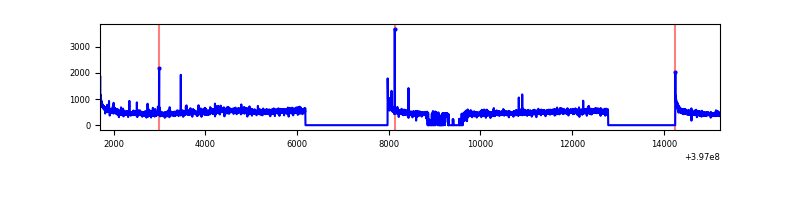 |
| B | 13516 | 9858 | 106 | 106 | 0.78% | 1.08% | 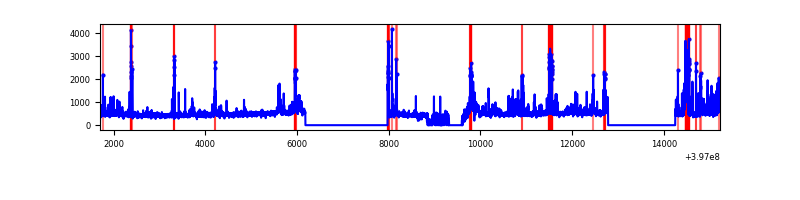 |
| C | 13516 | 9882 | 76 | 76 | 0.56% | 0.77% | 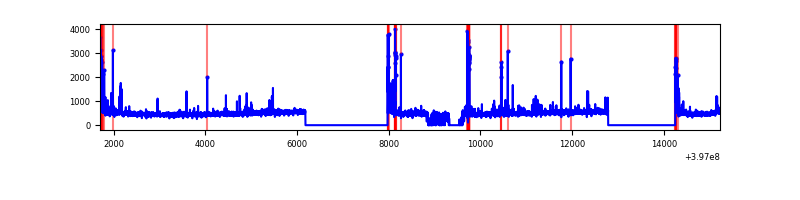 |
| D | 13516 | 9856 | 499 | 499 | 3.69% | 5.06% | 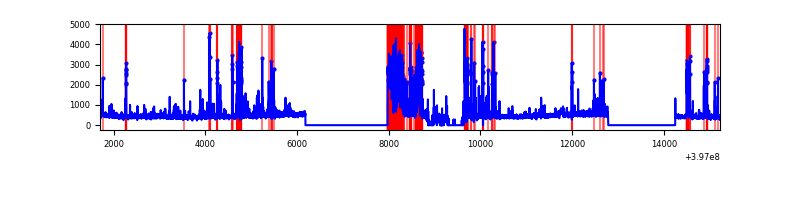 |
Top three noisy pixels from each quadrant. If the there are fewer than three noisy pixels in the level2.evt file, extra rows are filled as -1
| Pixel properties | Quadrant properties | ||||||
|---|---|---|---|---|---|---|---|
| Quadrant | DetID | PixID | Counts | Sigma | Mean | Median | Sigma |
| A | 10 | 83 | 356623 | 1598.64 | 1107 | 1085 | 222.4 |
| A | 15 | 222 | 152944 | 682.82 | 1107 | 1085 | 222.4 |
| A | 9 | 143 | 26098 | 112.47 | 1107 | 1085 | 222.4 |
| B | 5 | 184 | 738997 | 3481.06 | 1096 | 1067 | 212.0 |
| B | 4 | 81 | 136659 | 639.63 | 1096 | 1067 | 212.0 |
| B | 4 | 232 | 120372 | 562.8 | 1096 | 1067 | 212.0 |
| C | 15 | 214 | 411322 | 1640.0 | 1084 | 1094 | 250.1 |
| C | 0 | 10 | 244620 | 973.56 | 1084 | 1094 | 250.1 |
| C | 14 | 254 | 151500 | 601.29 | 1084 | 1094 | 250.1 |
| D | 12 | 6 | 1179243 | 4549.43 | 1058 | 1032 | 259.0 |
| D | 12 | 17 | 378469 | 1457.4 | 1058 | 1032 | 259.0 |
| D | 13 | 249 | 234991 | 903.39 | 1058 | 1032 | 259.0 |
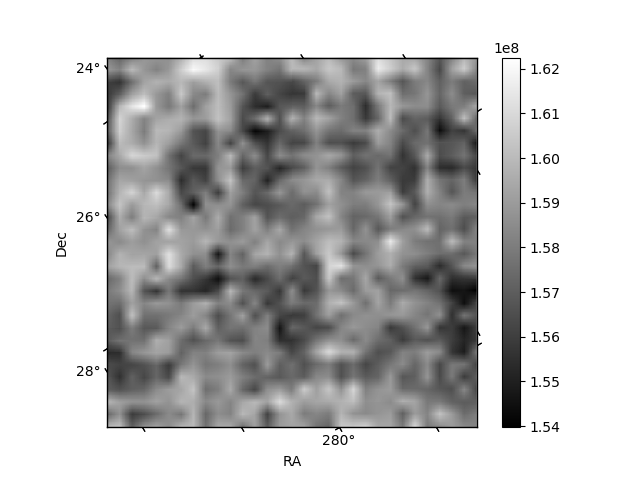
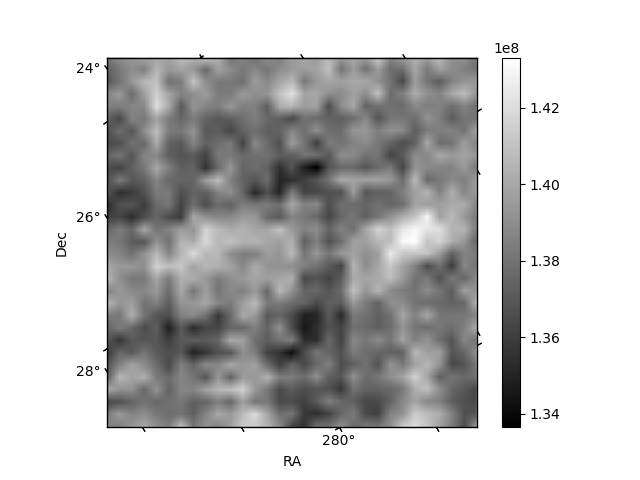
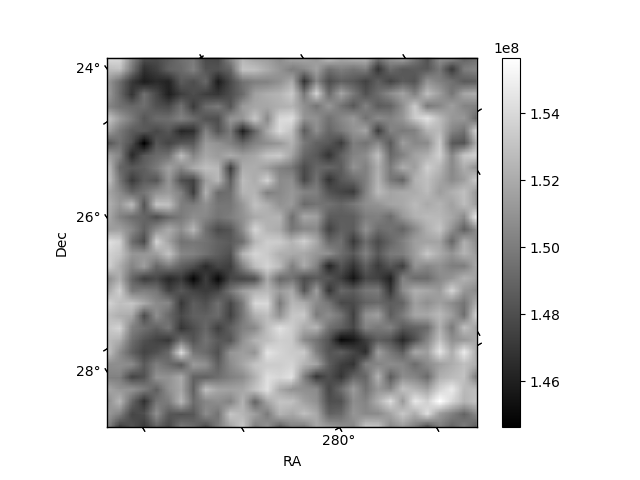
Histogram calculated using DETX and DETY for each event in the final _common_clean file
| Quadrant A |  |
 |
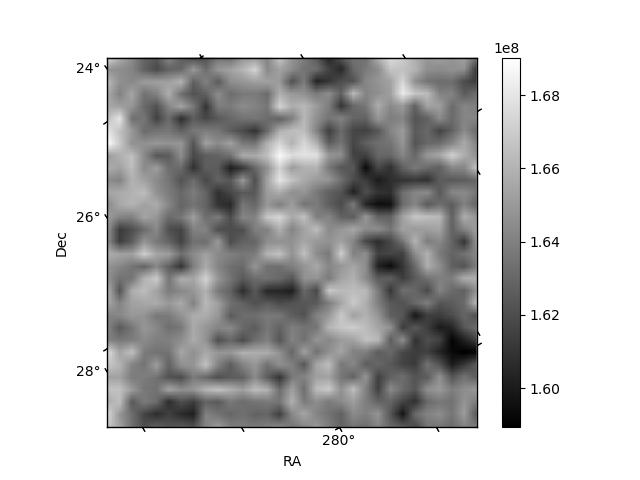
Quadrant B |
|---|---|---|---|
| Quadrant D |  |
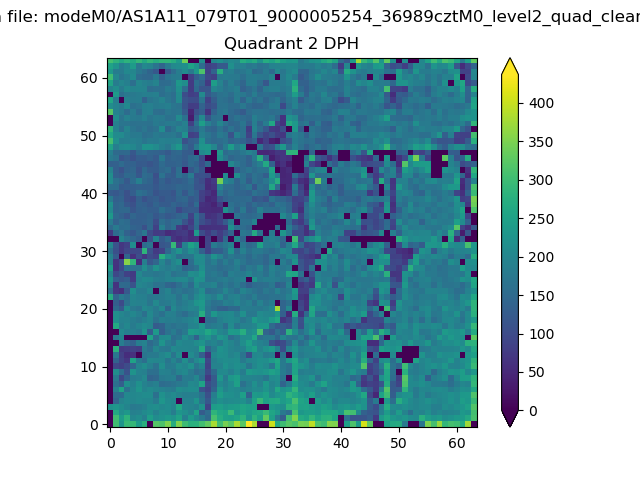 |
Quadrant C |
| Plot type | Count rate plots | Images |
|---|---|---|
| Comparison with Poisson distribution Blue bars denote a histogram of data divided into 1 sec bins. Red curve is a Poisson curve with rate = median count rate of data. |
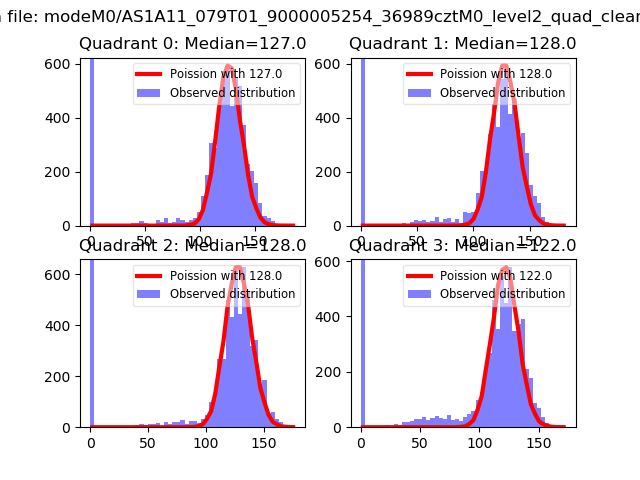 |
 |
| Quadrant-wise count rates Data is divided into 100 sec bins |
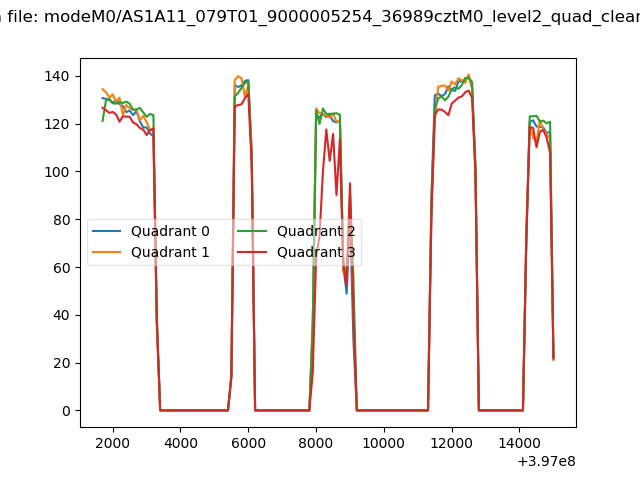 |
|
| Module-wise count rates for Quadrant A Data is divided into 100 sec bins |
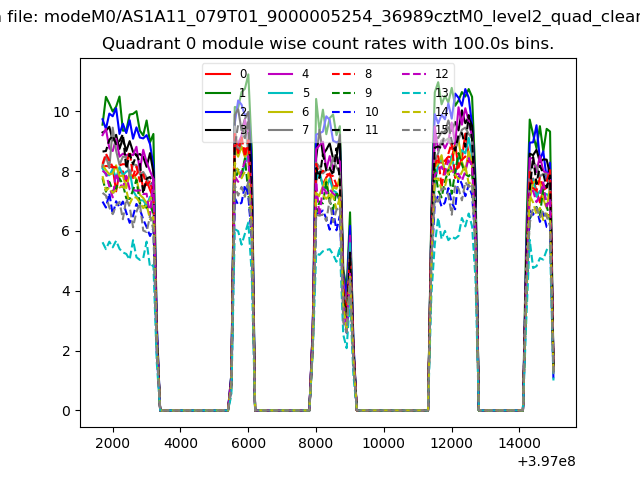 |
 |
| Module-wise count rates for Quadrant B Data is divided into 100 sec bins |
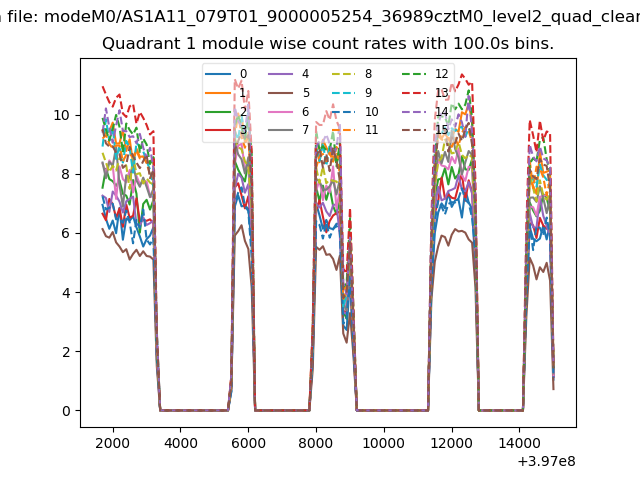 |
 |
| Module-wise count rates for Quadrant C Data is divided into 100 sec bins |
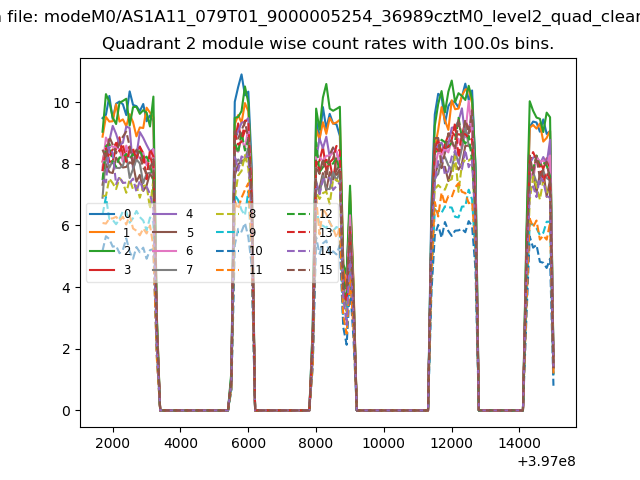 |
 |
| Module-wise count rates for Quadrant D Data is divided into 100 sec bins |
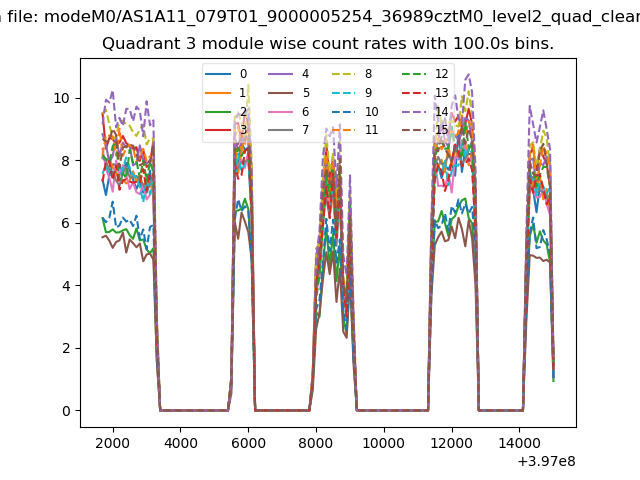 |
 |
| Parameter | Plot |
|---|---|
| CZT HV Monitor | 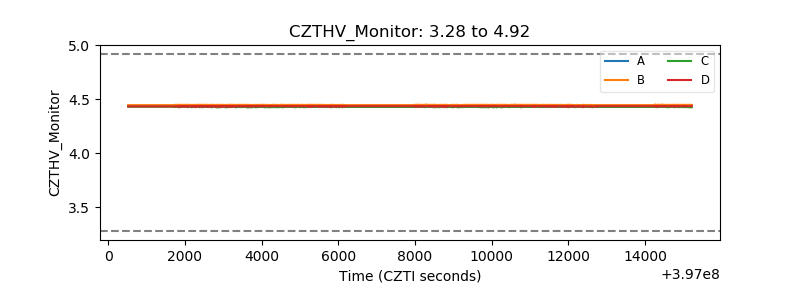 |
| D_VDD | 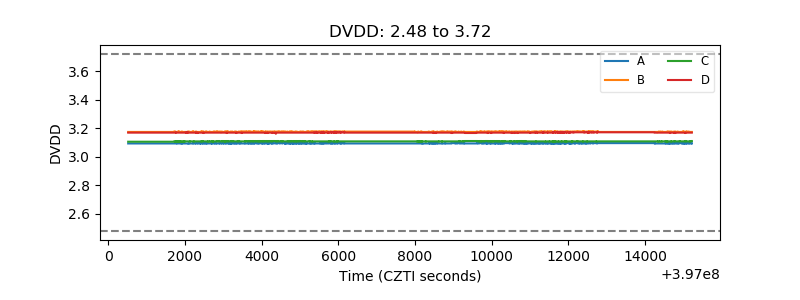 |
| Temperature 1 | 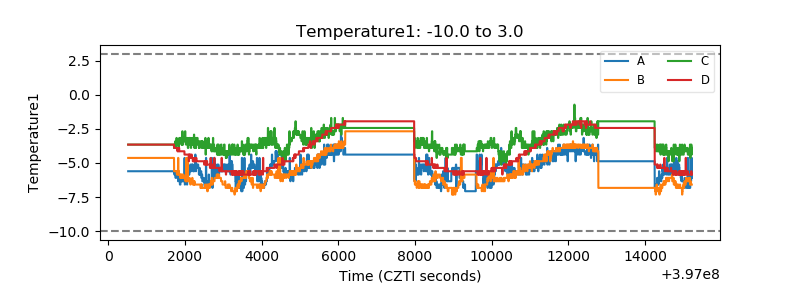 |
| Veto HV Monitor | 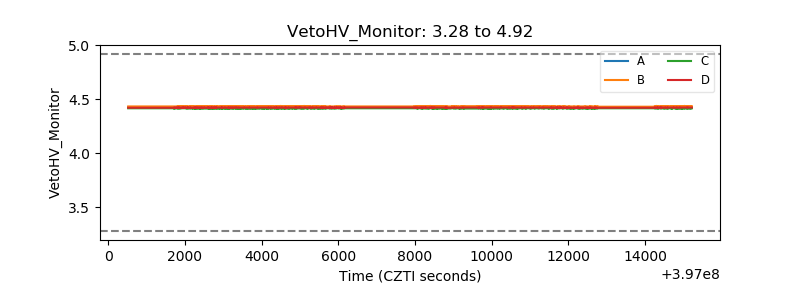 |
| Veto LLD | 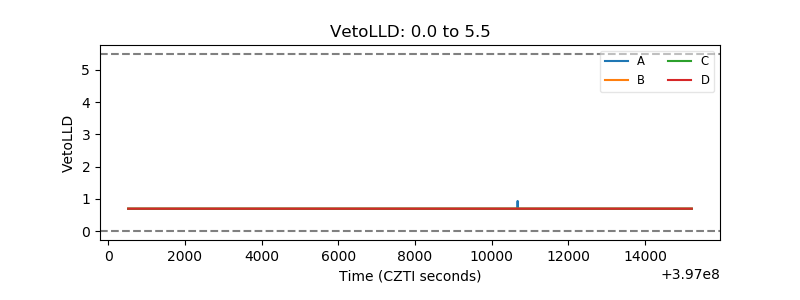 |
| Alpha Counter | 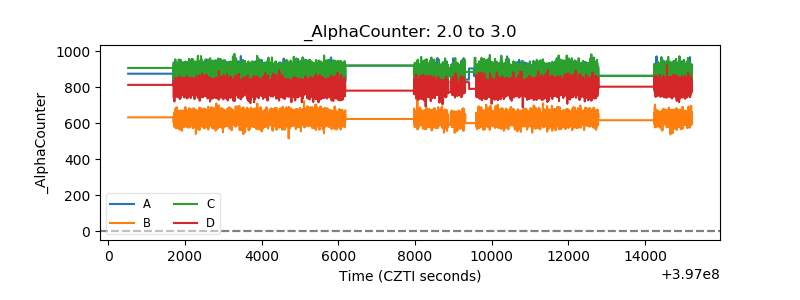 |
| _CPM_Rate | 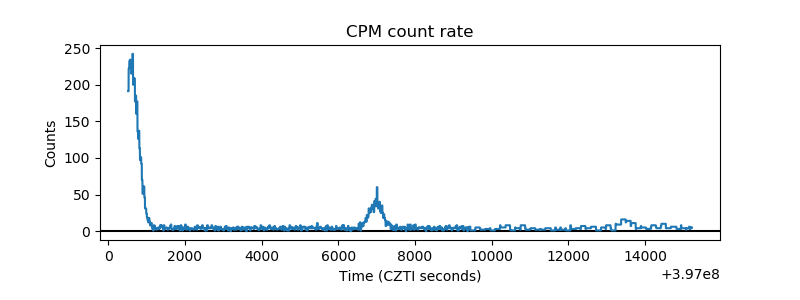 |
| CZT Counter | 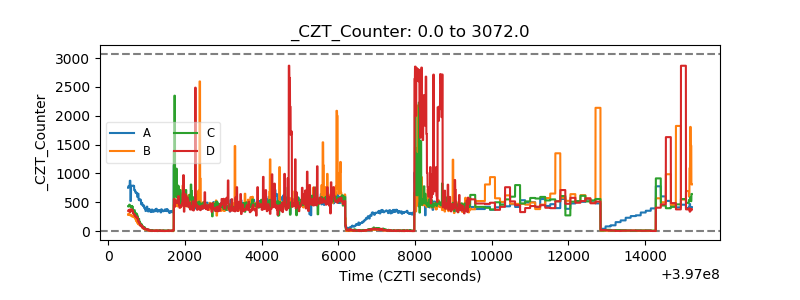 |
| +2.5 Volts monitor | 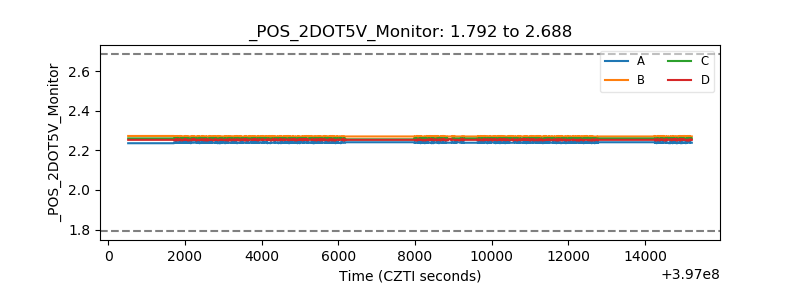 |
| +5 Volts monitor | 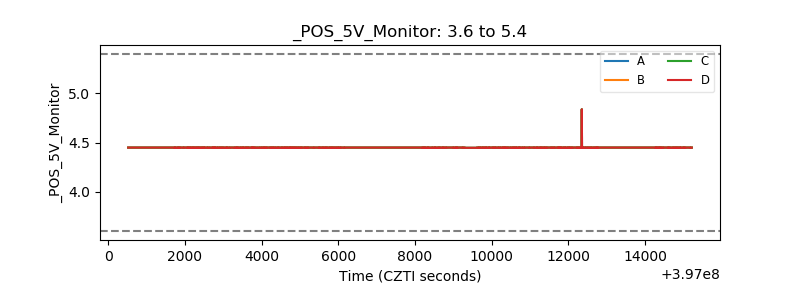 |
| _ROLL_ROT | 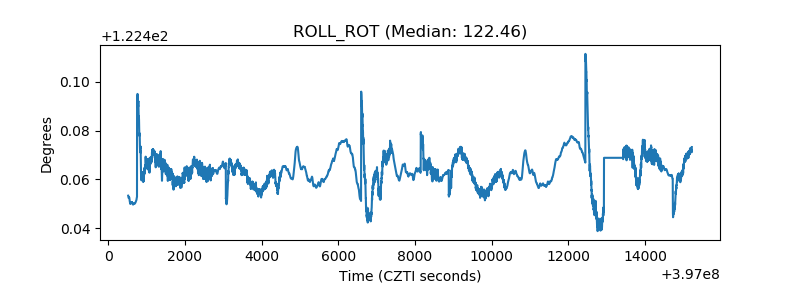 |
| _Roll_DEC | 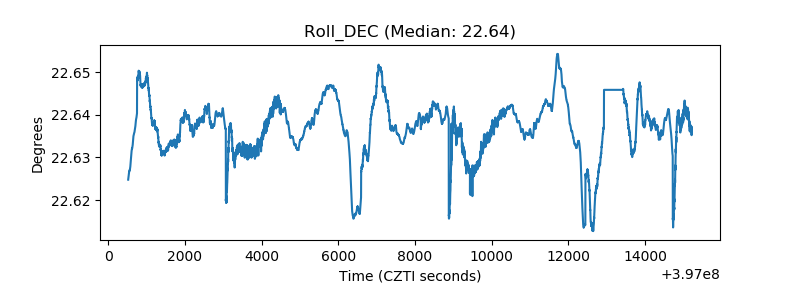 |
| _Roll_RA | 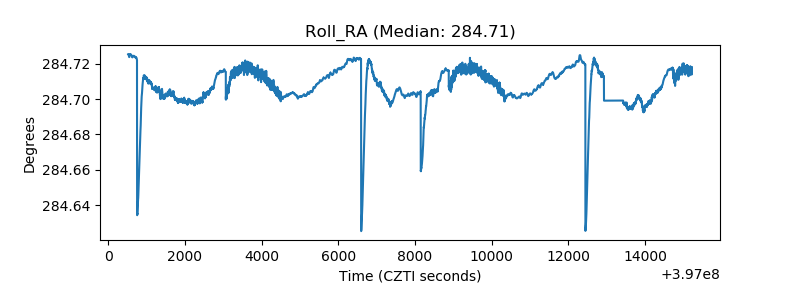 |
| Veto Counter | 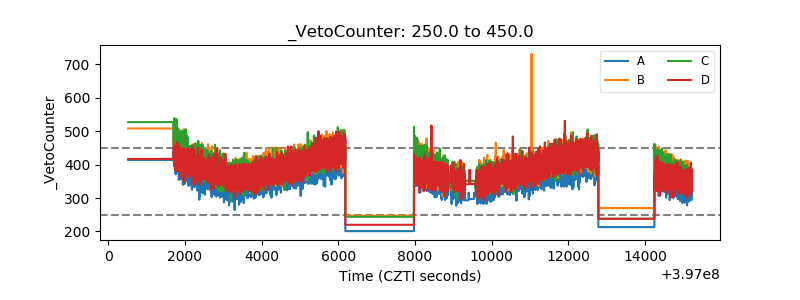 |