| Param | Original file | Final file |
|---|---|---|
| Filename | modeM0/AS1A11_079T01_9000005254_36990cztM0_level2.evt | modeM0/AS1A11_079T01_9000005254_36990cztM0_level2_quad_clean.evt |
| Size (bytes) | 556,873,920 | 75,709,440 |
| Size | 531.1 MB | 72.2 MB |
| Events in quadrant A | 3,162,705 | 467,349 |
| Events in quadrant B | 4,684,445 | 466,198 |
| Events in quadrant C | 3,830,175 | 468,998 |
| Events in quadrant D | 4,749,401 | 438,394 |
| Mode SS | |||
|---|---|---|---|
| Quadrant | BADHDUFLAG | Total packets | Discarded packets |
| A | 0 | 134 | 0 |
| B | 0 | 134 | 0 |
| C | 0 | 134 | 0 |
| D | 0 | 134 | 0 |
| Mode M9 | |||
|---|---|---|---|
| Quadrant | BADHDUFLAG | Total packets | Discarded packets |
| A | 0 | 28 | 0 |
| B | 0 | 28 | 0 |
| C | 0 | 28 | 0 |
| D | 0 | 28 | 0 |
| Mode M0 | |||
|---|---|---|---|
| Quadrant | BADHDUFLAG | Total packets | Discarded packets |
| A | 0 | 13412 | 3 |
| B | 0 | 18142 | 2 |
| C | 0 | 15348 | 2 |
| D | 0 | 18735 | 2 |
| Quadrant | Total seconds | Saturated seconds | Saturation percentage |
|---|---|---|---|
| A | 6470 | 23 | 0.355487% |
| B | 6470 | 226 | 3.493045% |
| C | 6470 | 94 | 1.452859% |
| D | 6470 | 196 | 3.029366% |
Noise dominated data is calculated using 1-second bins in cleaned event files. If a bin has >2000 counts, and if more than 50% of those come from <1% of pixels, then it is considered to be noise-dominated and hence unusable.
| Quadrant | # 1 sec bins | Bins with >0 counts | Bins with >2000 counts | High rate bins dominated by noise | Noise dominated (total time) | Noise dominated (detector-on time) | Marked lightcurve |
|---|---|---|---|---|---|---|---|
| A | 9246 | 6472 | 11 | 11 | 0.12% | 0.17% | 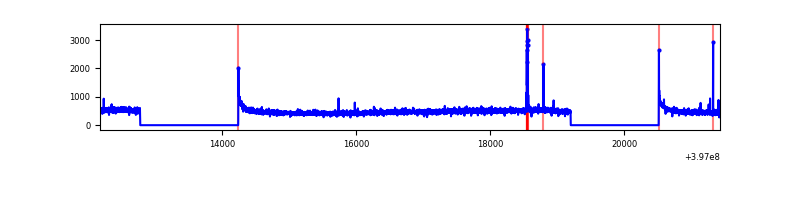 |
| B | 9246 | 6472 | 140 | 140 | 1.51% | 2.16% | 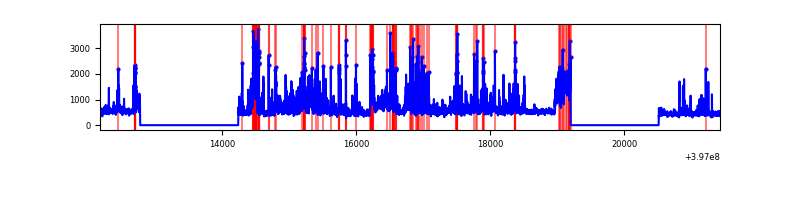 |
| C | 9246 | 6472 | 84 | 84 | 0.91% | 1.30% | 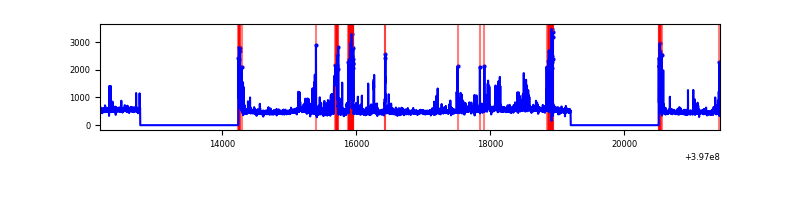 |
| D | 9246 | 6472 | 128 | 128 | 1.38% | 1.98% | 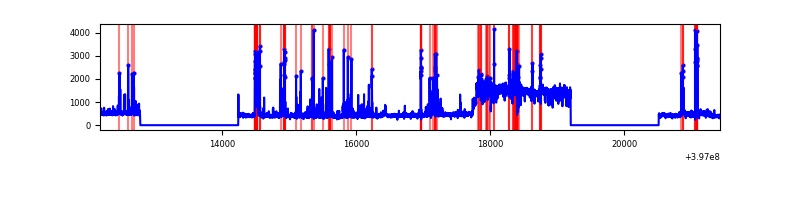 |
Top three noisy pixels from each quadrant. If the there are fewer than three noisy pixels in the level2.evt file, extra rows are filled as -1
| Pixel properties | Quadrant properties | ||||||
|---|---|---|---|---|---|---|---|
| Quadrant | DetID | PixID | Counts | Sigma | Mean | Median | Sigma |
| A | 10 | 83 | 241967 | 1612.7 | 739 | 723 | 149.6 |
| A | 10 | 255 | 32223 | 210.58 | 739 | 723 | 149.6 |
| A | 13 | 6 | 11275 | 70.54 | 739 | 723 | 149.6 |
| B | 5 | 184 | 1179231 | 8347.79 | 726 | 709 | 141.2 |
| B | 4 | 81 | 369380 | 2611.4 | 726 | 709 | 141.2 |
| B | 0 | 221 | 117043 | 824.03 | 726 | 709 | 141.2 |
| C | 10 | 49 | 419909 | 2479.72 | 724 | 730 | 169.0 |
| C | 15 | 214 | 275501 | 1625.45 | 724 | 730 | 169.0 |
| C | 0 | 10 | 118257 | 695.25 | 724 | 730 | 169.0 |
| D | 1 | 20 | 1371403 | 7707.44 | 719 | 697 | 177.8 |
| D | 12 | 17 | 341124 | 1914.21 | 719 | 697 | 177.8 |
| D | 2 | 153 | 112062 | 626.2 | 719 | 697 | 177.8 |
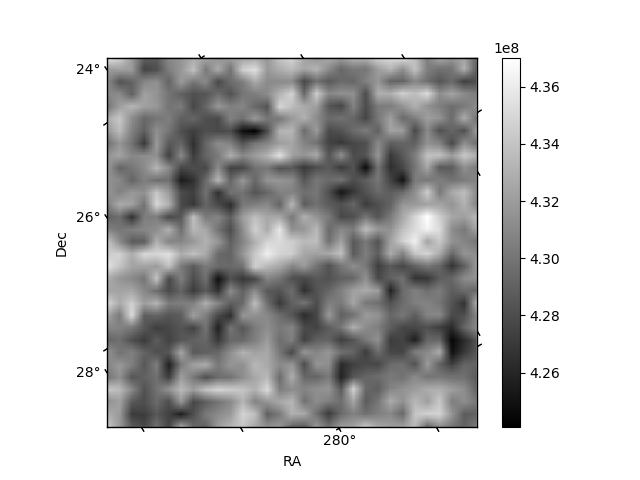
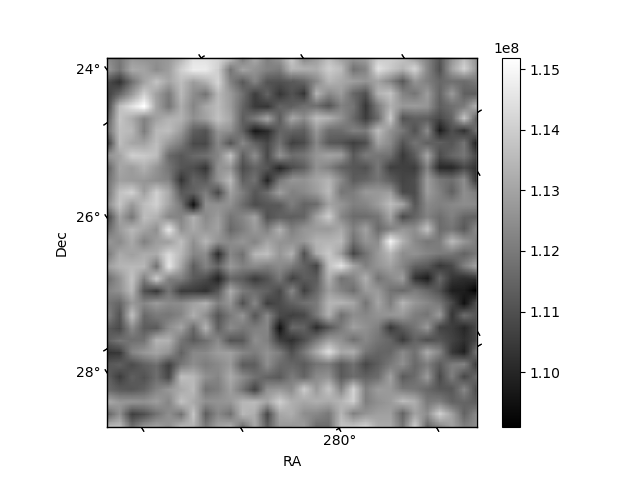
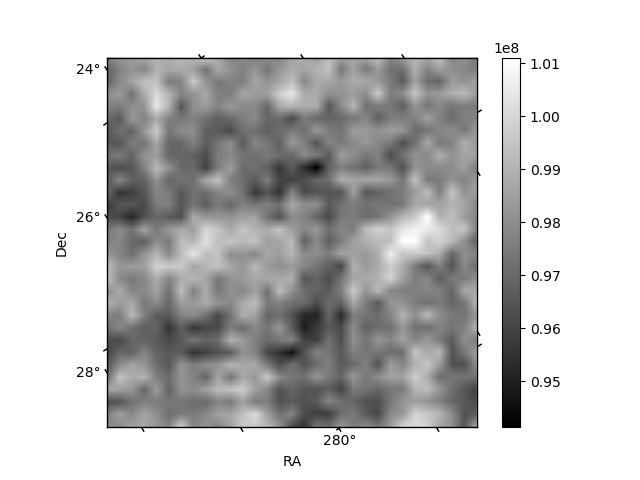
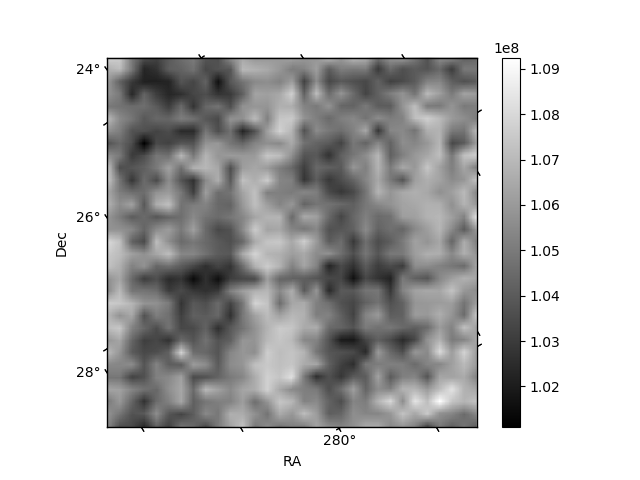
Histogram calculated using DETX and DETY for each event in the final _common_clean file
| Quadrant A | 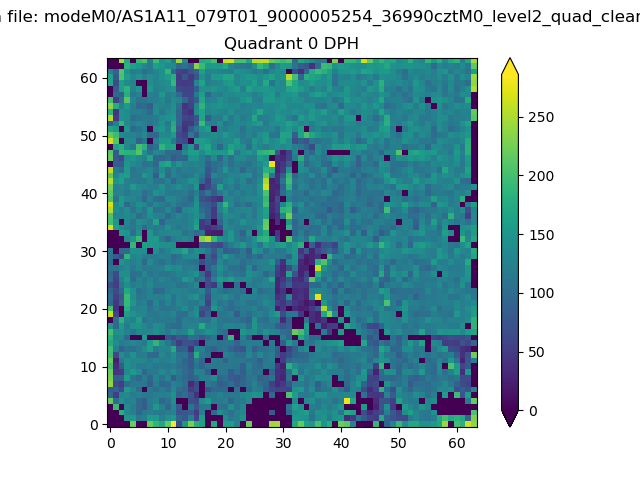 |
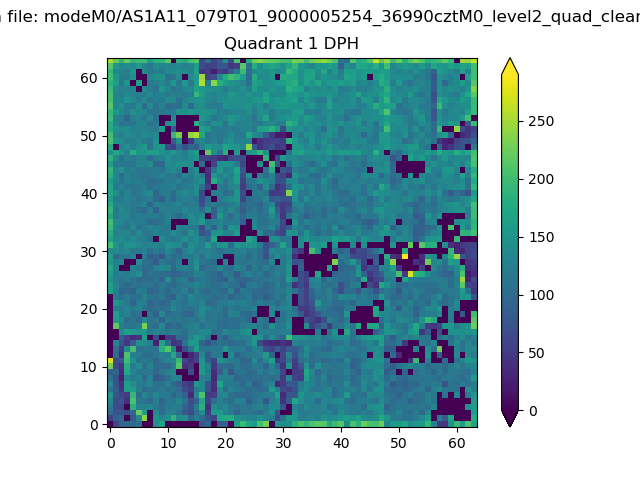 |
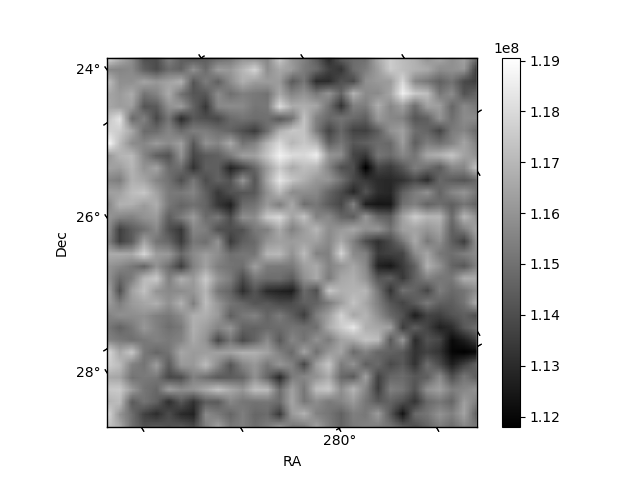
Quadrant B |
|---|---|---|---|
| Quadrant D | 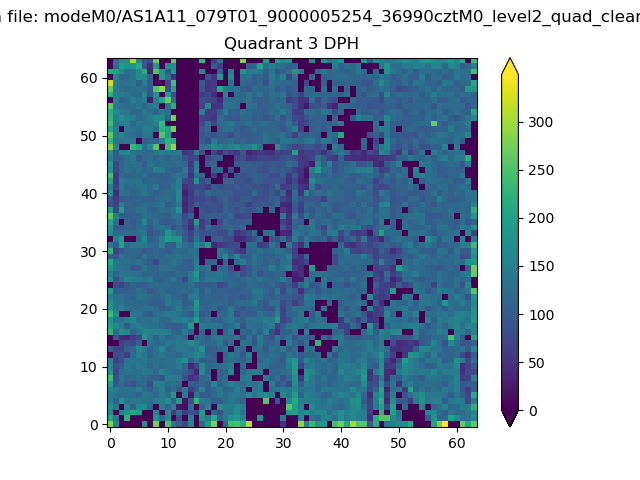 |
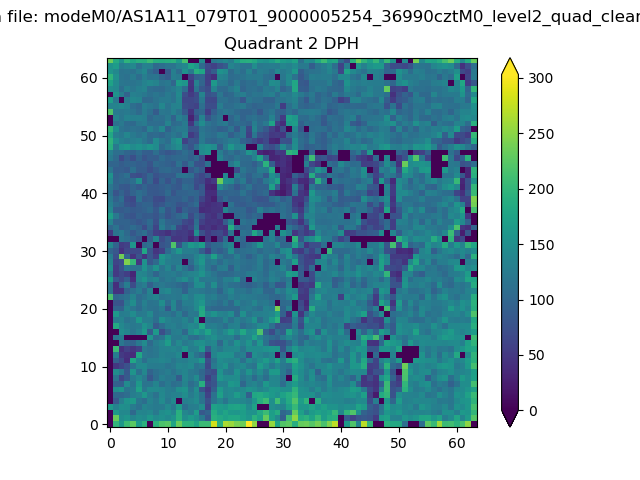 |
Quadrant C |
| Plot type | Count rate plots | Images |
|---|---|---|
| Comparison with Poisson distribution Blue bars denote a histogram of data divided into 1 sec bins. Red curve is a Poisson curve with rate = median count rate of data. |
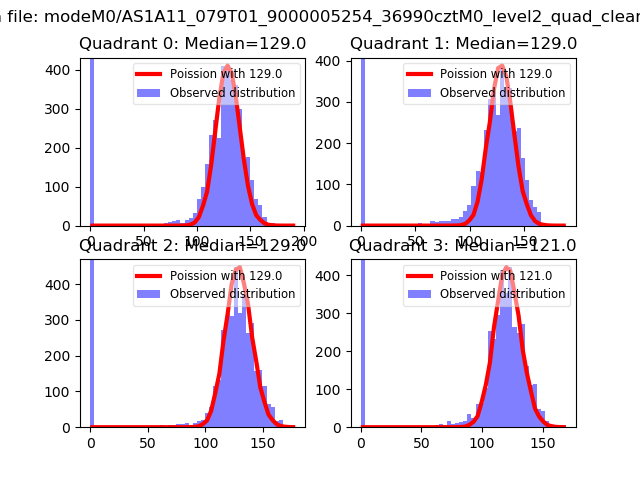 |
 |
| Quadrant-wise count rates Data is divided into 100 sec bins |
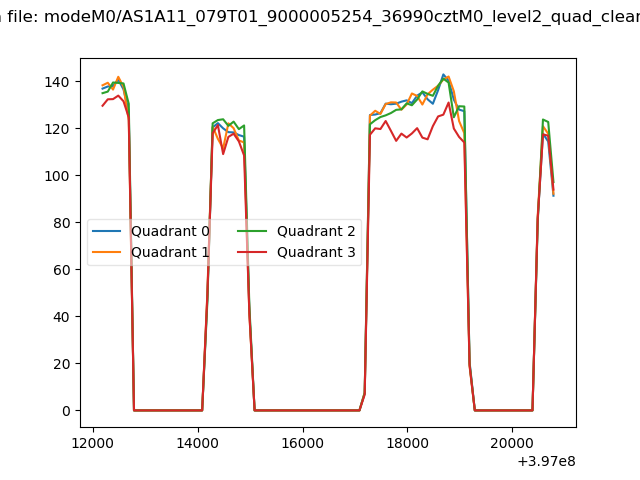 |
|
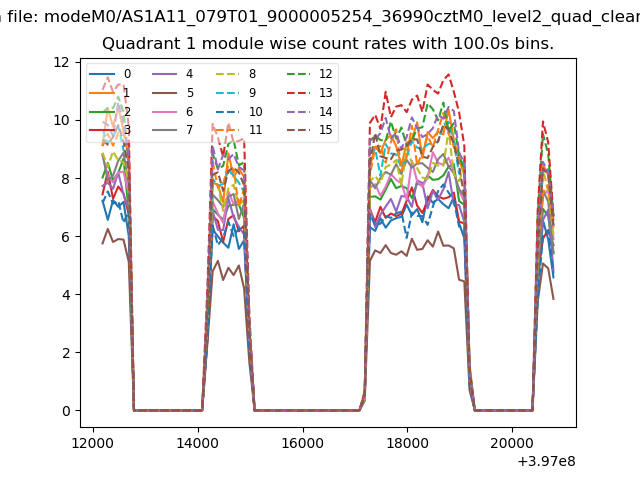
| Module-wise count rates for Quadrant A Data is divided into 100 sec bins |
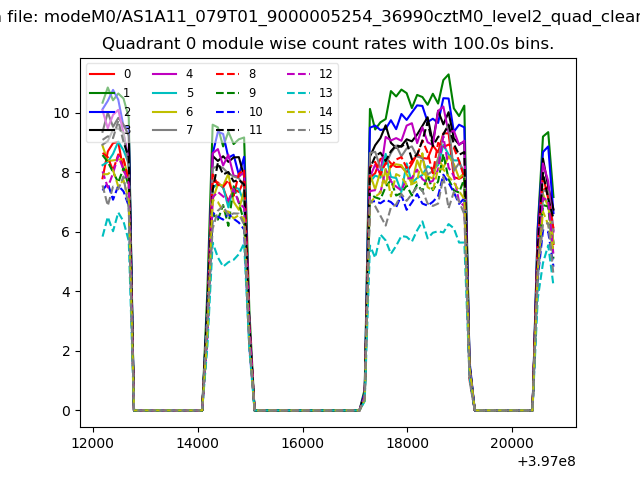 |
 |
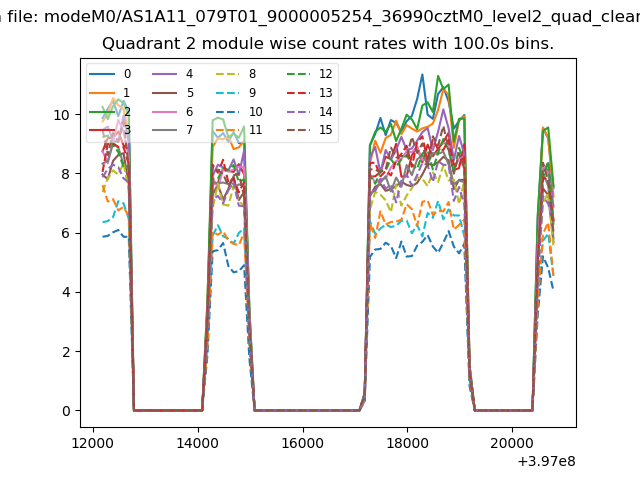
| Module-wise count rates for Quadrant B Data is divided into 100 sec bins |
 |
 |
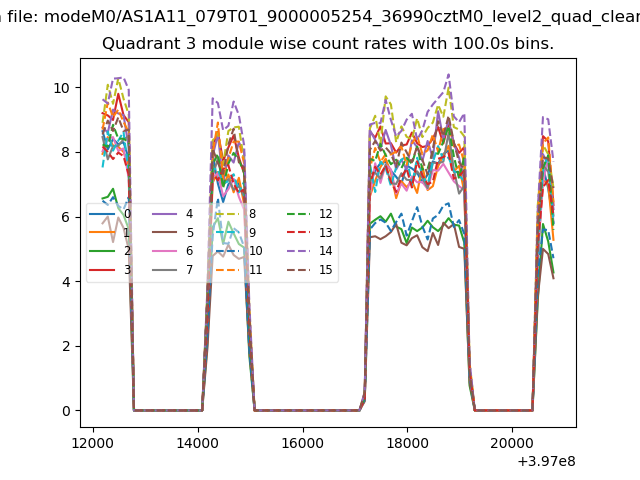
| Module-wise count rates for Quadrant C Data is divided into 100 sec bins |
 |
 |
| Module-wise count rates for Quadrant D Data is divided into 100 sec bins |
 |
 |
| Parameter | Plot |
|---|---|
| CZT HV Monitor | 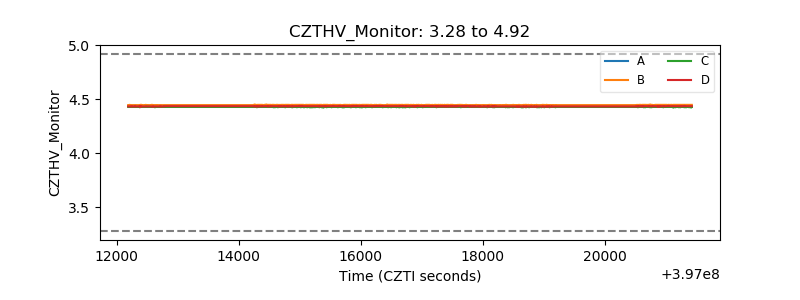 |
| D_VDD | 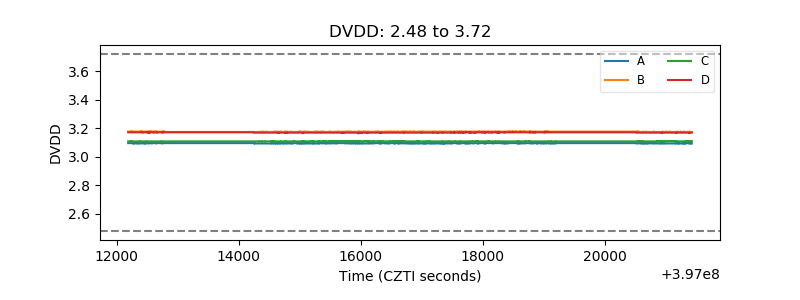 |
| Temperature 1 | 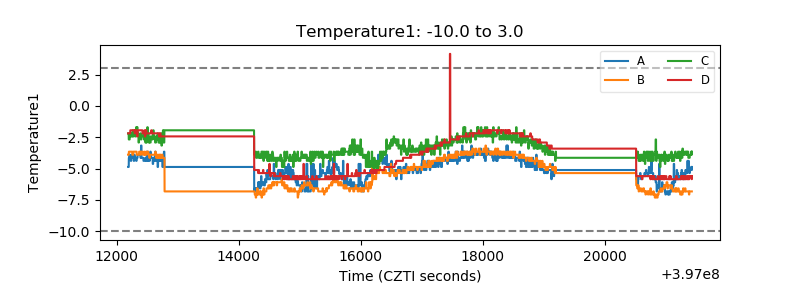 |
| Veto HV Monitor | 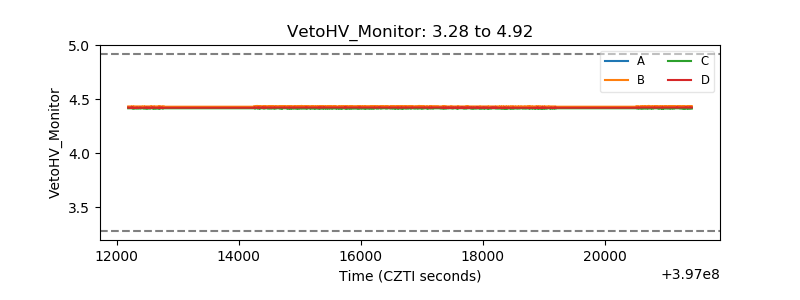 |
| Veto LLD | 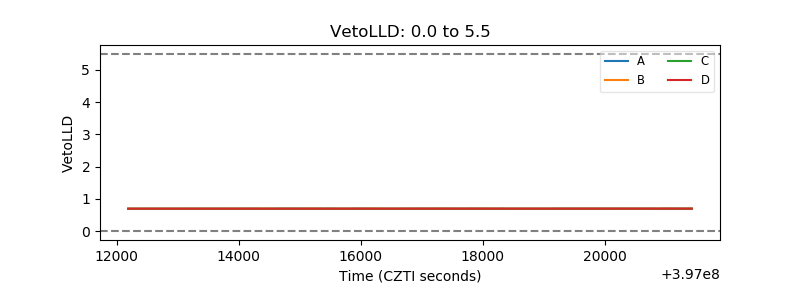 |
| Alpha Counter | 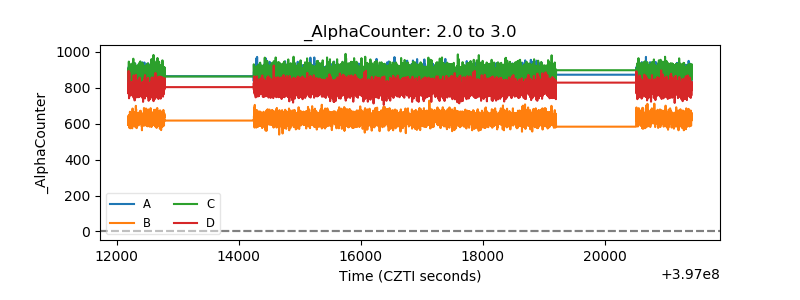 |
| _CPM_Rate | 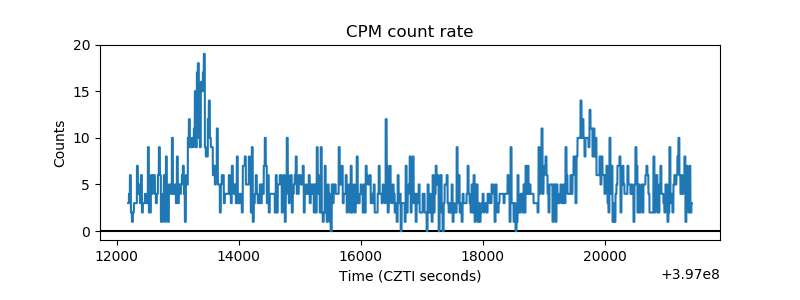 |
| CZT Counter | 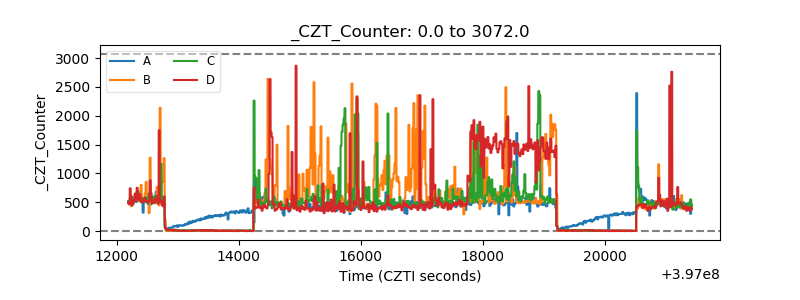 |
| +2.5 Volts monitor | 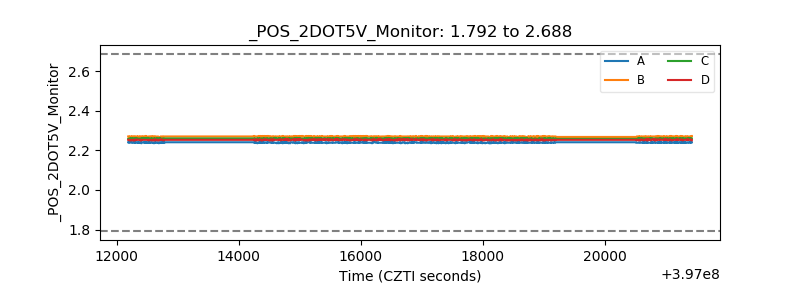 |
| +5 Volts monitor | 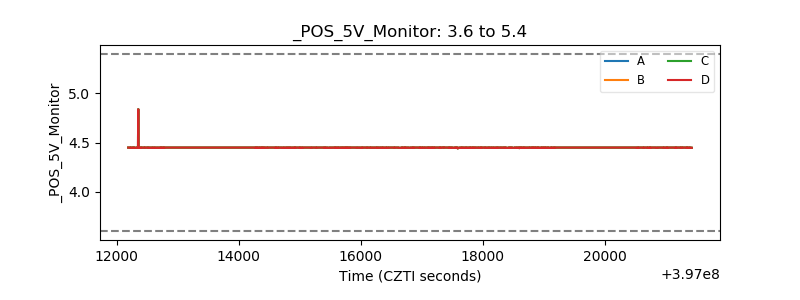 |
| _ROLL_ROT | 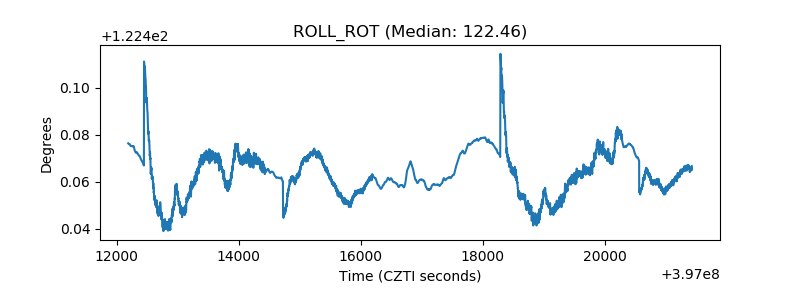 |
| _Roll_DEC | 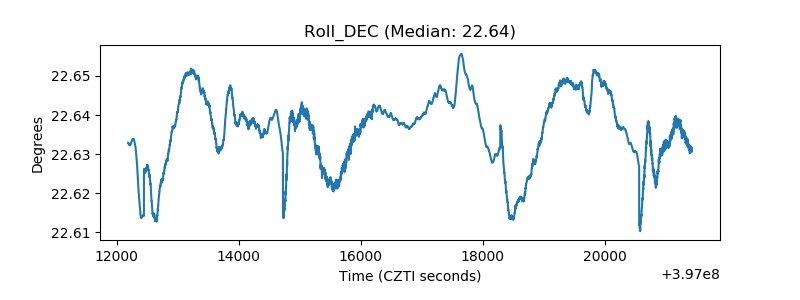 |
| _Roll_RA | 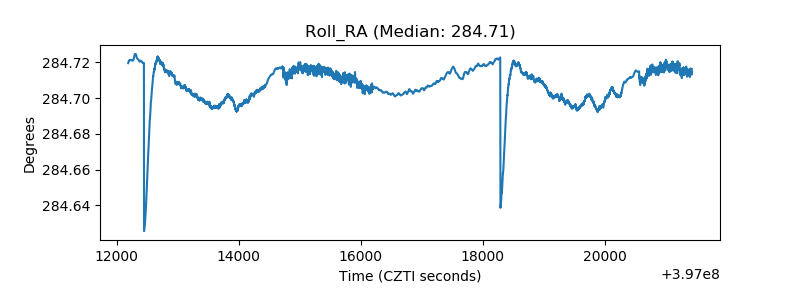 |
| Veto Counter | 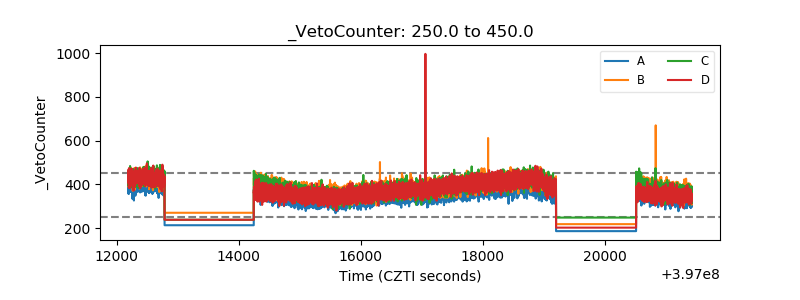 |