| Param | Original file | Final file |
|---|---|---|
| Filename | modeM0/AS1A11_079T01_9000005254_36991cztM0_level2.evt | modeM0/AS1A11_079T01_9000005254_36991cztM0_level2_quad_clean.evt |
| Size (bytes) | 584,115,840 | 58,343,040 |
| Size | 557.1 MB | 55.6 MB |
| Events in quadrant A | 2,914,720 | 350,889 |
| Events in quadrant B | 6,963,129 | 310,802 |
| Events in quadrant C | 3,319,384 | 352,085 |
| Events in quadrant D | 4,081,497 | 328,191 |
| Mode SS | |||
|---|---|---|---|
| Quadrant | BADHDUFLAG | Total packets | Discarded packets |
| A | 0 | 126 | 0 |
| B | 0 | 126 | 0 |
| C | 0 | 126 | 0 |
| D | 0 | 126 | 0 |
| Mode M9 | |||
|---|---|---|---|
| Quadrant | BADHDUFLAG | Total packets | Discarded packets |
| A | 0 | 26 | 0 |
| B | 0 | 26 | 0 |
| C | 0 | 26 | 0 |
| D | 0 | 26 | 0 |
| Mode M0 | |||
|---|---|---|---|
| Quadrant | BADHDUFLAG | Total packets | Discarded packets |
| A | 0 | 12450 | 3 |
| B | 0 | 24805 | 2 |
| C | 0 | 13506 | 2 |
| D | 0 | 16377 | 2 |
| Quadrant | Total seconds | Saturated seconds | Saturation percentage |
|---|---|---|---|
| A | 6068 | 10 | 0.164799% |
| B | 6068 | 1521 | 25.065920% |
| C | 6068 | 47 | 0.774555% |
| D | 6068 | 132 | 2.175346% |
Noise dominated data is calculated using 1-second bins in cleaned event files. If a bin has >2000 counts, and if more than 50% of those come from <1% of pixels, then it is considered to be noise-dominated and hence unusable.
| Quadrant | # 1 sec bins | Bins with >0 counts | Bins with >2000 counts | High rate bins dominated by noise | Noise dominated (total time) | Noise dominated (detector-on time) | Marked lightcurve |
|---|---|---|---|---|---|---|---|
| A | 8694 | 6070 | 2 | 2 | 0.02% | 0.03% | 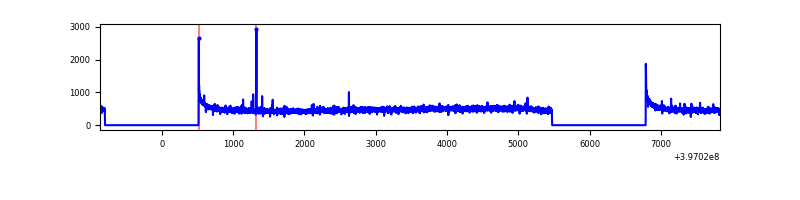 |
| B | 8694 | 6070 | 917 | 917 | 10.55% | 15.11% | 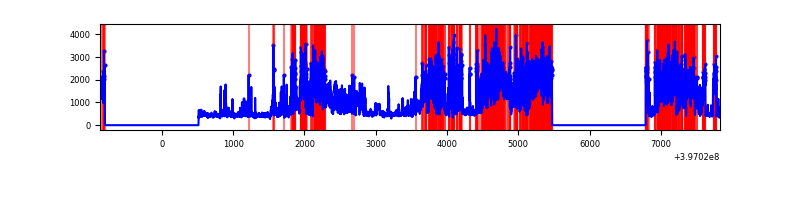 |
| C | 8694 | 6070 | 38 | 38 | 0.44% | 0.63% |  |
| D | 8694 | 6070 | 124 | 124 | 1.43% | 2.04% | 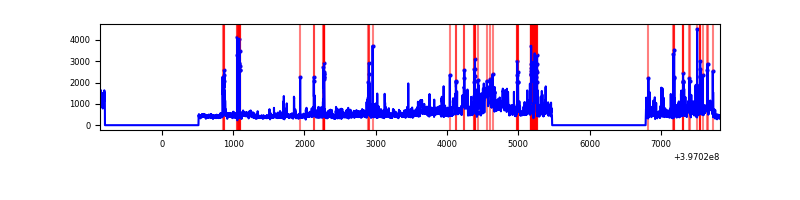 |
Top three noisy pixels from each quadrant. If the there are fewer than three noisy pixels in the level2.evt file, extra rows are filled as -1
| Pixel properties | Quadrant properties | ||||||
|---|---|---|---|---|---|---|---|
| Quadrant | DetID | PixID | Counts | Sigma | Mean | Median | Sigma |
| A | 10 | 83 | 234901 | 1689.67 | 684 | 671 | 138.6 |
| A | 13 | 6 | 14343 | 98.63 | 684 | 671 | 138.6 |
| A | 13 | 254 | 9054 | 60.47 | 684 | 671 | 138.6 |
| B | 5 | 184 | 4132234 | 34011.26 | 625 | 607 | 121.5 |
| B | 4 | 81 | 118412 | 969.76 | 625 | 607 | 121.5 |
| B | 5 | 172 | 69994 | 571.19 | 625 | 607 | 121.5 |
| C | 15 | 214 | 260286 | 1658.63 | 669 | 673 | 156.5 |
| C | 0 | 207 | 164939 | 1049.47 | 669 | 673 | 156.5 |
| C | 1 | 23 | 133846 | 850.82 | 669 | 673 | 156.5 |
| D | 1 | 20 | 834563 | 5069.55 | 662 | 642 | 164.5 |
| D | 12 | 17 | 347061 | 2105.94 | 662 | 642 | 164.5 |
| D | 2 | 153 | 142260 | 860.92 | 662 | 642 | 164.5 |
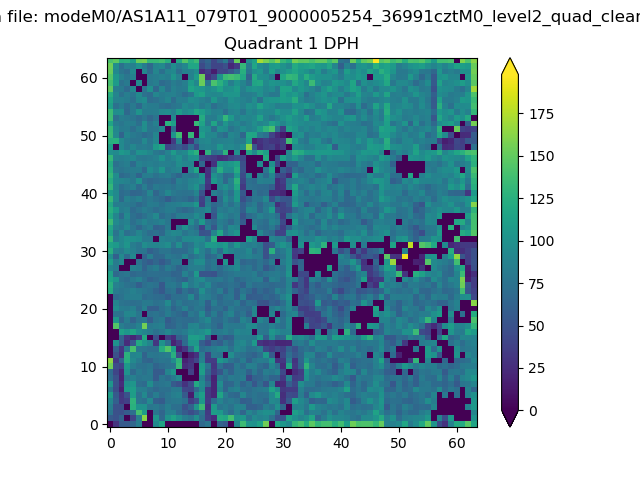
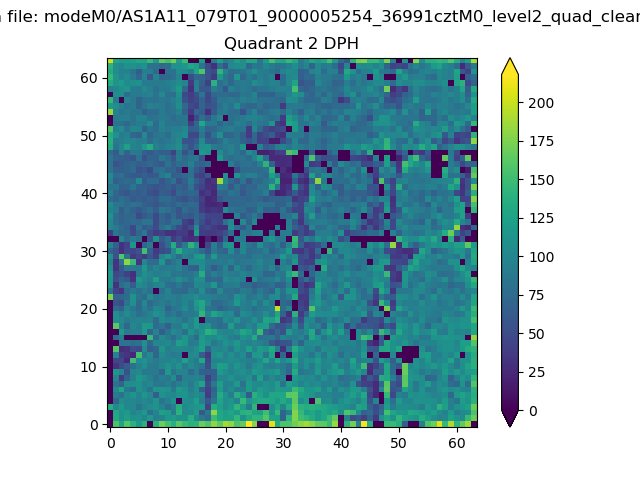
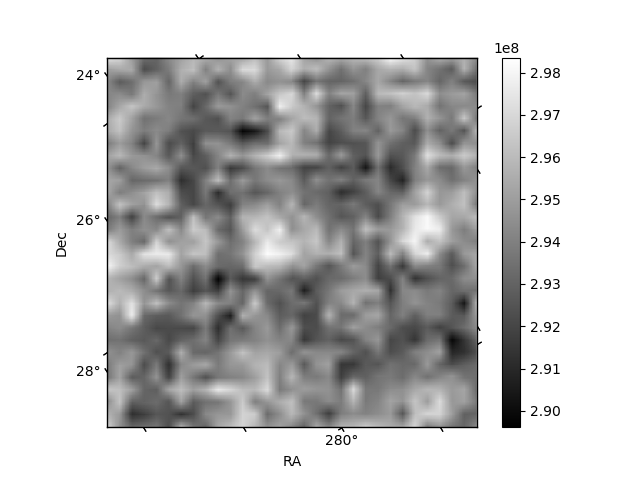
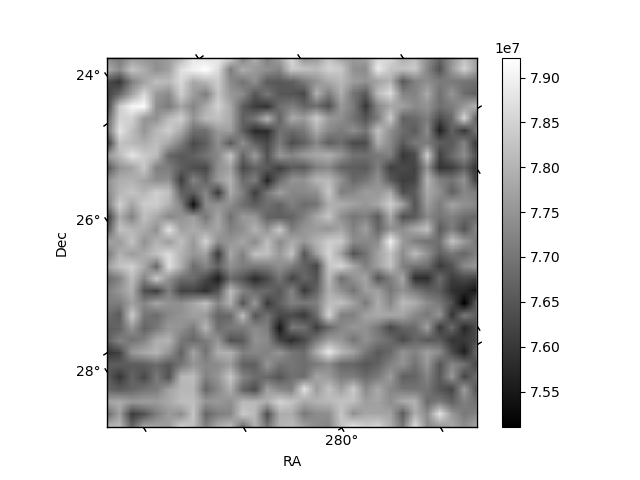
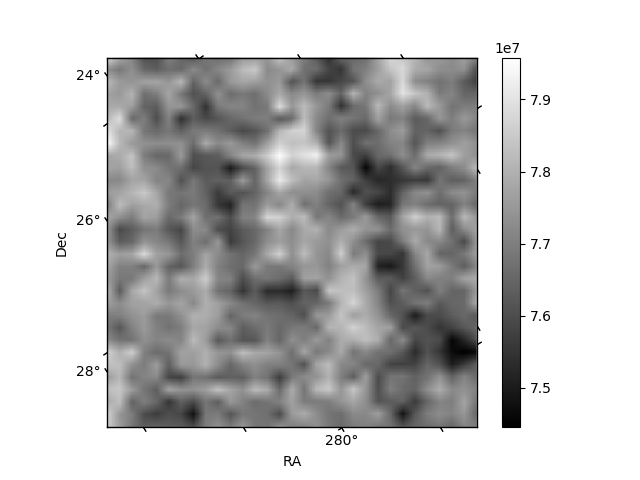
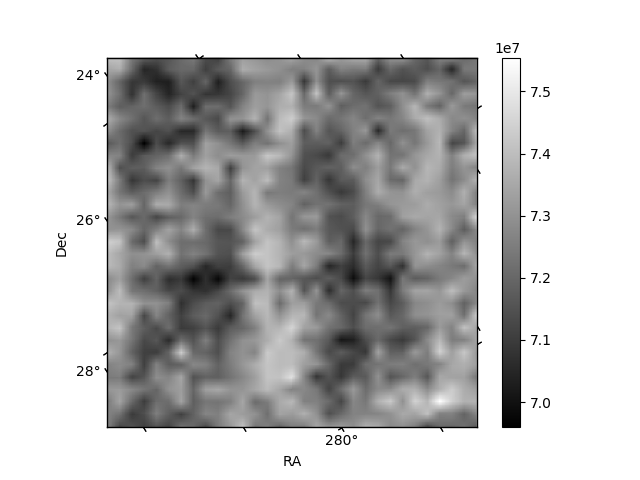
Histogram calculated using DETX and DETY for each event in the final _common_clean file
| Quadrant A | 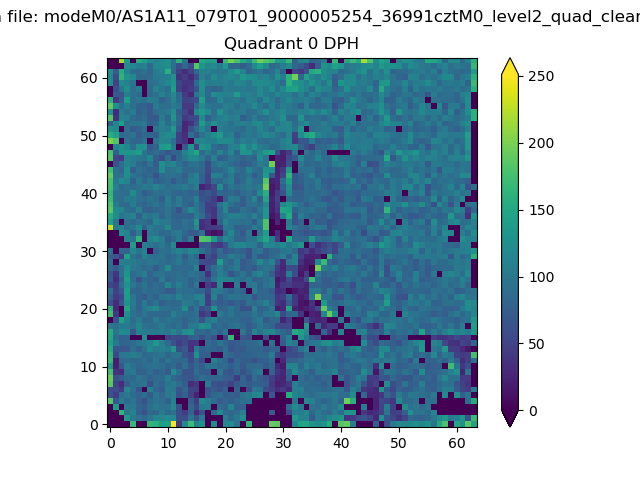 |
 |
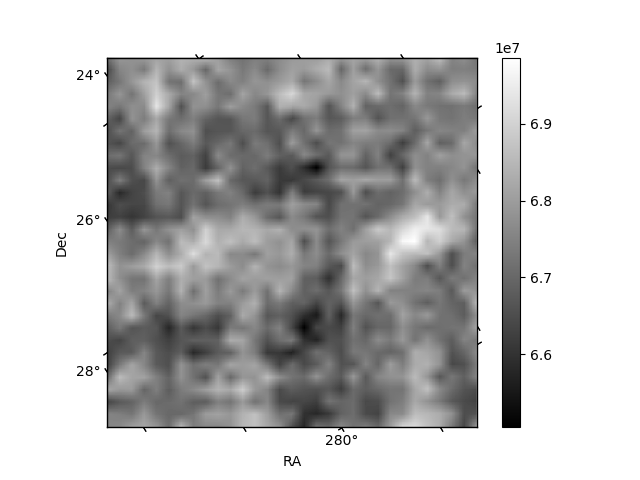
Quadrant B |
|---|---|---|---|
| Quadrant D | 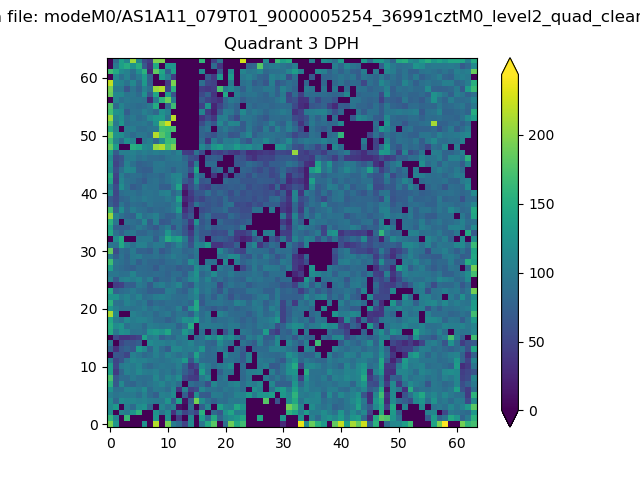 |
 |
Quadrant C |
| Plot type | Count rate plots | Images |
|---|---|---|
| Comparison with Poisson distribution Blue bars denote a histogram of data divided into 1 sec bins. Red curve is a Poisson curve with rate = median count rate of data. |
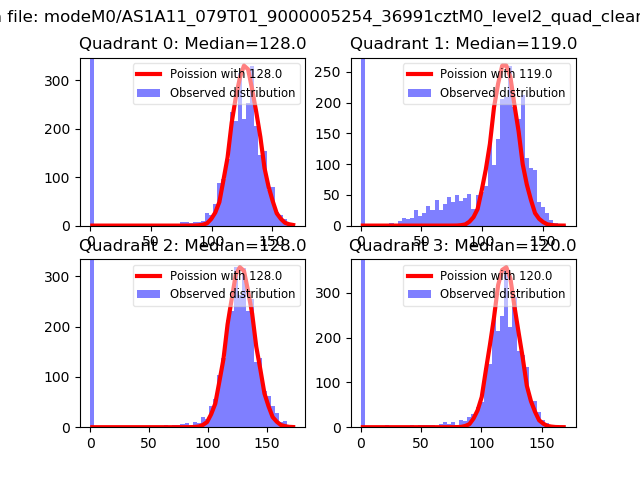 |
 |
| Quadrant-wise count rates Data is divided into 100 sec bins |
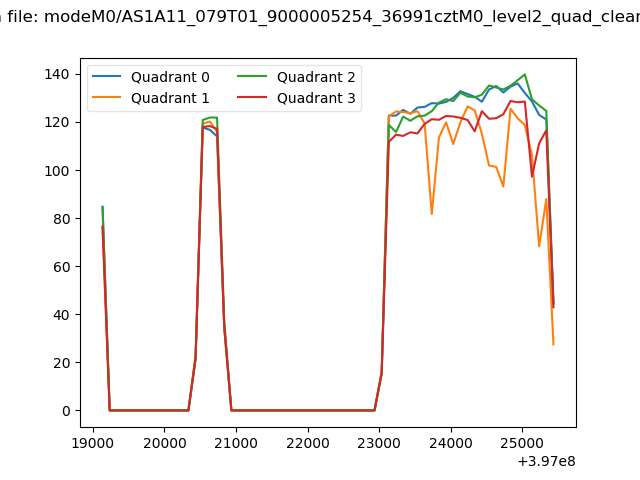 |
|
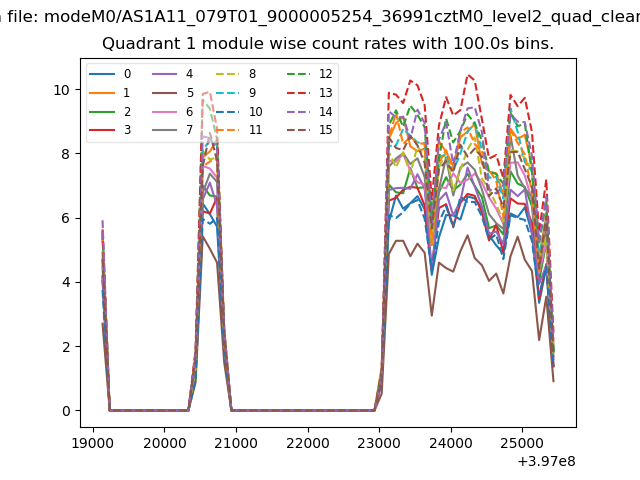
| Module-wise count rates for Quadrant A Data is divided into 100 sec bins |
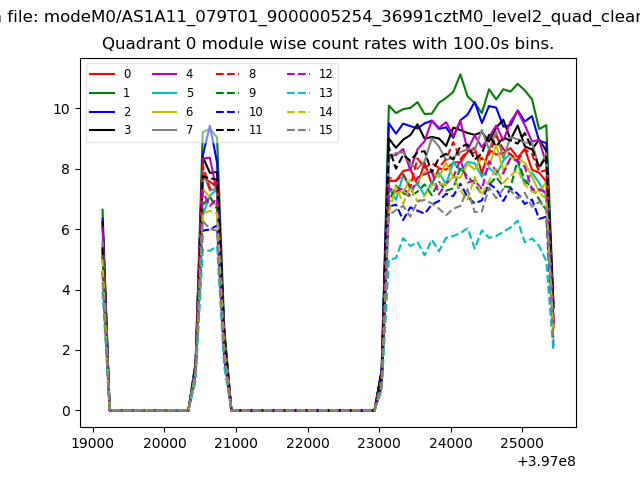 |
 |
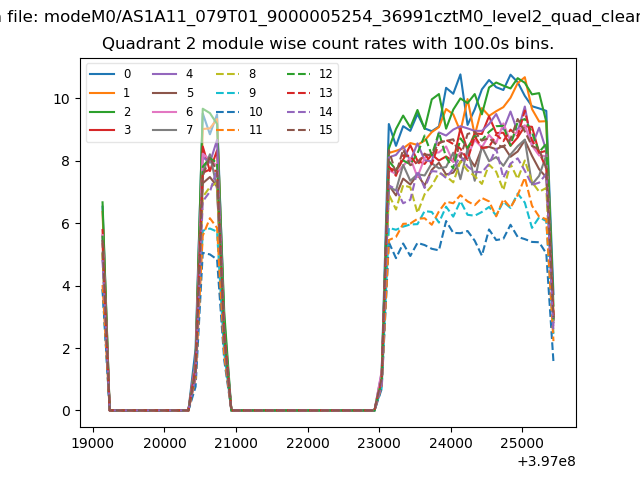
| Module-wise count rates for Quadrant B Data is divided into 100 sec bins |
 |
 |
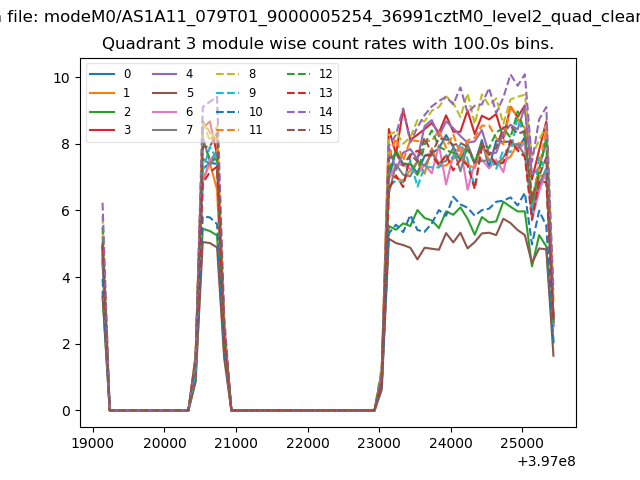
| Module-wise count rates for Quadrant C Data is divided into 100 sec bins |
 |
 |
| Module-wise count rates for Quadrant D Data is divided into 100 sec bins |
 |
 |
| Parameter | Plot |
|---|---|
| CZT HV Monitor | 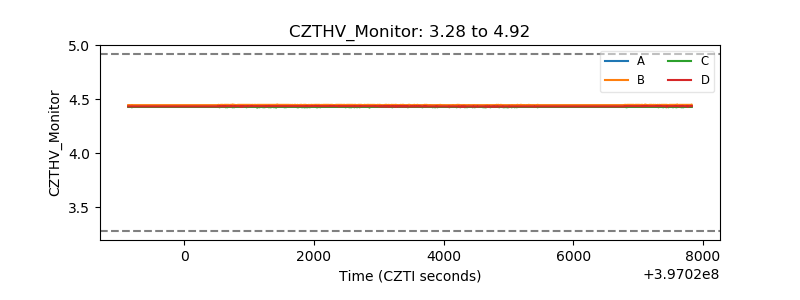 |
| D_VDD | 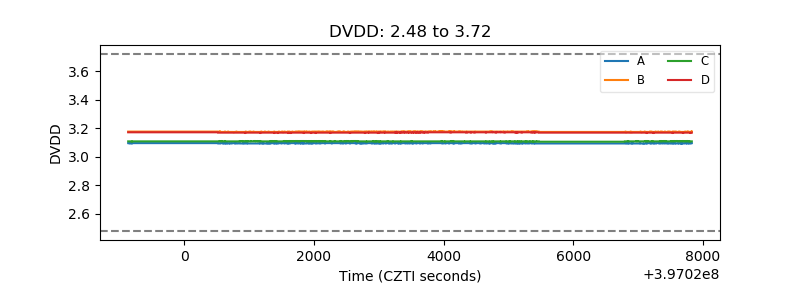 |
| Temperature 1 | 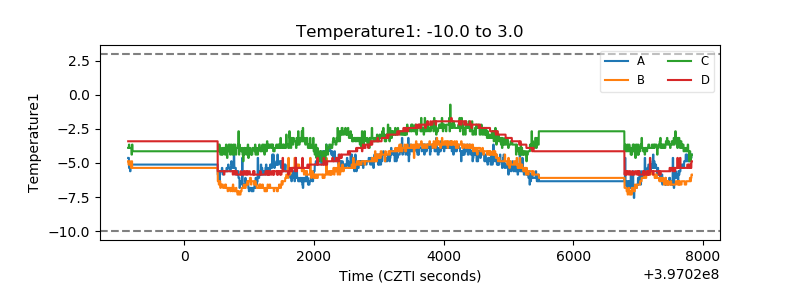 |
| Veto HV Monitor | 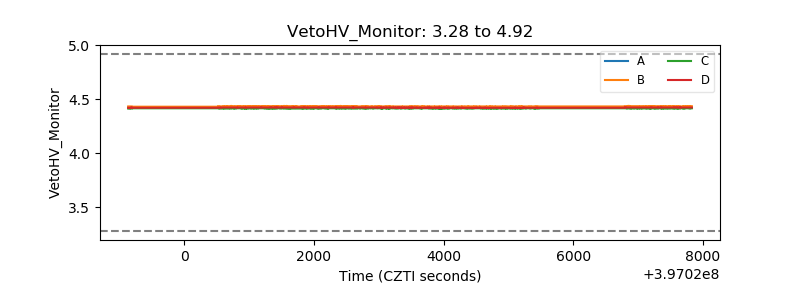 |
| Veto LLD | 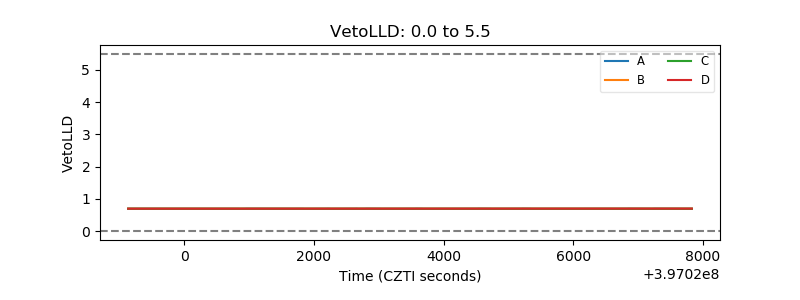 |
| Alpha Counter | 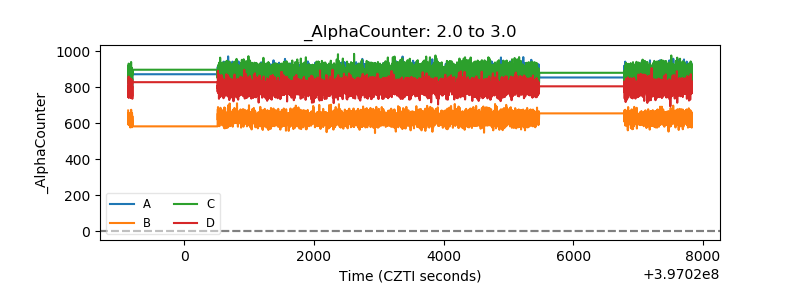 |
| _CPM_Rate | 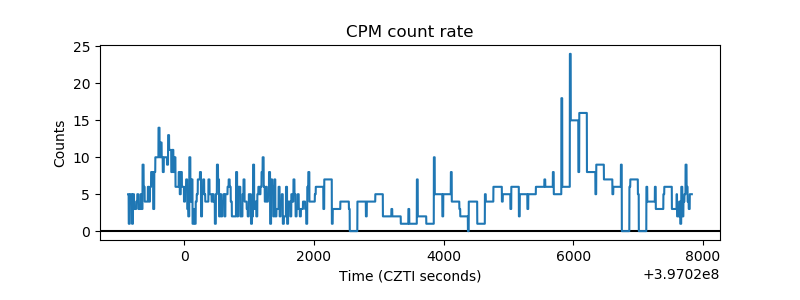 |
| CZT Counter | 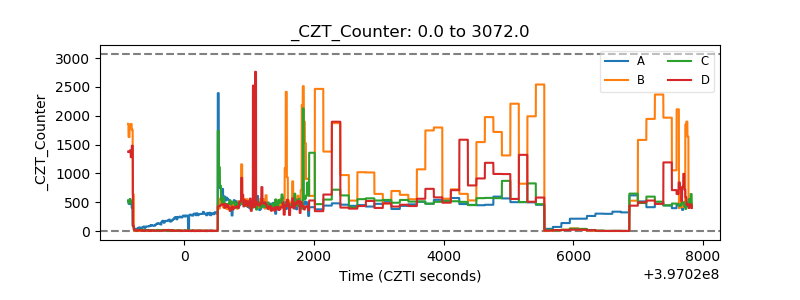 |
| +2.5 Volts monitor | 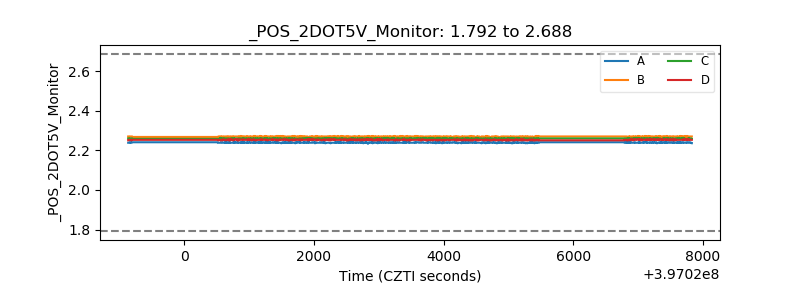 |
| +5 Volts monitor | 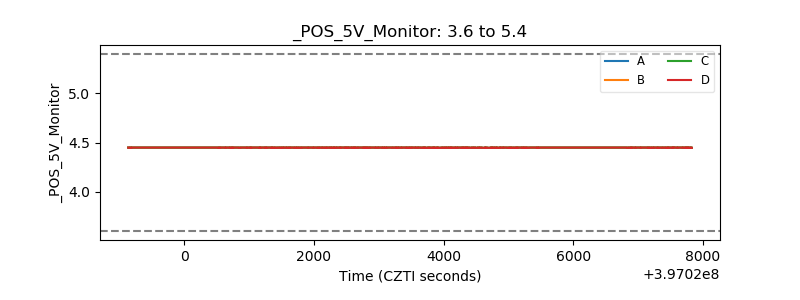 |
| _ROLL_ROT | 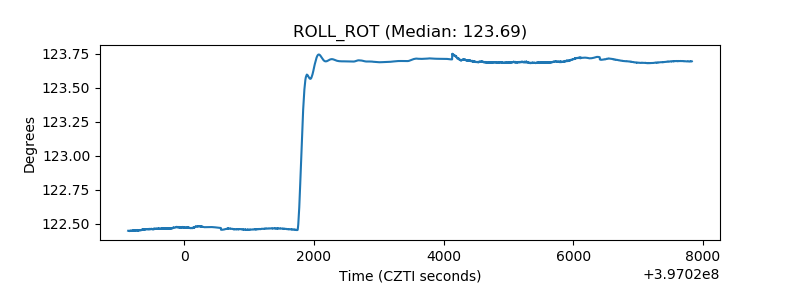 |
| _Roll_DEC | 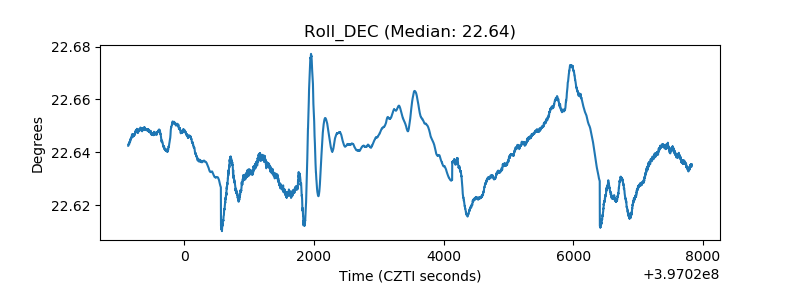 |
| _Roll_RA | 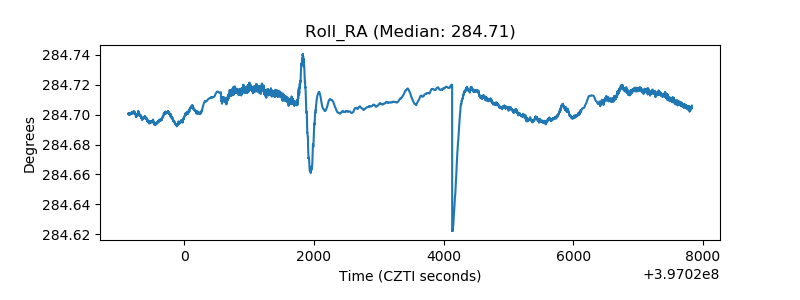 |
| Veto Counter | 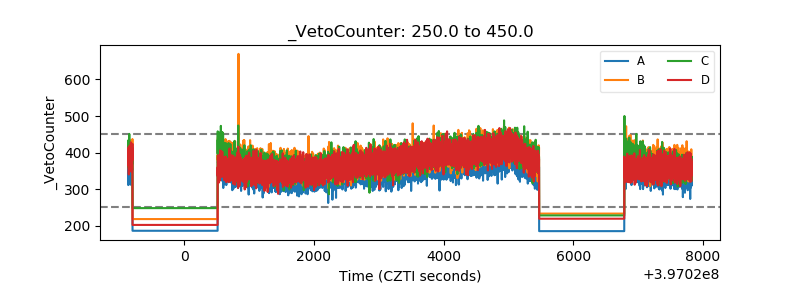 |