| Param | Original file | Final file |
|---|---|---|
| Filename | modeM0/AS1A11_079T01_9000005254_36993cztM0_level2.evt | modeM0/AS1A11_079T01_9000005254_36993cztM0_level2_quad_clean.evt |
| Size (bytes) | 959,857,920 | 116,150,400 |
| Size | 915.4 MB | 110.8 MB |
| Events in quadrant A | 5,158,654 | 724,007 |
| Events in quadrant B | 10,405,144 | 661,556 |
| Events in quadrant C | 5,576,085 | 724,506 |
| Events in quadrant D | 7,212,585 | 671,612 |
| Mode SS | |||
|---|---|---|---|
| Quadrant | BADHDUFLAG | Total packets | Discarded packets |
| A | 0 | 216 | 0 |
| B | 0 | 216 | 0 |
| C | 0 | 216 | 0 |
| D | 0 | 216 | 0 |
| Mode M9 | |||
|---|---|---|---|
| Quadrant | BADHDUFLAG | Total packets | Discarded packets |
| A | 0 | 31 | 0 |
| B | 0 | 31 | 0 |
| C | 0 | 31 | 0 |
| D | 0 | 32 | 0 |
| Mode M0 | |||
|---|---|---|---|
| Quadrant | BADHDUFLAG | Total packets | Discarded packets |
| A | 0 | 21920 | 4 |
| B | 0 | 37971 | 3 |
| C | 0 | 22766 | 3 |
| D | 0 | 28640 | 3 |
| Quadrant | Total seconds | Saturated seconds | Saturation percentage |
|---|---|---|---|
| A | 10616 | 19 | 0.178975% |
| B | 10616 | 1968 | 18.538056% |
| C | 10616 | 51 | 0.480407% |
| D | 10616 | 410 | 3.862095% |
Noise dominated data is calculated using 1-second bins in cleaned event files. If a bin has >2000 counts, and if more than 50% of those come from <1% of pixels, then it is considered to be noise-dominated and hence unusable.
| Quadrant | # 1 sec bins | Bins with >0 counts | Bins with >2000 counts | High rate bins dominated by noise | Noise dominated (total time) | Noise dominated (detector-on time) | Marked lightcurve |
|---|---|---|---|---|---|---|---|
| A | 13452 | 10618 | 3 | 3 | 0.02% | 0.03% | 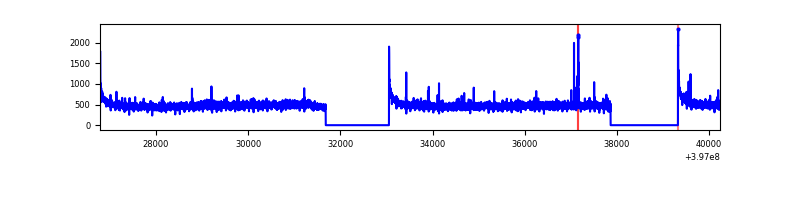 |
| B | 13452 | 10618 | 1287 | 1287 | 9.57% | 12.12% | 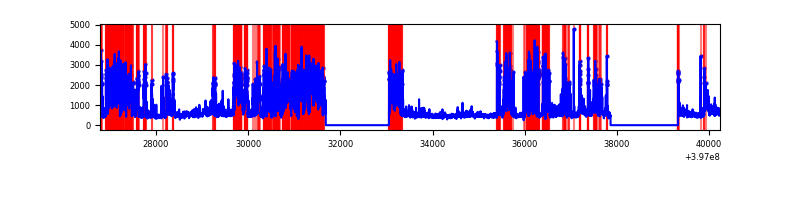 |
| C | 13452 | 10618 | 33 | 33 | 0.25% | 0.31% | 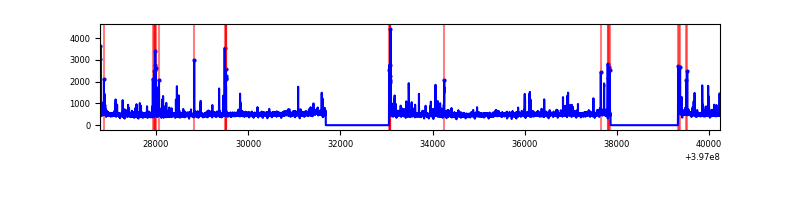 |
| D | 13452 | 10618 | 375 | 375 | 2.79% | 3.53% | 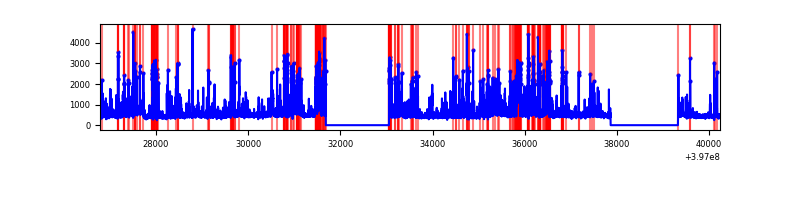 |
Top three noisy pixels from each quadrant. If the there are fewer than three noisy pixels in the level2.evt file, extra rows are filled as -1
| Pixel properties | Quadrant properties | ||||||
|---|---|---|---|---|---|---|---|
| Quadrant | DetID | PixID | Counts | Sigma | Mean | Median | Sigma |
| A | 10 | 83 | 380250 | 1552.39 | 1215 | 1192 | 244.2 |
| A | 13 | 6 | 32472 | 128.1 | 1215 | 1192 | 244.2 |
| A | 7 | 16 | 22247 | 86.23 | 1215 | 1192 | 244.2 |
| B | 5 | 184 | 5428377 | 24895.42 | 1131 | 1101 | 218.0 |
| B | 0 | 221 | 227916 | 1040.42 | 1131 | 1101 | 218.0 |
| B | 5 | 172 | 67896 | 306.39 | 1131 | 1101 | 218.0 |
| C | 15 | 214 | 448893 | 1623.58 | 1183 | 1194 | 275.7 |
| C | 0 | 10 | 156014 | 561.46 | 1183 | 1194 | 275.7 |
| C | 1 | 23 | 119115 | 427.64 | 1183 | 1194 | 275.7 |
| D | 12 | 17 | 1133022 | 4004.8 | 1163 | 1131 | 282.6 |
| D | 1 | 52 | 815420 | 2881.08 | 1163 | 1131 | 282.6 |
| D | 13 | 249 | 220033 | 774.51 | 1163 | 1131 | 282.6 |
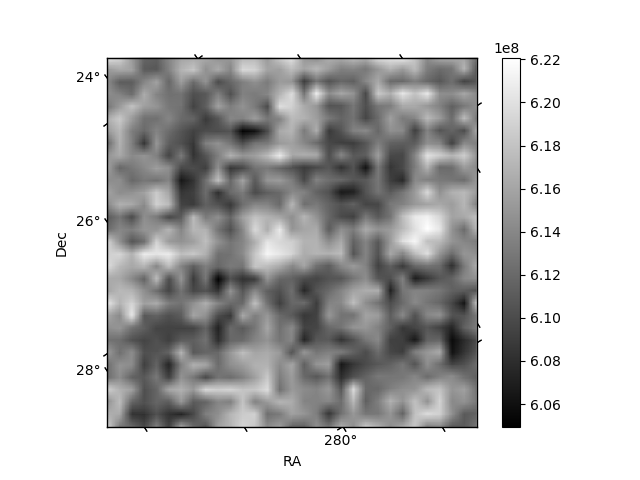
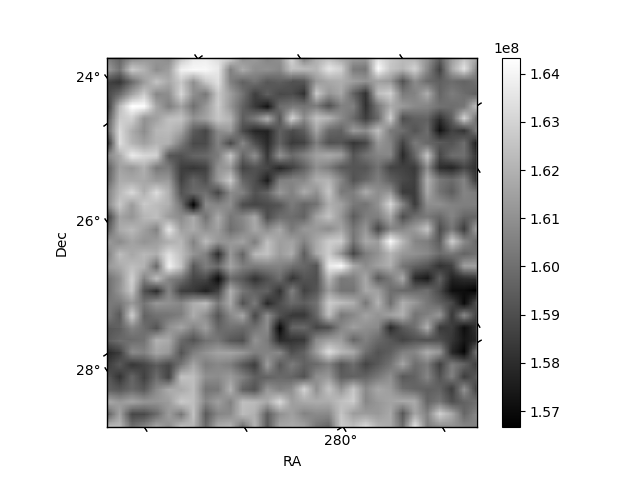
Histogram calculated using DETX and DETY for each event in the final _common_clean file
| Quadrant A | 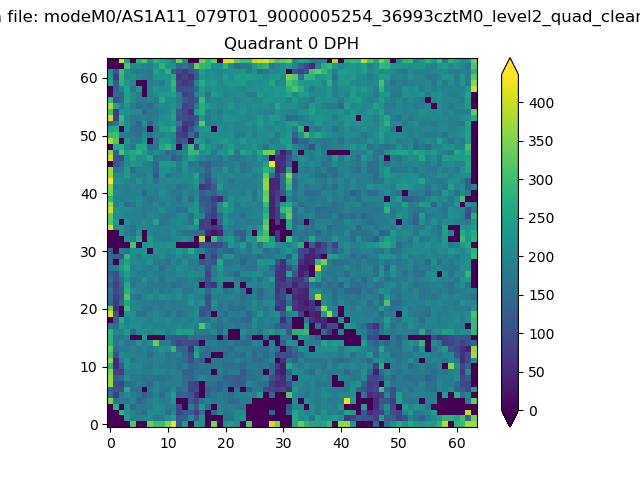 |
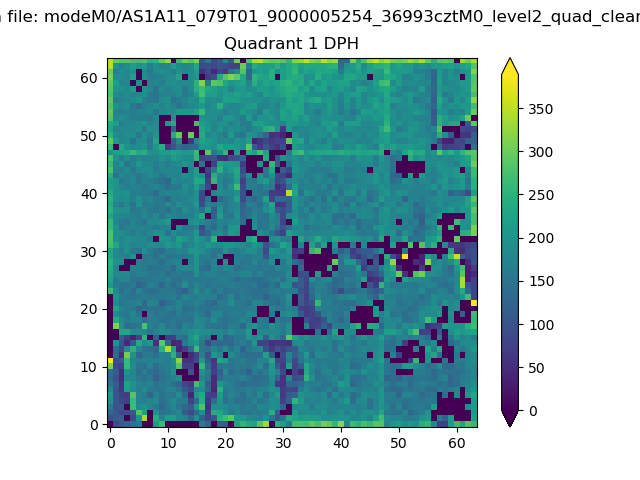 |
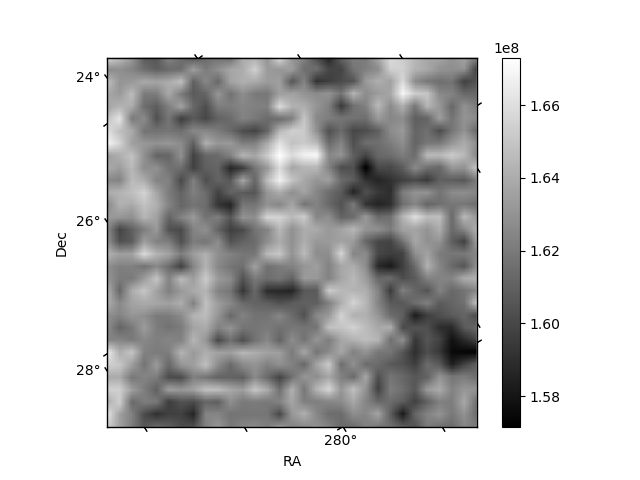
Quadrant B |
|---|---|---|---|
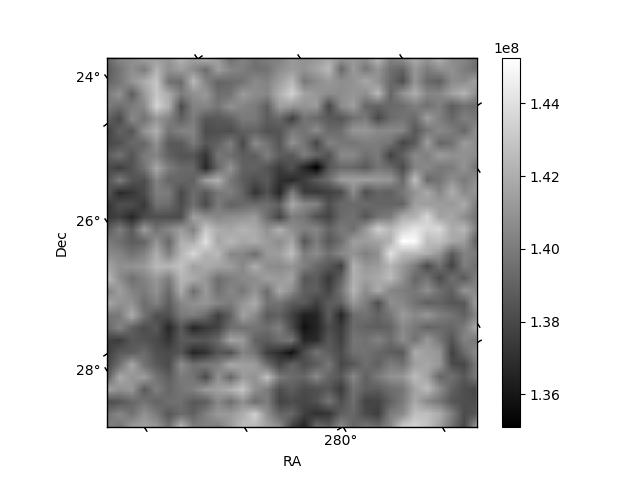
| Quadrant D | 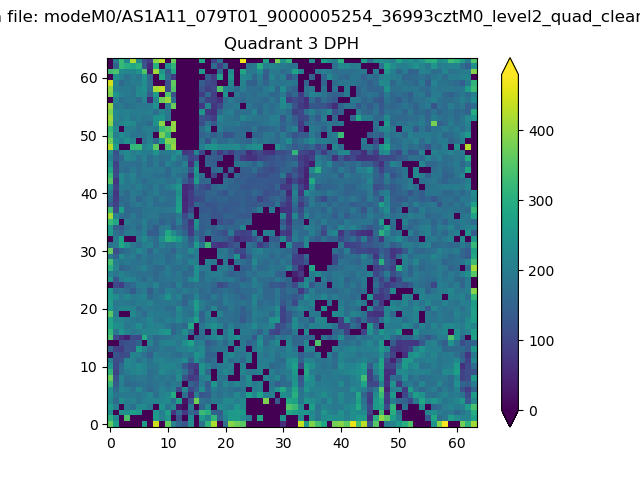 |
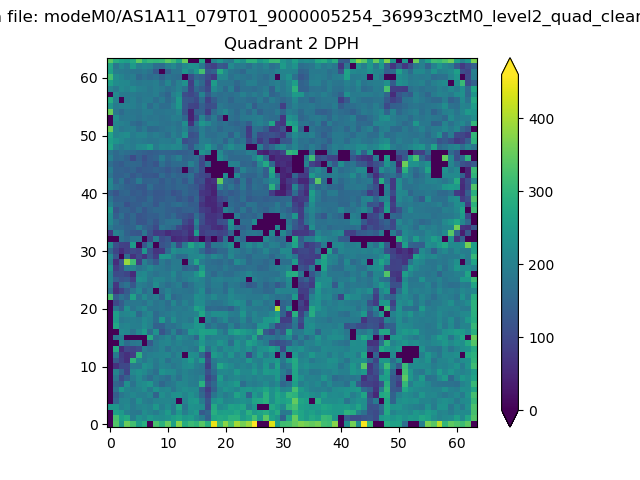 |
Quadrant C |
| Plot type | Count rate plots | Images |
|---|---|---|
| Comparison with Poisson distribution Blue bars denote a histogram of data divided into 1 sec bins. Red curve is a Poisson curve with rate = median count rate of data. |
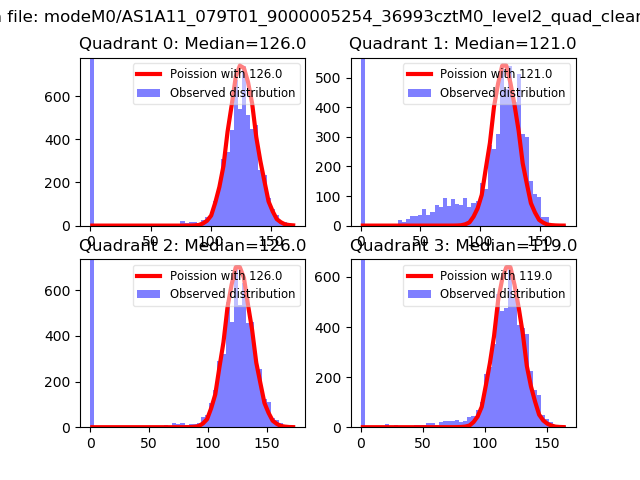 |
 |
| Quadrant-wise count rates Data is divided into 100 sec bins |
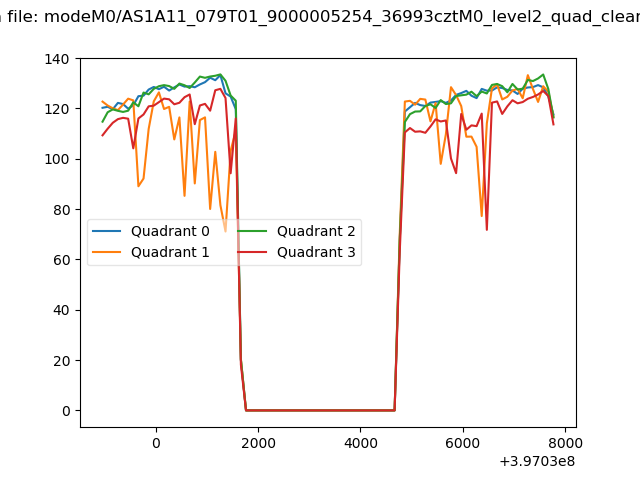 |
|
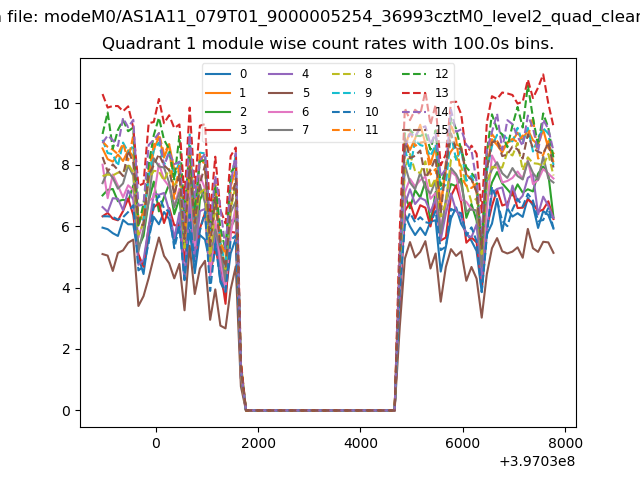
| Module-wise count rates for Quadrant A Data is divided into 100 sec bins |
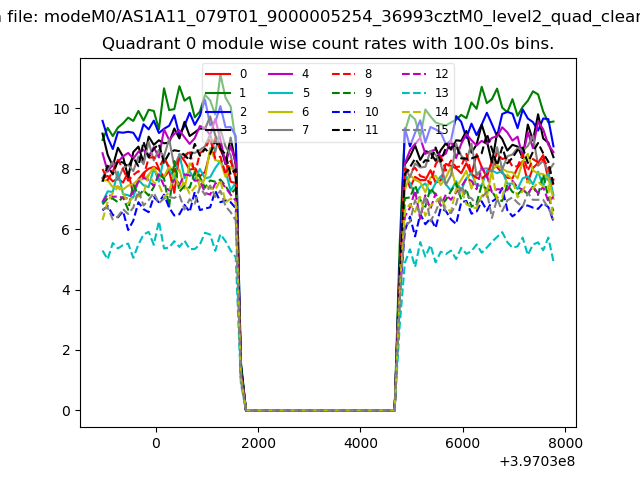 |
 |
| Module-wise count rates for Quadrant B Data is divided into 100 sec bins |
 |
 |
| Module-wise count rates for Quadrant C Data is divided into 100 sec bins |
 |
 |
| Module-wise count rates for Quadrant D Data is divided into 100 sec bins |
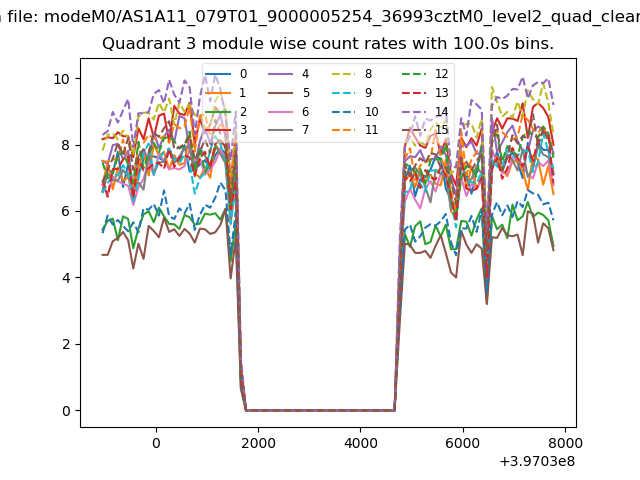 |
 |
| Parameter | Plot |
|---|---|
| CZT HV Monitor | 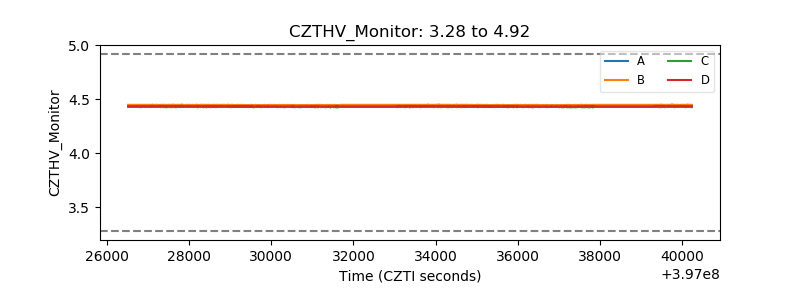 |
| D_VDD |  |
| Temperature 1 | 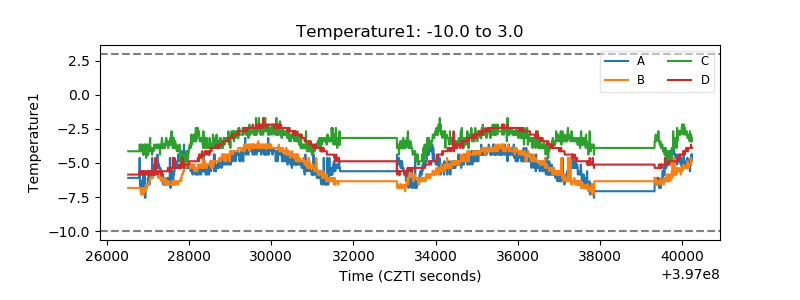 |
| Veto HV Monitor | 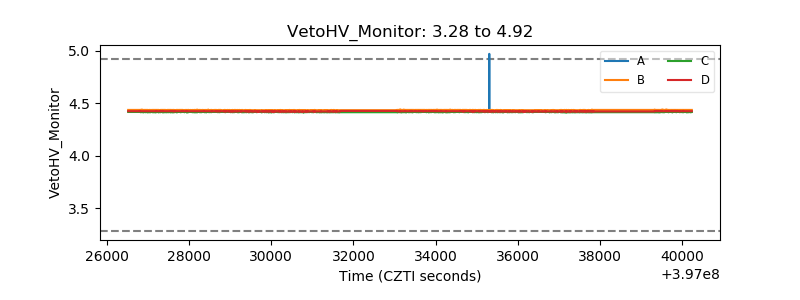 |
| Veto LLD | 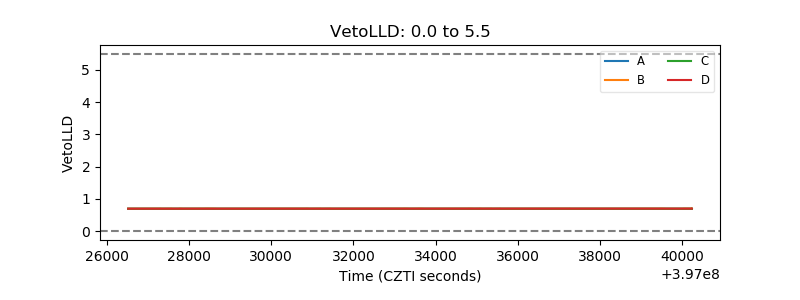 |
| Alpha Counter | 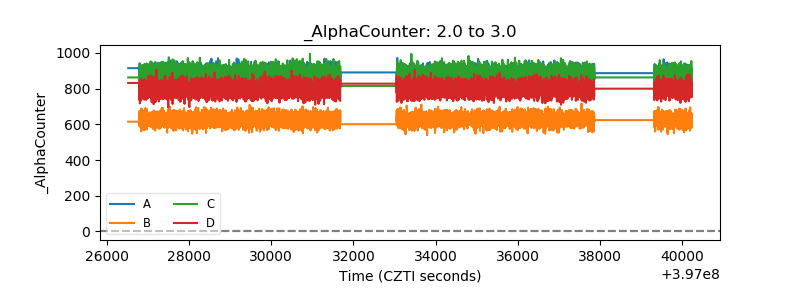 |
| _CPM_Rate | 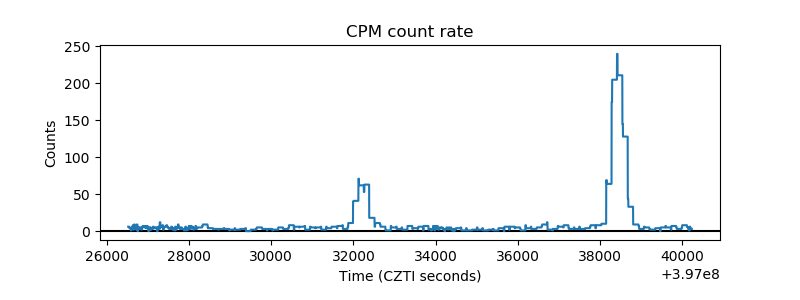 |
| CZT Counter | 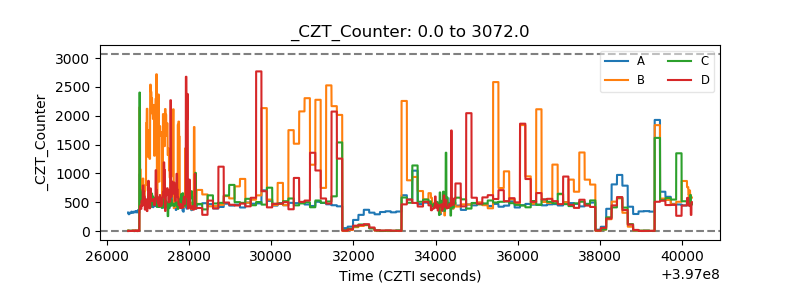 |
| +2.5 Volts monitor | 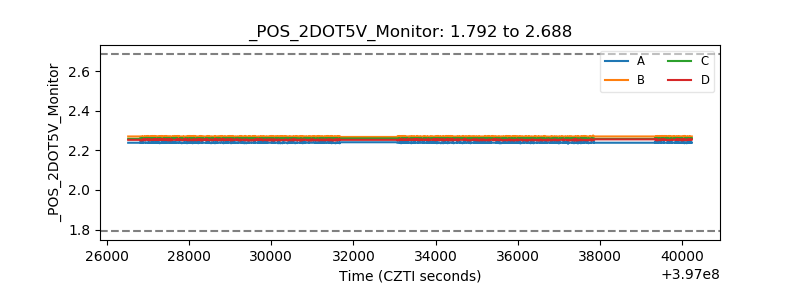 |
| +5 Volts monitor | 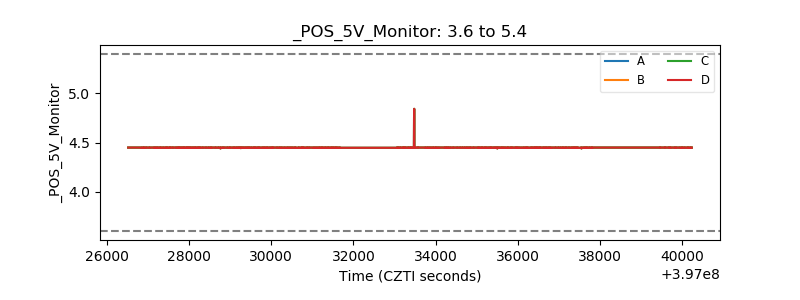 |
| _ROLL_ROT | 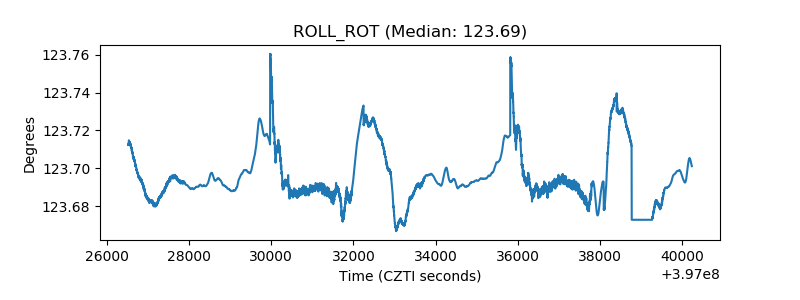 |
| _Roll_DEC | 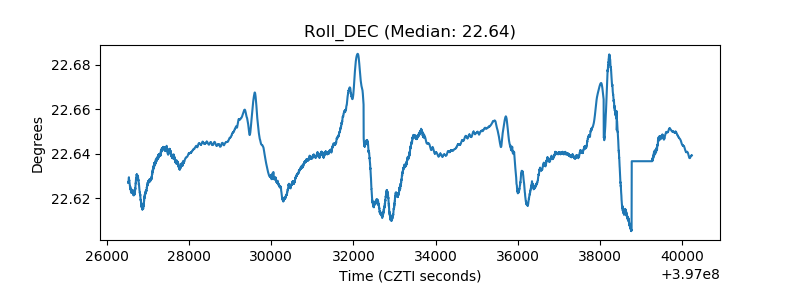 |
| _Roll_RA | 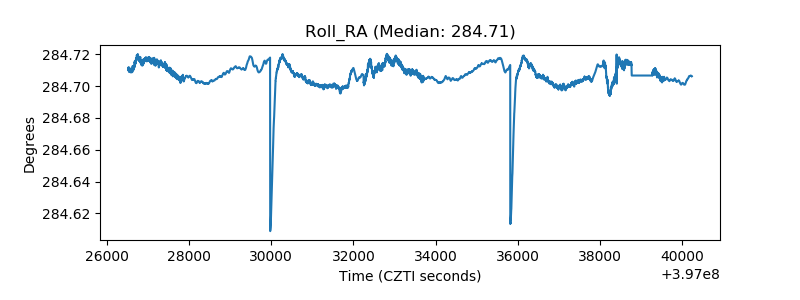 |
| Veto Counter | 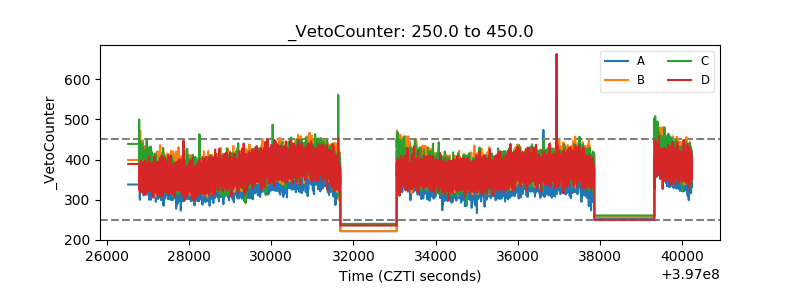 |