| Param | Original file | Final file |
|---|---|---|
| Filename | modeM0/AS1A11_079T01_9000005254_36994cztM0_level2.evt | modeM0/AS1A11_079T01_9000005254_36994cztM0_level2_quad_clean.evt |
| Size (bytes) | 579,674,880 | 84,720,960 |
| Size | 552.8 MB | 80.8 MB |
| Events in quadrant A | 3,284,781 | 545,330 |
| Events in quadrant B | 6,581,582 | 492,451 |
| Events in quadrant C | 3,546,146 | 548,216 |
| Events in quadrant D | 3,696,019 | 519,163 |
| Mode SS | |||
|---|---|---|---|
| Quadrant | BADHDUFLAG | Total packets | Discarded packets |
| A | 0 | 136 | 0 |
| B | 0 | 136 | 0 |
| C | 0 | 136 | 0 |
| D | 0 | 136 | 0 |
| Mode M9 | |||
|---|---|---|---|
| Quadrant | BADHDUFLAG | Total packets | Discarded packets |
| A | 0 | 31 | 0 |
| B | 0 | 31 | 0 |
| C | 0 | 31 | 0 |
| D | 0 | 31 | 0 |
| Mode M0 | |||
|---|---|---|---|
| Quadrant | BADHDUFLAG | Total packets | Discarded packets |
| A | 0 | 13887 | 3 |
| B | 0 | 24104 | 2 |
| C | 0 | 14401 | 2 |
| D | 0 | 15292 | 2 |
| Quadrant | Total seconds | Saturated seconds | Saturation percentage |
|---|---|---|---|
| A | 6596 | 14 | 0.212250% |
| B | 6596 | 1042 | 15.797453% |
| C | 6596 | 46 | 0.697392% |
| D | 6596 | 100 | 1.516070% |
Noise dominated data is calculated using 1-second bins in cleaned event files. If a bin has >2000 counts, and if more than 50% of those come from <1% of pixels, then it is considered to be noise-dominated and hence unusable.
| Quadrant | # 1 sec bins | Bins with >0 counts | Bins with >2000 counts | High rate bins dominated by noise | Noise dominated (total time) | Noise dominated (detector-on time) | Marked lightcurve |
|---|---|---|---|---|---|---|---|
| A | 9642 | 6598 | 7 | 7 | 0.07% | 0.11% | 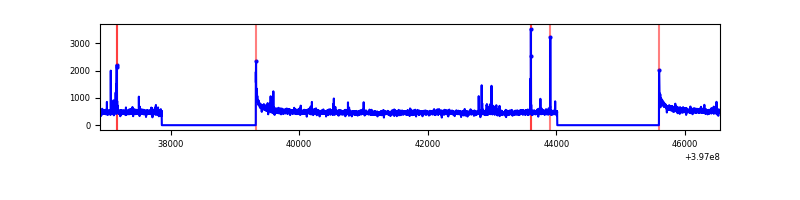 |
| B | 9642 | 6598 | 819 | 819 | 8.49% | 12.41% | 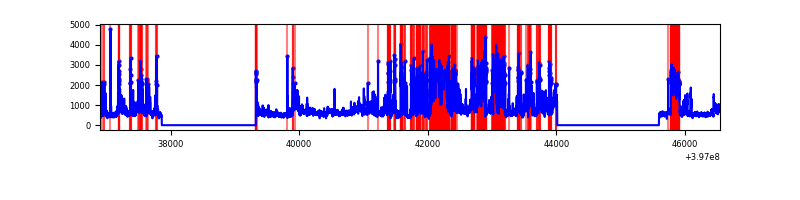 |
| C | 9642 | 6598 | 31 | 31 | 0.32% | 0.47% | 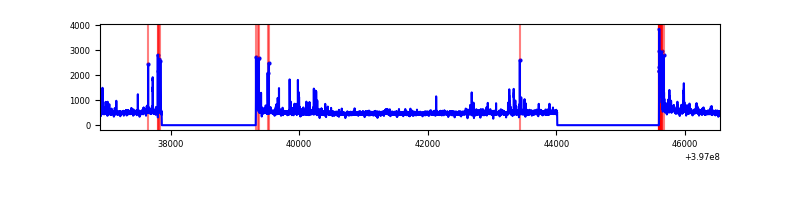 |
| D | 9642 | 6598 | 104 | 104 | 1.08% | 1.58% | 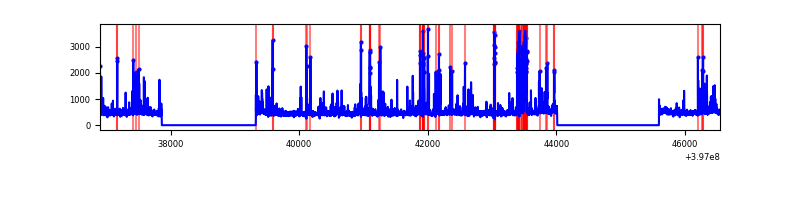 |
Top three noisy pixels from each quadrant. If the there are fewer than three noisy pixels in the level2.evt file, extra rows are filled as -1
| Pixel properties | Quadrant properties | ||||||
|---|---|---|---|---|---|---|---|
| Quadrant | DetID | PixID | Counts | Sigma | Mean | Median | Sigma |
| A | 10 | 83 | 246550 | 1578.16 | 766 | 750 | 155.8 |
| A | 9 | 143 | 45767 | 289.03 | 766 | 750 | 155.8 |
| A | 7 | 16 | 19291 | 119.04 | 766 | 750 | 155.8 |
| B | 5 | 184 | 3443285 | 25096.35 | 710 | 691 | 137.2 |
| B | 4 | 81 | 83206 | 601.53 | 710 | 691 | 137.2 |
| B | 0 | 221 | 77040 | 556.58 | 710 | 691 | 137.2 |
| C | 15 | 214 | 282685 | 1614.44 | 746 | 753 | 174.6 |
| C | 14 | 254 | 90352 | 513.07 | 746 | 753 | 174.6 |
| C | 0 | 10 | 75676 | 429.04 | 746 | 753 | 174.6 |
| D | 12 | 17 | 210290 | 1158.24 | 741 | 723 | 180.9 |
| D | 1 | 52 | 180402 | 993.06 | 741 | 723 | 180.9 |
| D | 13 | 249 | 156121 | 858.86 | 741 | 723 | 180.9 |
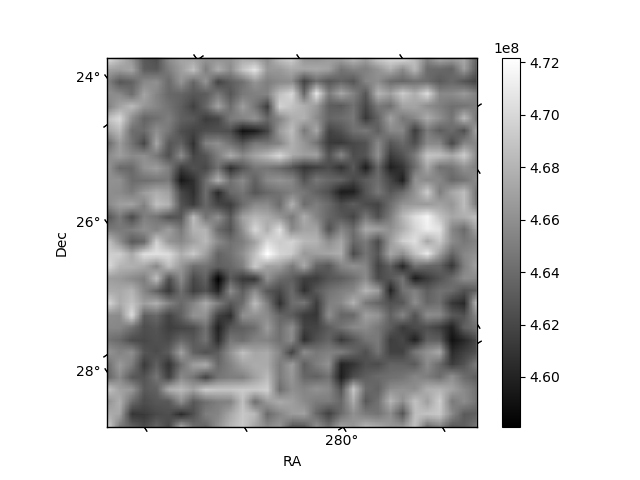
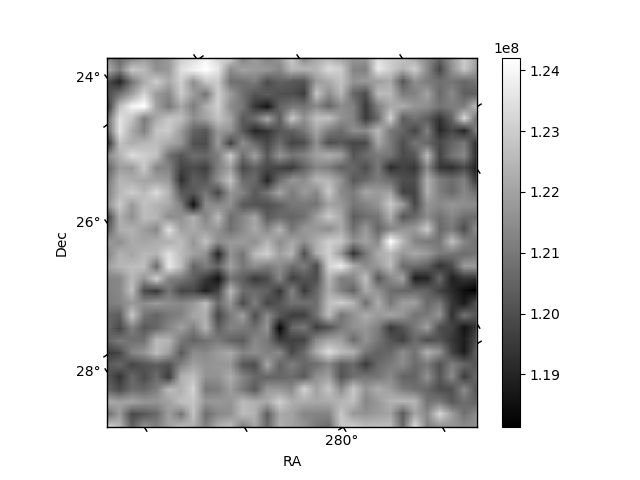
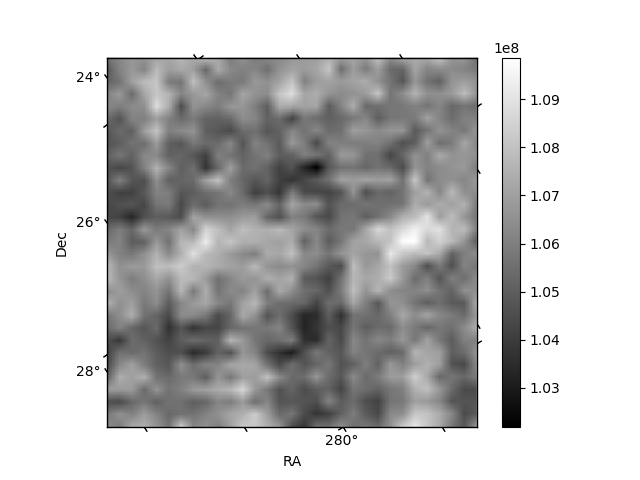
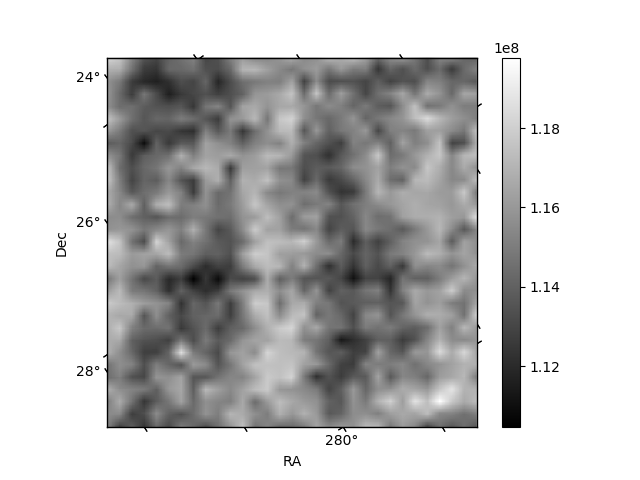
Histogram calculated using DETX and DETY for each event in the final _common_clean file
| Quadrant A | 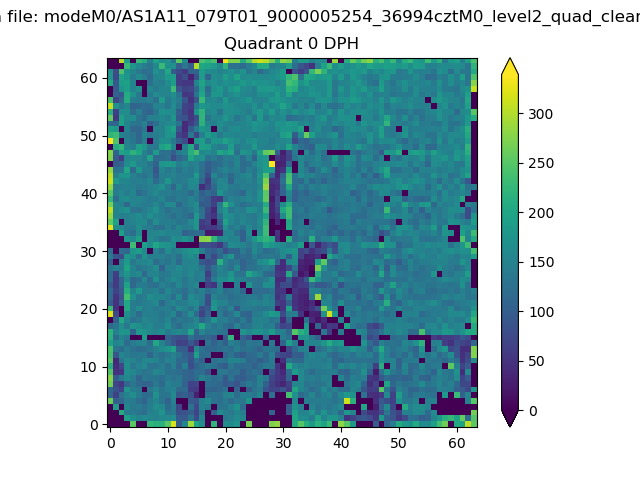 |
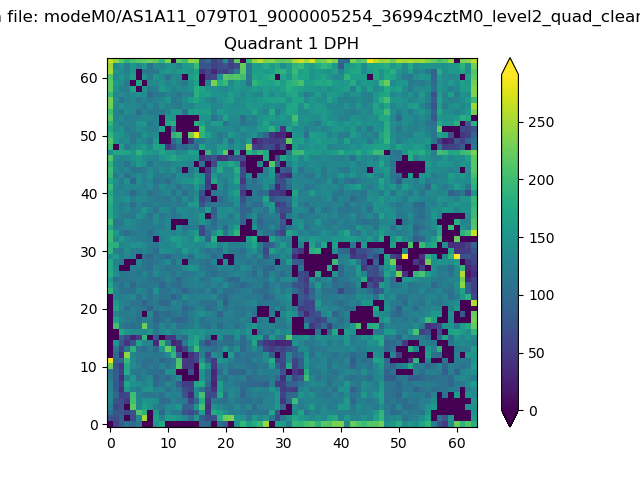 |
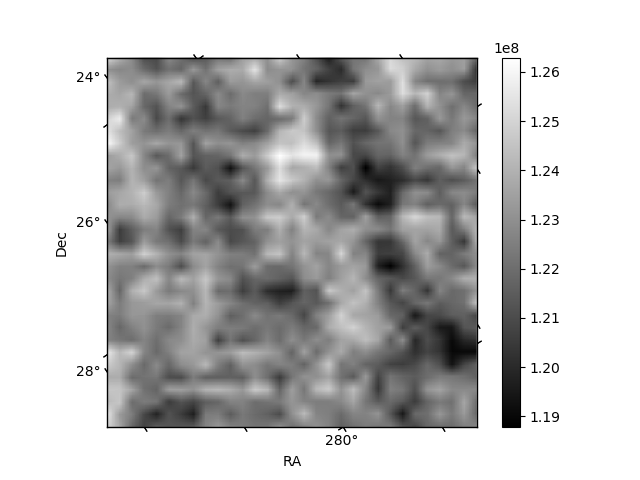
Quadrant B |
|---|---|---|---|
| Quadrant D | 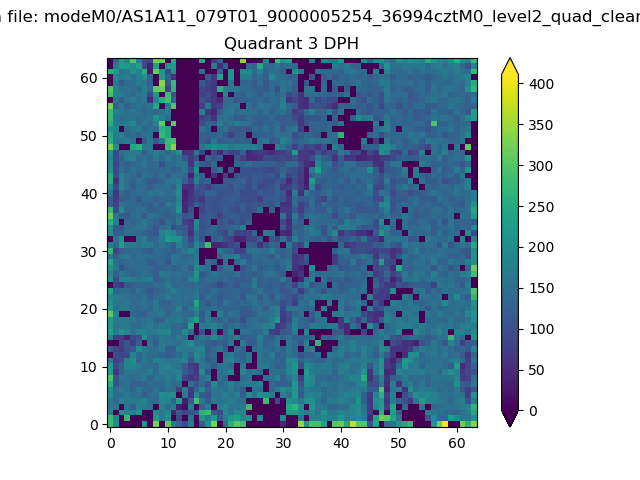 |
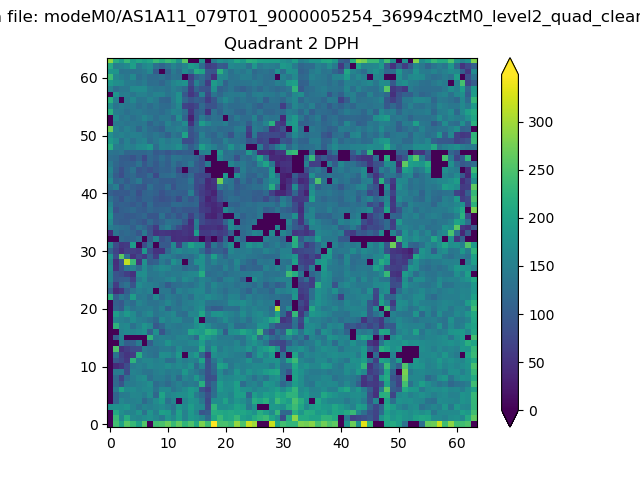 |
Quadrant C |
| Plot type | Count rate plots | Images |
|---|---|---|
| Comparison with Poisson distribution Blue bars denote a histogram of data divided into 1 sec bins. Red curve is a Poisson curve with rate = median count rate of data. |
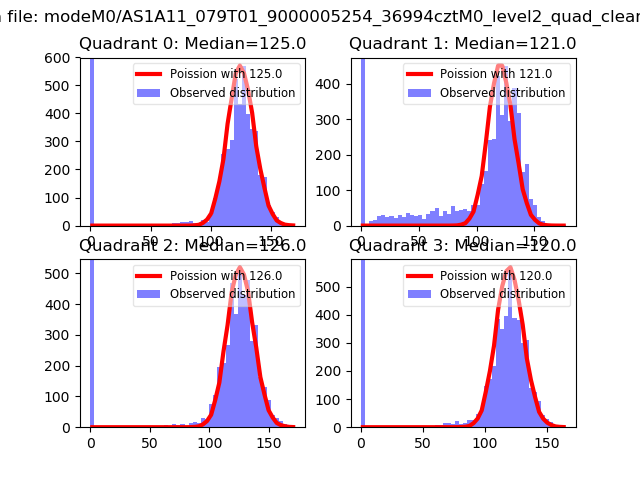 |
 |
| Quadrant-wise count rates Data is divided into 100 sec bins |
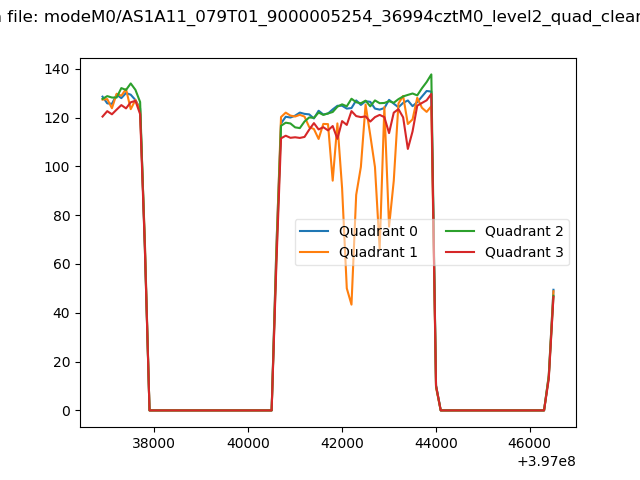 |
|
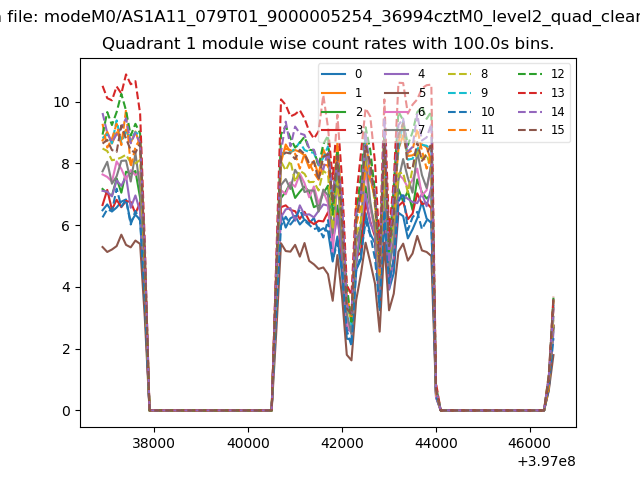
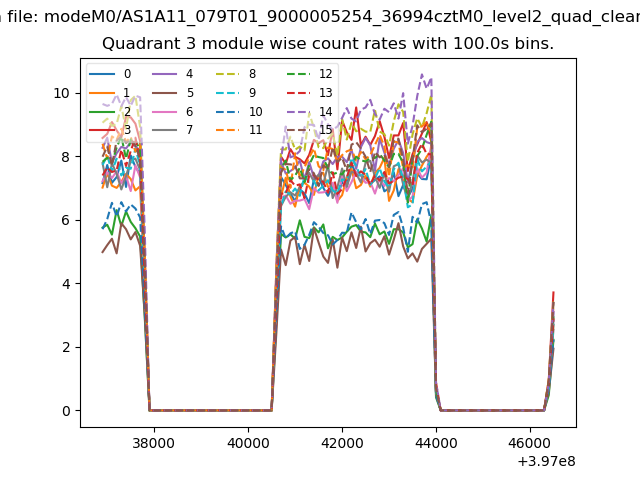
| Module-wise count rates for Quadrant A Data is divided into 100 sec bins |
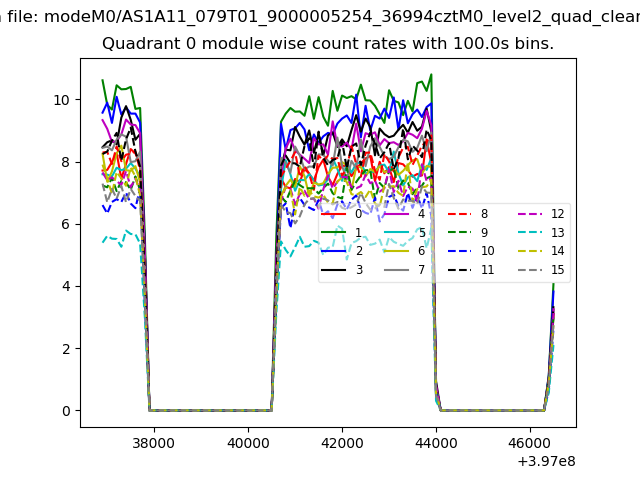 |
 |
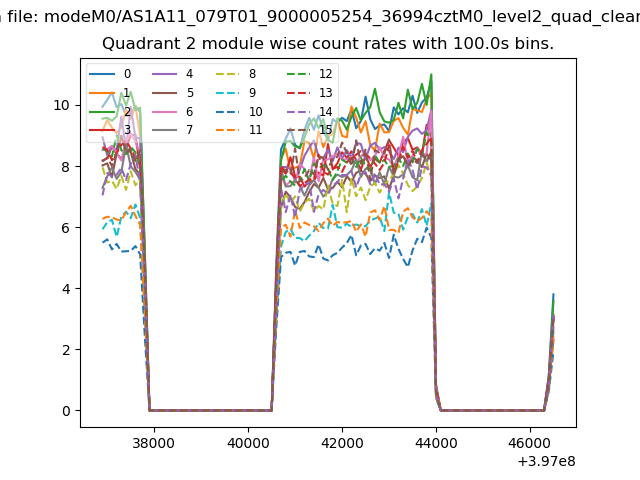
| Module-wise count rates for Quadrant B Data is divided into 100 sec bins |
 |
 |
| Module-wise count rates for Quadrant C Data is divided into 100 sec bins |
 |
 |
| Module-wise count rates for Quadrant D Data is divided into 100 sec bins |
 |
 |
| Parameter | Plot |
|---|---|
| CZT HV Monitor | 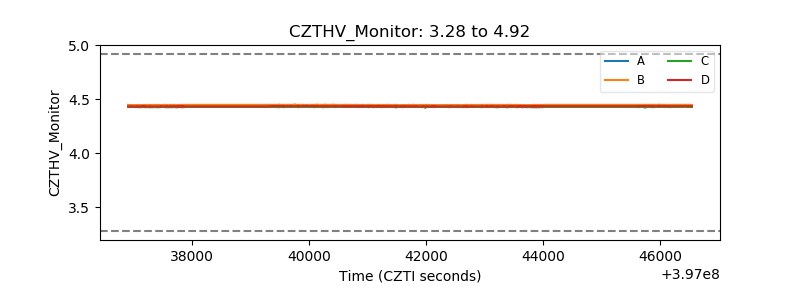 |
| D_VDD | 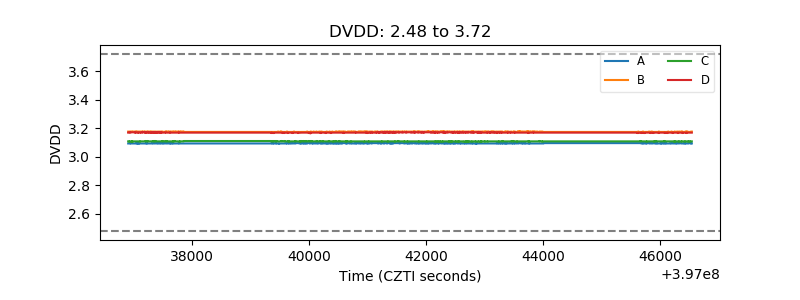 |
| Temperature 1 | 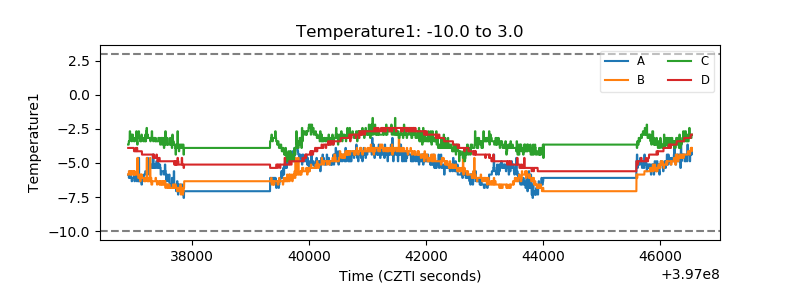 |
| Veto HV Monitor | 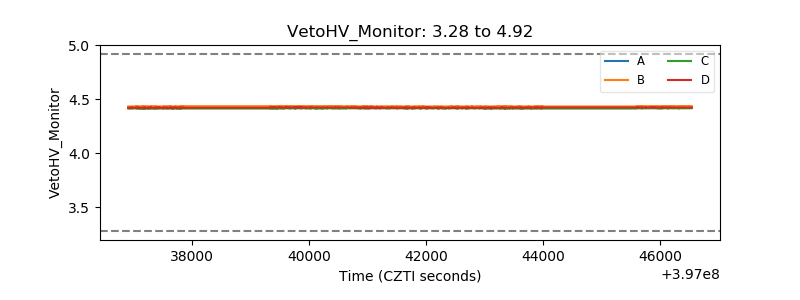 |
| Veto LLD | 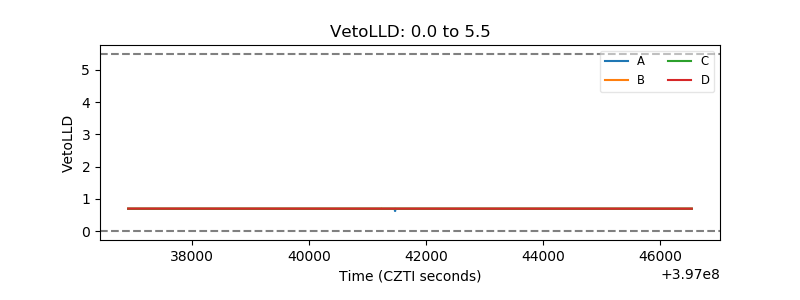 |
| Alpha Counter | 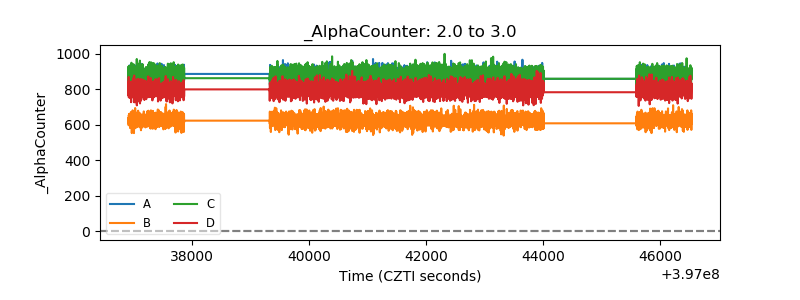 |
| _CPM_Rate | 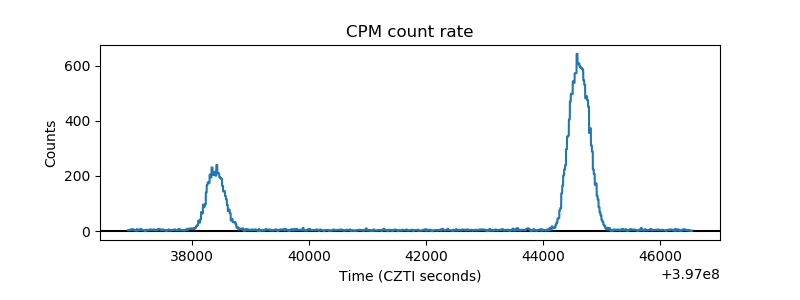 |
| CZT Counter | 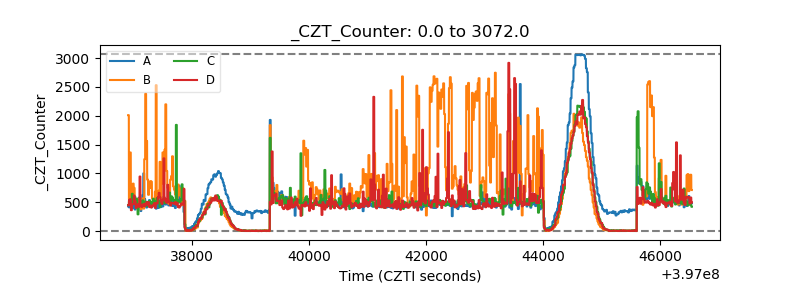 |
| +2.5 Volts monitor | 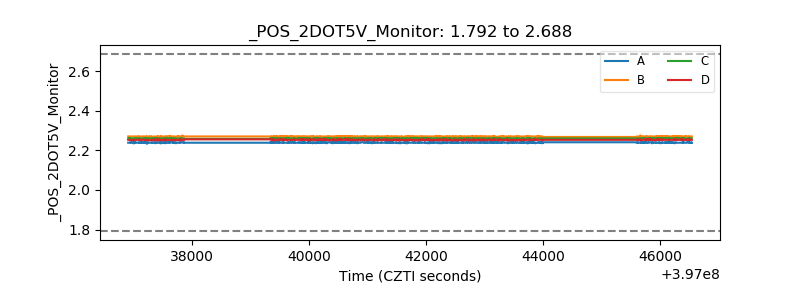 |
| +5 Volts monitor | 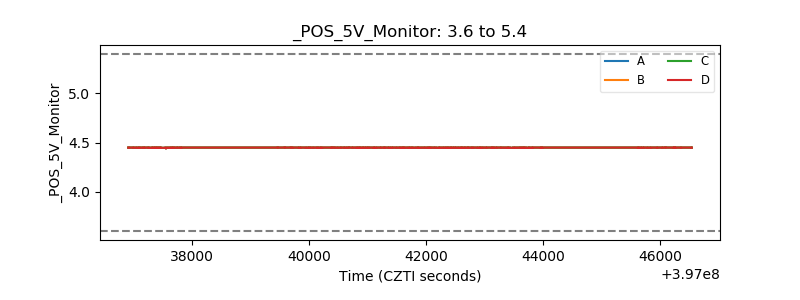 |
| _ROLL_ROT | 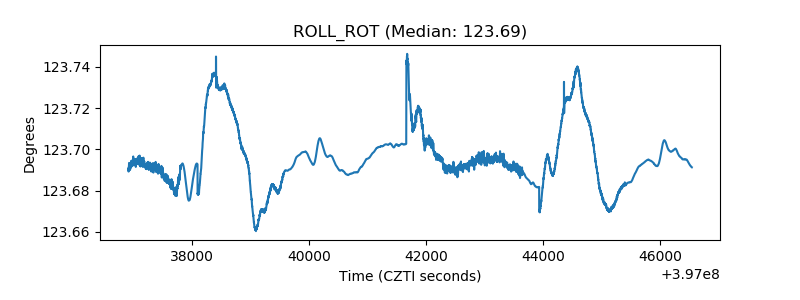 |
| _Roll_DEC | 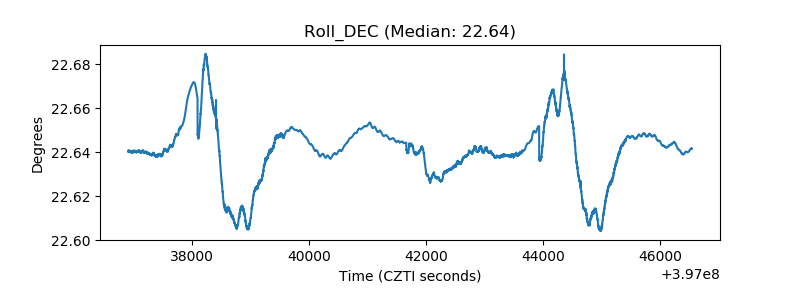 |
| _Roll_RA | 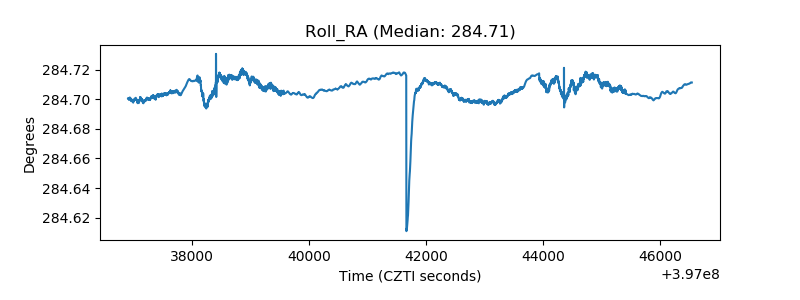 |
| Veto Counter | 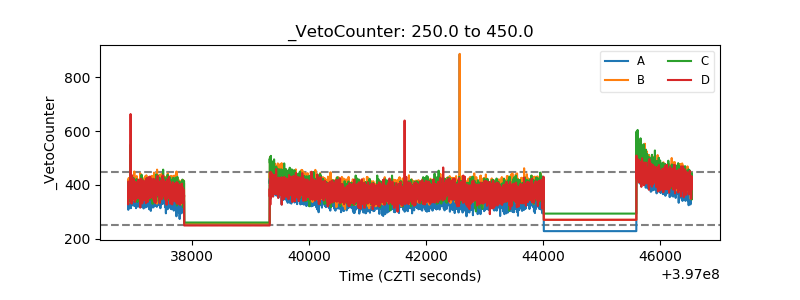 |