| Param | Original file | Final file |
|---|---|---|
| Filename | modeM0/AS1A11_079T01_9000005254_36995cztM0_level2.evt | modeM0/AS1A11_079T01_9000005254_36995cztM0_level2_quad_clean.evt |
| Size (bytes) | 492,258,240 | 81,046,080 |
| Size | 469.5 MB | 77.3 MB |
| Events in quadrant A | 2,823,353 | 529,602 |
| Events in quadrant B | 5,114,702 | 509,772 |
| Events in quadrant C | 3,013,144 | 527,742 |
| Events in quadrant D | 3,580,306 | 498,329 |
| Mode SS | |||
|---|---|---|---|
| Quadrant | BADHDUFLAG | Total packets | Discarded packets |
| A | 0 | 116 | 0 |
| B | 0 | 116 | 0 |
| C | 0 | 116 | 0 |
| D | 0 | 116 | 0 |
| Mode M9 | |||
|---|---|---|---|
| Quadrant | BADHDUFLAG | Total packets | Discarded packets |
| A | 0 | 33 | 0 |
| B | 0 | 33 | 0 |
| C | 0 | 33 | 0 |
| D | 0 | 33 | 0 |
| Mode M0 | |||
|---|---|---|---|
| Quadrant | BADHDUFLAG | Total packets | Discarded packets |
| A | 0 | 11905 | 4 |
| B | 0 | 18845 | 2 |
| C | 0 | 12239 | 2 |
| D | 0 | 14175 | 2 |
| Quadrant | Total seconds | Saturated seconds | Saturation percentage |
|---|---|---|---|
| A | 5549 | 17 | 0.306362% |
| B | 5549 | 638 | 11.497567% |
| C | 5549 | 36 | 0.648766% |
| D | 5549 | 189 | 3.406019% |
Noise dominated data is calculated using 1-second bins in cleaned event files. If a bin has >2000 counts, and if more than 50% of those come from <1% of pixels, then it is considered to be noise-dominated and hence unusable.
| Quadrant | # 1 sec bins | Bins with >0 counts | Bins with >2000 counts | High rate bins dominated by noise | Noise dominated (total time) | Noise dominated (detector-on time) | Marked lightcurve |
|---|---|---|---|---|---|---|---|
| A | 8867 | 5552 | 6 | 6 | 0.07% | 0.11% | 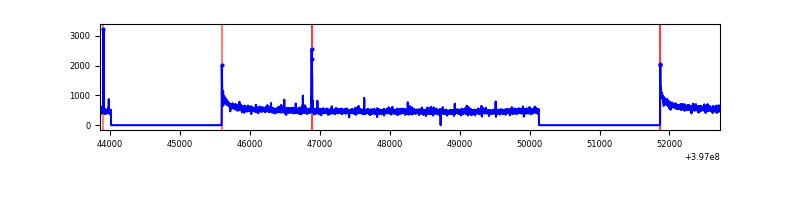 |
| B | 8867 | 5552 | 473 | 473 | 5.33% | 8.52% | 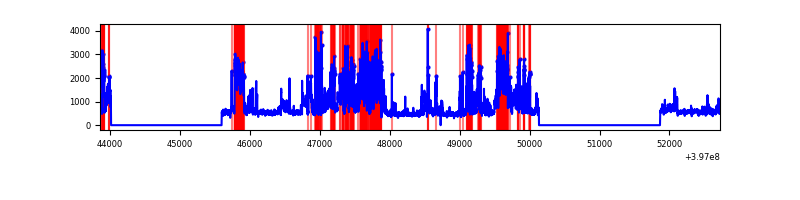 |
| C | 8867 | 5552 | 29 | 29 | 0.33% | 0.52% | 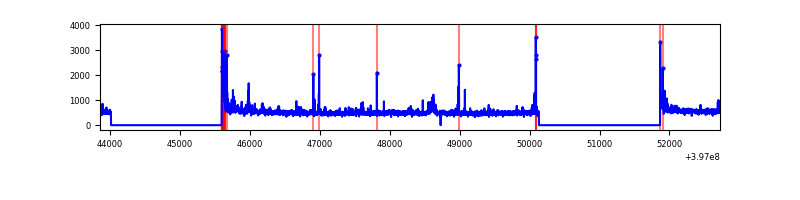 |
| D | 8867 | 5552 | 158 | 158 | 1.78% | 2.85% | 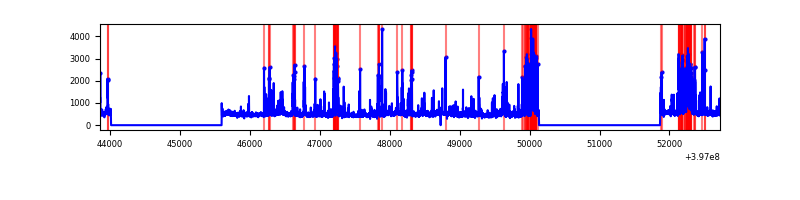 |
Top three noisy pixels from each quadrant. If the there are fewer than three noisy pixels in the level2.evt file, extra rows are filled as -1
| Pixel properties | Quadrant properties | ||||||
|---|---|---|---|---|---|---|---|
| Quadrant | DetID | PixID | Counts | Sigma | Mean | Median | Sigma |
| A | 10 | 83 | 225495 | 1702.37 | 662 | 650 | 132.1 |
| A | 9 | 143 | 29092 | 215.34 | 662 | 650 | 132.1 |
| A | 13 | 6 | 9579 | 67.6 | 662 | 650 | 132.1 |
| B | 5 | 184 | 2160046 | 17611.31 | 633 | 615 | 122.6 |
| B | 4 | 81 | 317002 | 2580.3 | 633 | 615 | 122.6 |
| B | 4 | 232 | 77283 | 625.27 | 633 | 615 | 122.6 |
| C | 15 | 214 | 240906 | 1605.22 | 642 | 647 | 149.7 |
| C | 0 | 10 | 70621 | 467.51 | 642 | 647 | 149.7 |
| C | 0 | 207 | 51636 | 340.67 | 642 | 647 | 149.7 |
| D | 2 | 250 | 621478 | 3962.86 | 635 | 619 | 156.7 |
| D | 1 | 52 | 263657 | 1678.94 | 635 | 619 | 156.7 |
| D | 2 | 120 | 80569 | 510.31 | 635 | 619 | 156.7 |
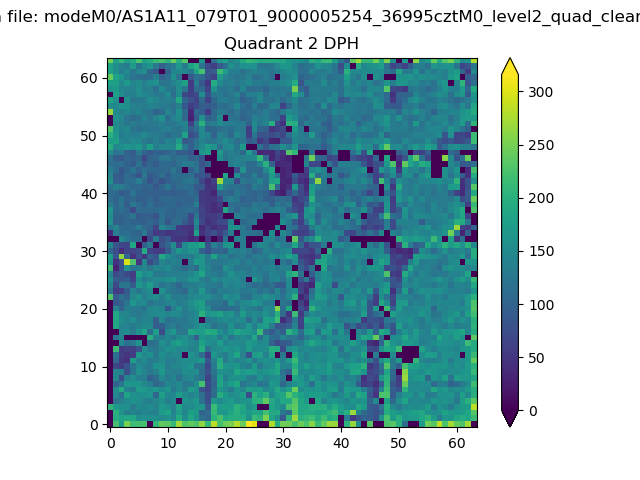
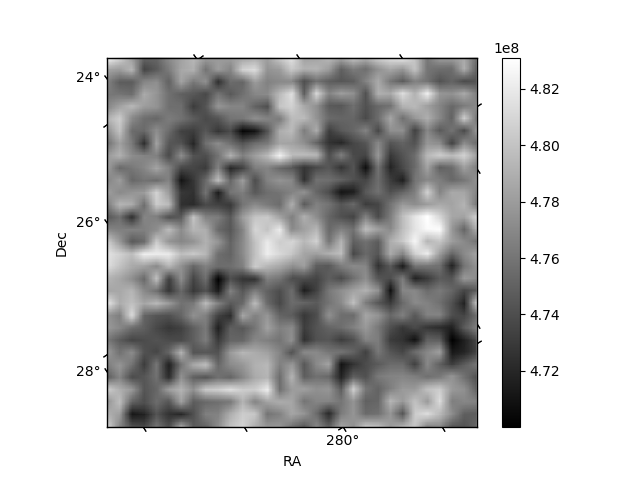
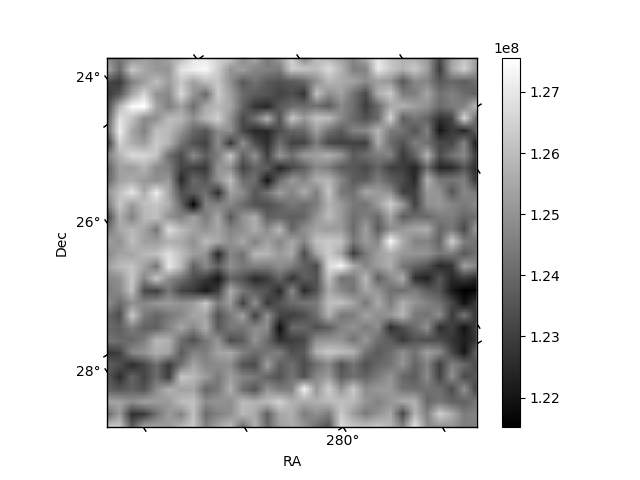
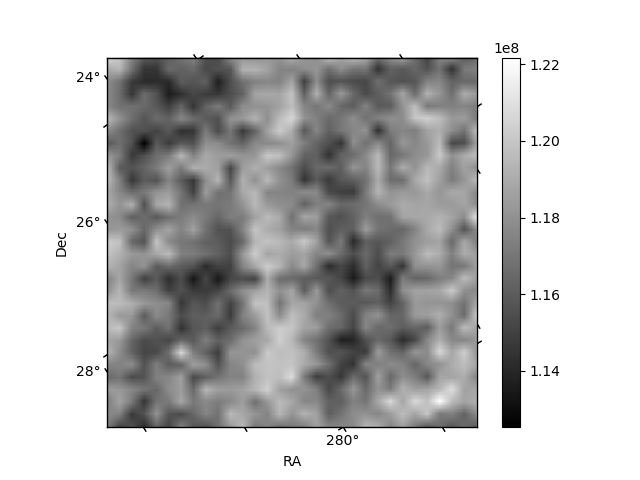
Histogram calculated using DETX and DETY for each event in the final _common_clean file
| Quadrant A | 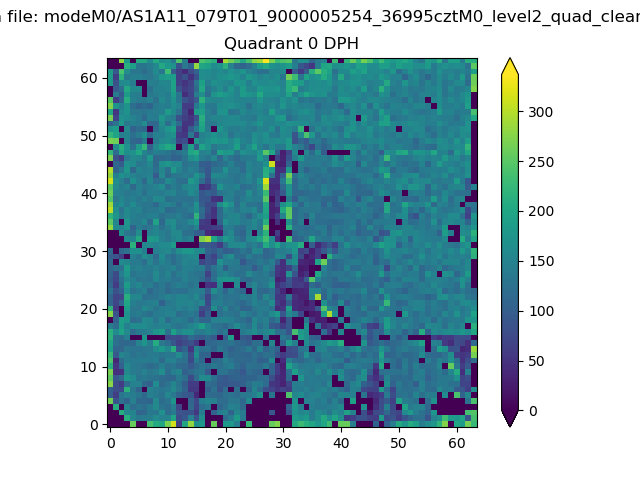 |
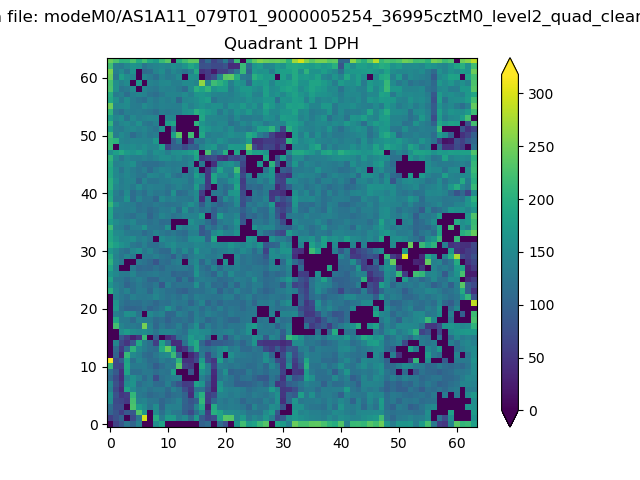 |
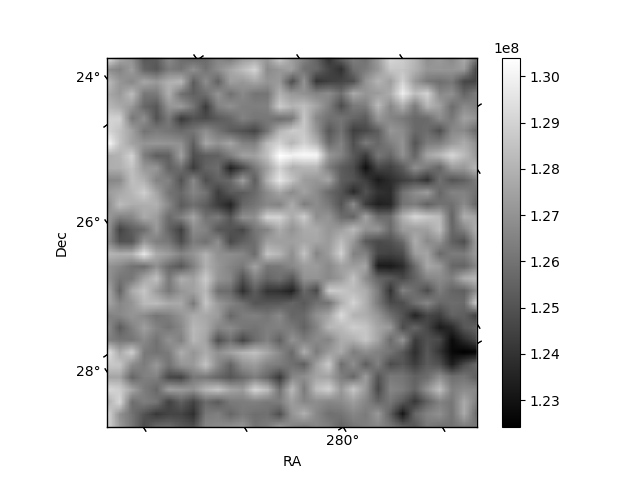
Quadrant B |
|---|---|---|---|
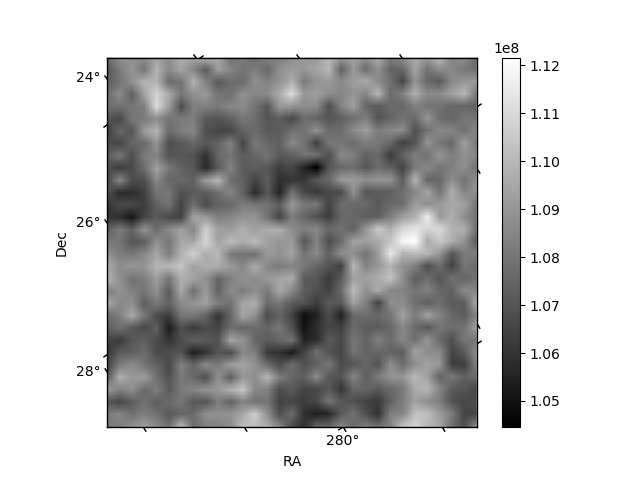
| Quadrant D | 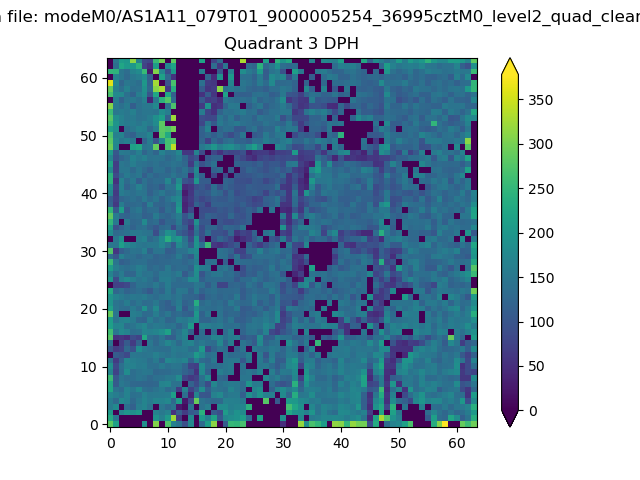 |
 |
Quadrant C |
| Plot type | Count rate plots | Images |
|---|---|---|
| Comparison with Poisson distribution Blue bars denote a histogram of data divided into 1 sec bins. Red curve is a Poisson curve with rate = median count rate of data. |
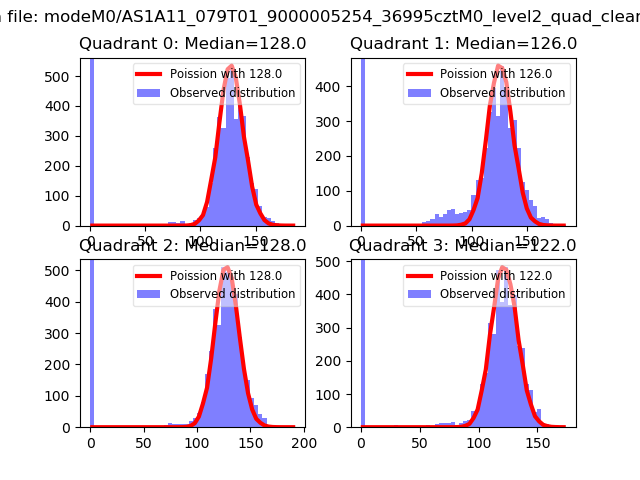 |
 |
| Quadrant-wise count rates Data is divided into 100 sec bins |
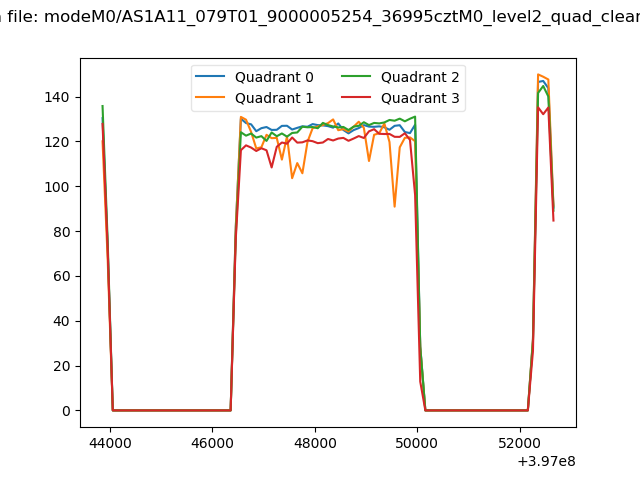 |
|
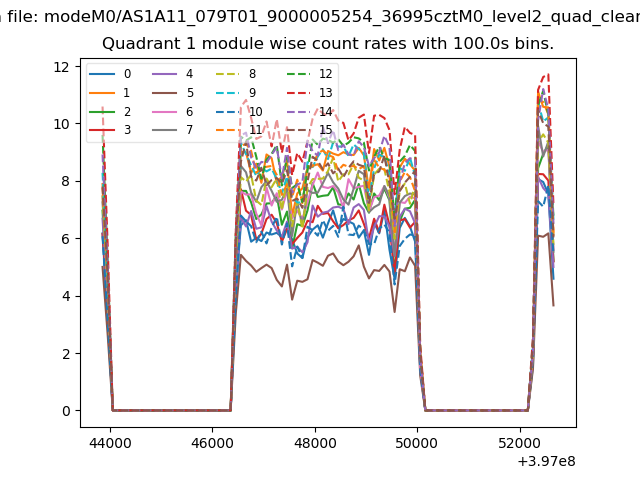
| Module-wise count rates for Quadrant A Data is divided into 100 sec bins |
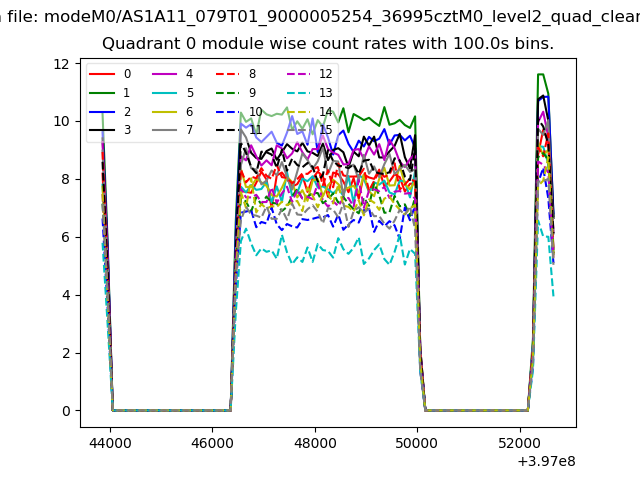 |
 |
| Module-wise count rates for Quadrant B Data is divided into 100 sec bins |
 |
 |
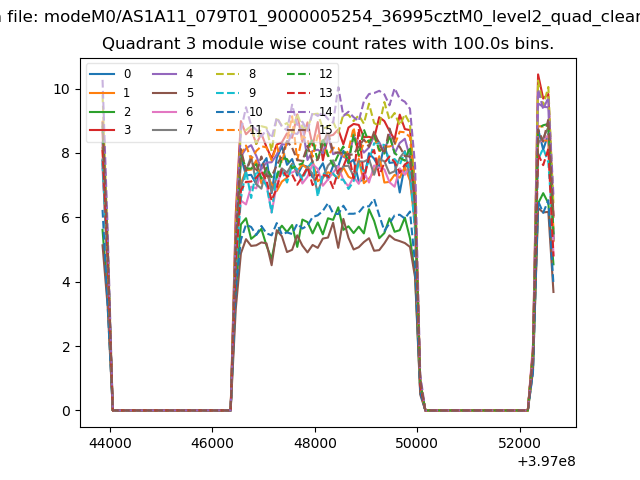
| Module-wise count rates for Quadrant C Data is divided into 100 sec bins |
 |
 |
| Module-wise count rates for Quadrant D Data is divided into 100 sec bins |
 |
 |
| Parameter | Plot |
|---|---|
| CZT HV Monitor |  |
| D_VDD | 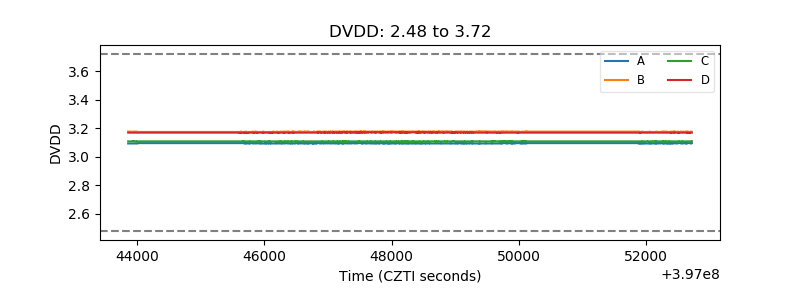 |
| Temperature 1 | 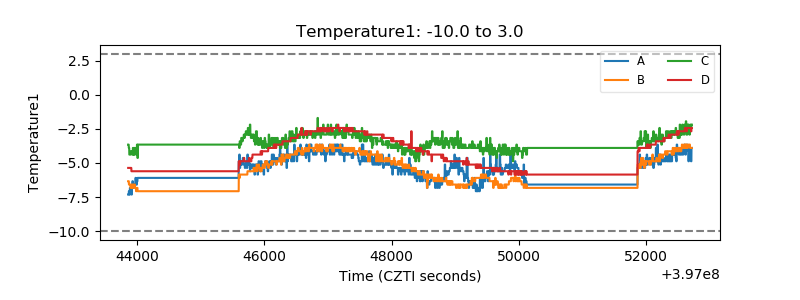 |
| Veto HV Monitor | 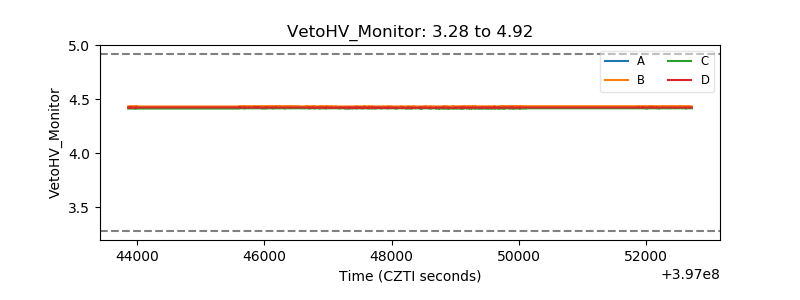 |
| Veto LLD | 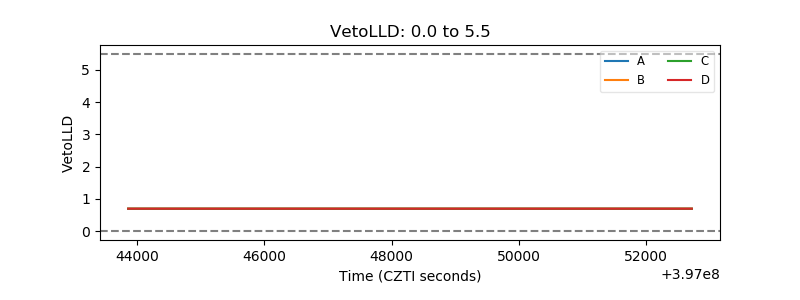 |
| Alpha Counter | 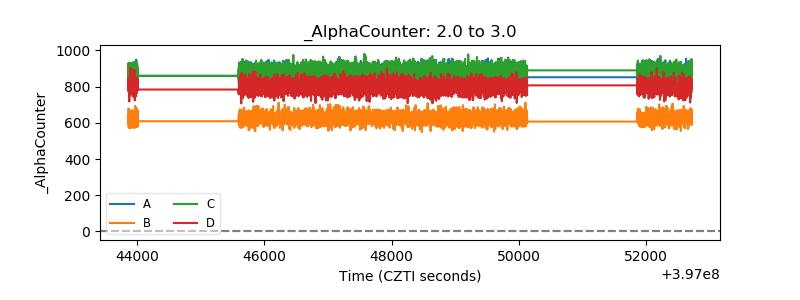 |
| _CPM_Rate | 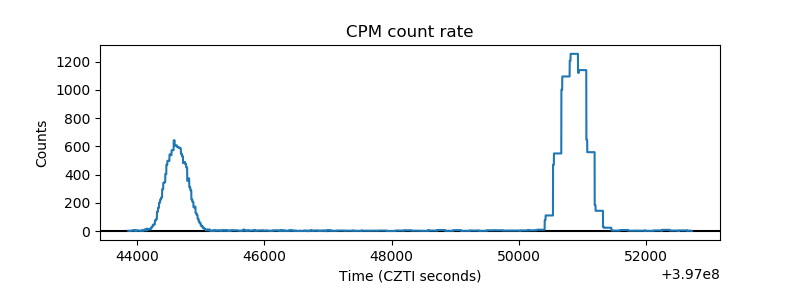 |
| CZT Counter | 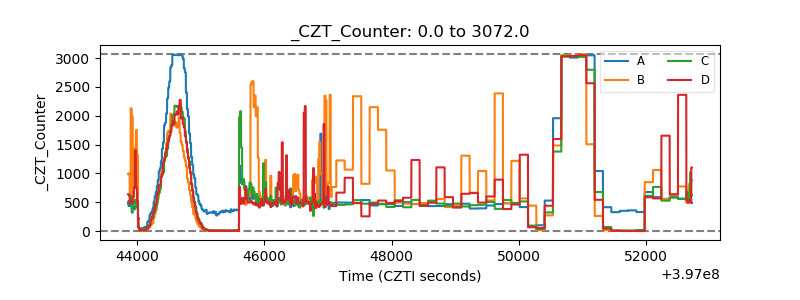 |
| +2.5 Volts monitor | 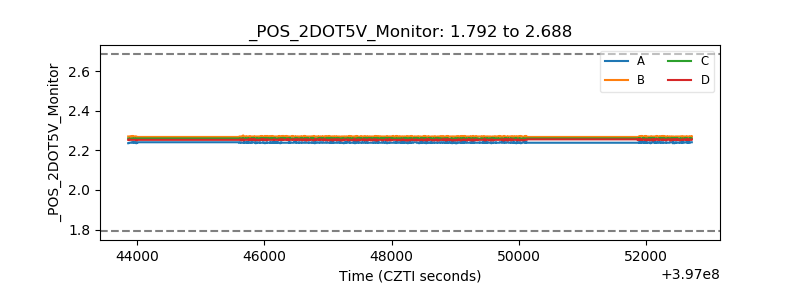 |
| +5 Volts monitor | 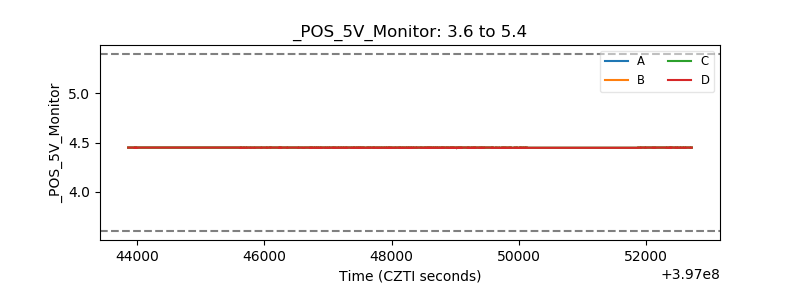 |
| _ROLL_ROT | 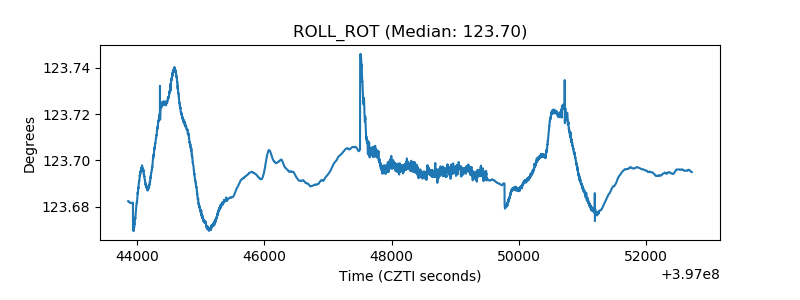 |
| _Roll_DEC | 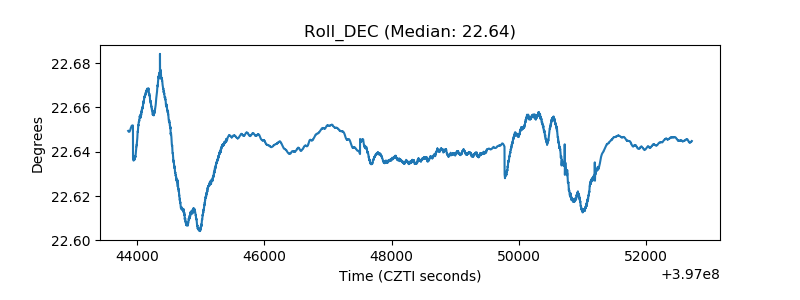 |
| _Roll_RA | 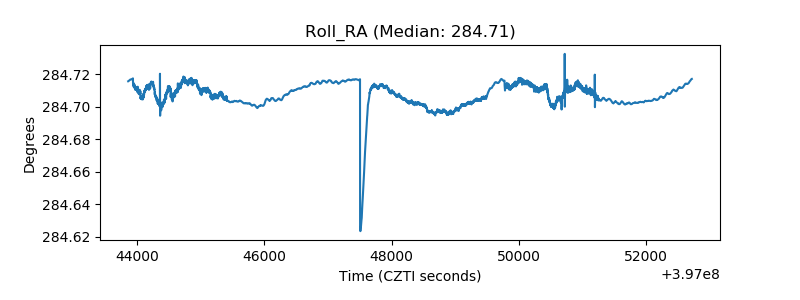 |
| Veto Counter | 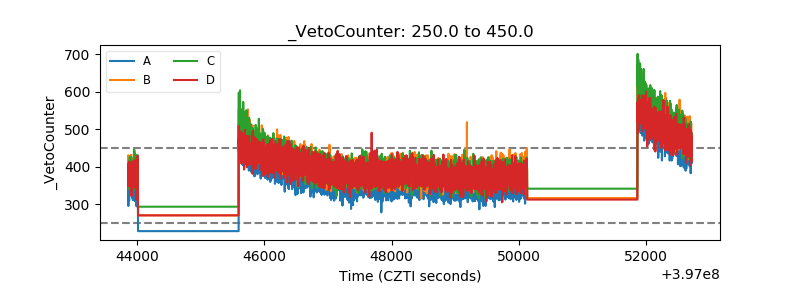 |