| Param | Original file | Final file |
|---|---|---|
| Filename | modeM0/AS1A11_079T01_9000005254_36998cztM0_level2.evt | modeM0/AS1A11_079T01_9000005254_36998cztM0_level2_quad_clean.evt |
| Size (bytes) | 446,195,520 | 99,043,200 |
| Size | 425.5 MB | 94.5 MB |
| Events in quadrant A | 2,781,850 | 674,203 |
| Events in quadrant B | 3,600,560 | 664,063 |
| Events in quadrant C | 3,326,195 | 665,400 |
| Events in quadrant D | 3,452,564 | 632,450 |
| Mode SS | |||
|---|---|---|---|
| Quadrant | BADHDUFLAG | Total packets | Discarded packets |
| A | 0 | 106 | 0 |
| B | 0 | 106 | 0 |
| C | 0 | 106 | 0 |
| D | 0 | 106 | 0 |
| Mode M9 | |||
|---|---|---|---|
| Quadrant | BADHDUFLAG | Total packets | Discarded packets |
| A | 0 | 31 | 0 |
| B | 0 | 31 | 0 |
| C | 0 | 31 | 0 |
| D | 0 | 32 | 0 |
| Mode M0 | |||
|---|---|---|---|
| Quadrant | BADHDUFLAG | Total packets | Discarded packets |
| A | 0 | 11511 | 3 |
| B | 0 | 14266 | 2 |
| C | 0 | 13215 | 2 |
| D | 0 | 13613 | 2 |
| Quadrant | Total seconds | Saturated seconds | Saturation percentage |
|---|---|---|---|
| A | 5185 | 13 | 0.250723% |
| B | 5185 | 190 | 3.664417% |
| C | 5185 | 104 | 2.005786% |
| D | 5185 | 153 | 2.950820% |
Noise dominated data is calculated using 1-second bins in cleaned event files. If a bin has >2000 counts, and if more than 50% of those come from <1% of pixels, then it is considered to be noise-dominated and hence unusable.
| Quadrant | # 1 sec bins | Bins with >0 counts | Bins with >2000 counts | High rate bins dominated by noise | Noise dominated (total time) | Noise dominated (detector-on time) | Marked lightcurve |
|---|---|---|---|---|---|---|---|
| A | 7157 | 5186 | 0 | 0 | 0.00% | 0.00% | 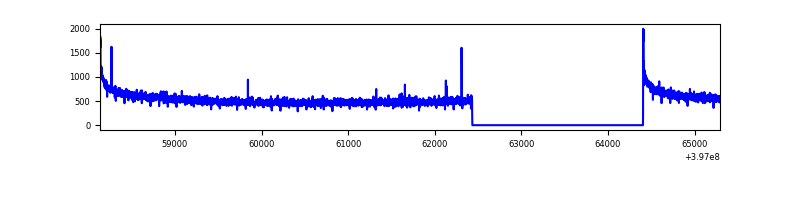 |
| B | 7157 | 5186 | 160 | 160 | 2.24% | 3.09% | 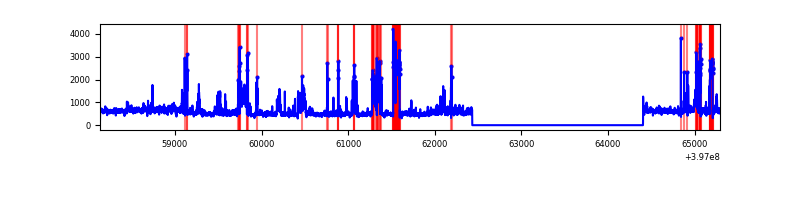 |
| C | 7157 | 5186 | 92 | 92 | 1.29% | 1.77% | 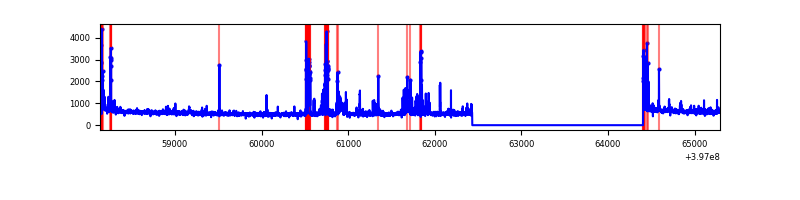 |
| D | 7157 | 5186 | 125 | 125 | 1.75% | 2.41% | 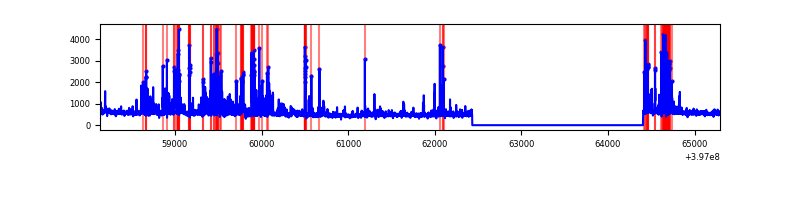 |
Top three noisy pixels from each quadrant. If the there are fewer than three noisy pixels in the level2.evt file, extra rows are filled as -1
| Pixel properties | Quadrant properties | ||||||
|---|---|---|---|---|---|---|---|
| Quadrant | DetID | PixID | Counts | Sigma | Mean | Median | Sigma |
| A | 10 | 83 | 214682 | 1620.85 | 662 | 651 | 132.0 |
| A | 13 | 254 | 6737 | 46.09 | 662 | 651 | 132.0 |
| A | 3 | 137 | 6352 | 43.17 | 662 | 651 | 132.0 |
| B | 5 | 184 | 848744 | 7074.85 | 638 | 625 | 119.9 |
| B | 0 | 155 | 65024 | 537.2 | 638 | 625 | 119.9 |
| B | 0 | 213 | 52981 | 436.74 | 638 | 625 | 119.9 |
| C | 10 | 20 | 276164 | 1840.29 | 645 | 652 | 149.7 |
| C | 15 | 214 | 223353 | 1487.54 | 645 | 652 | 149.7 |
| C | 1 | 23 | 142422 | 946.96 | 645 | 652 | 149.7 |
| D | 1 | 52 | 662560 | 4278.33 | 643 | 626 | 154.7 |
| D | 2 | 153 | 119183 | 766.28 | 643 | 626 | 154.7 |
| D | 12 | 227 | 118298 | 760.56 | 643 | 626 | 154.7 |
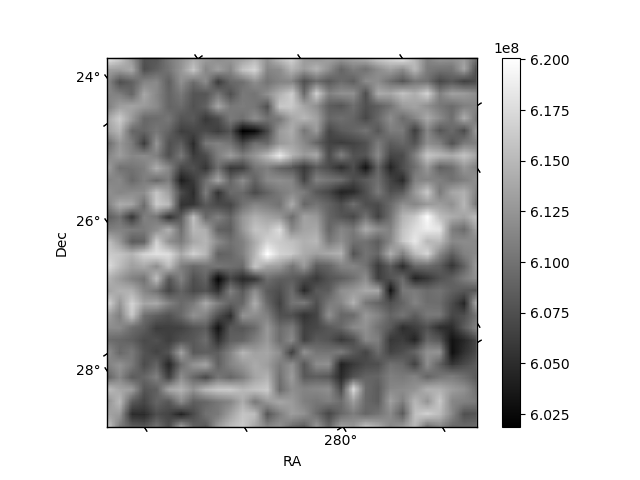
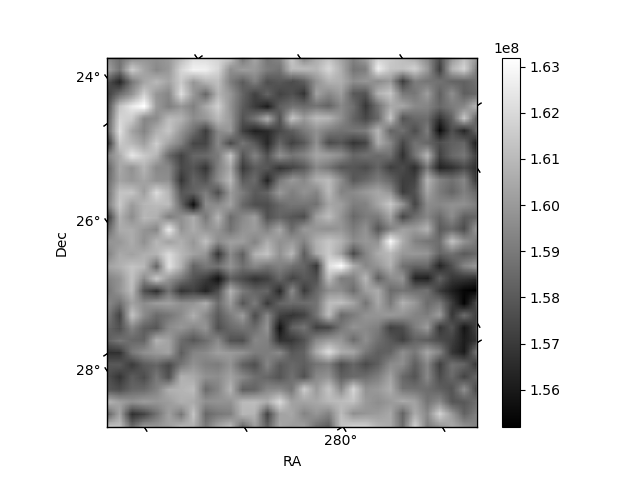
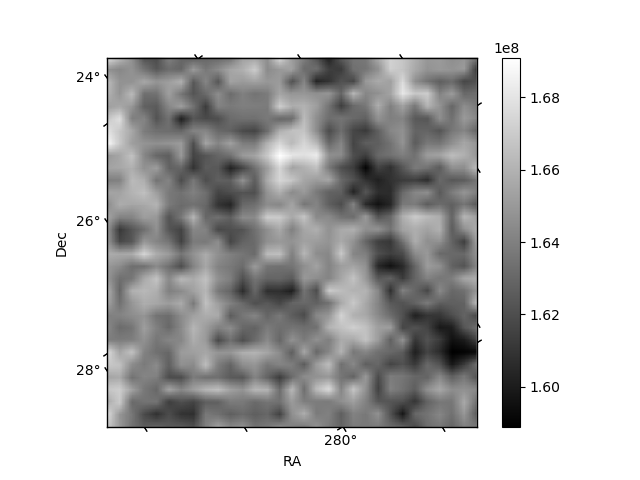
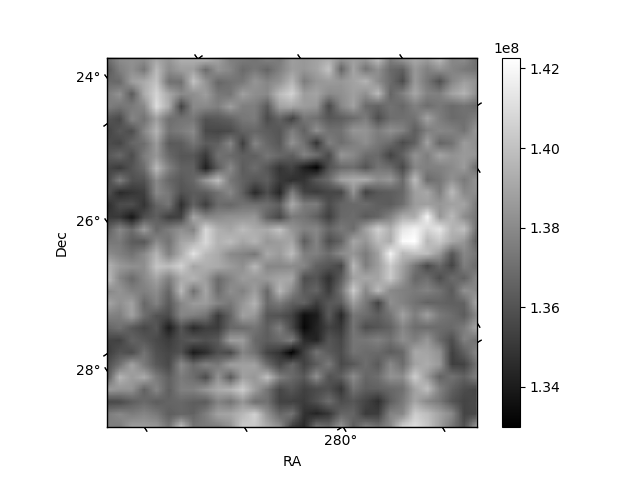
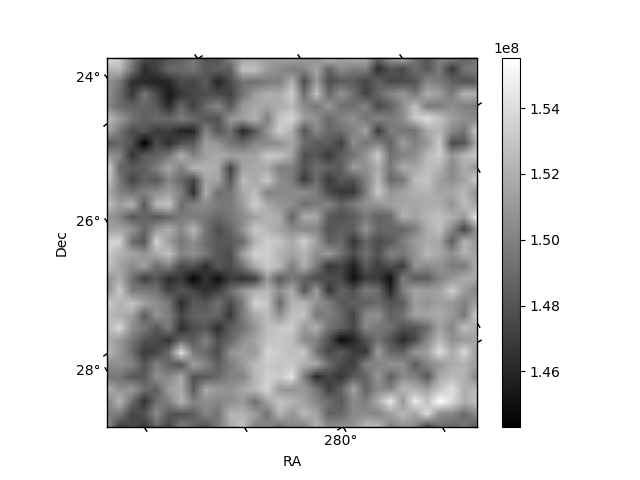
Histogram calculated using DETX and DETY for each event in the final _common_clean file
| Quadrant A | 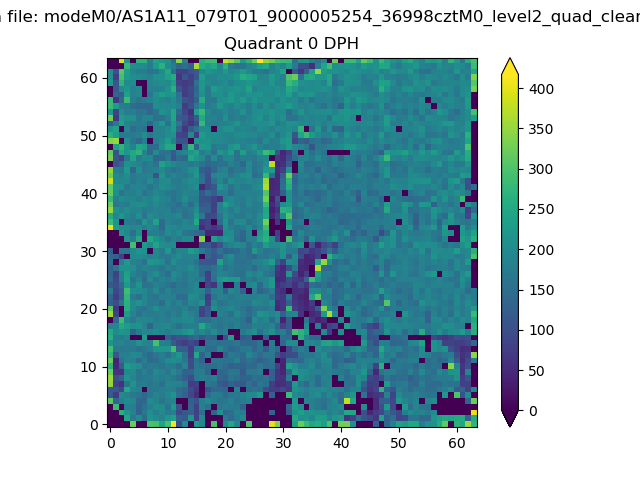 |
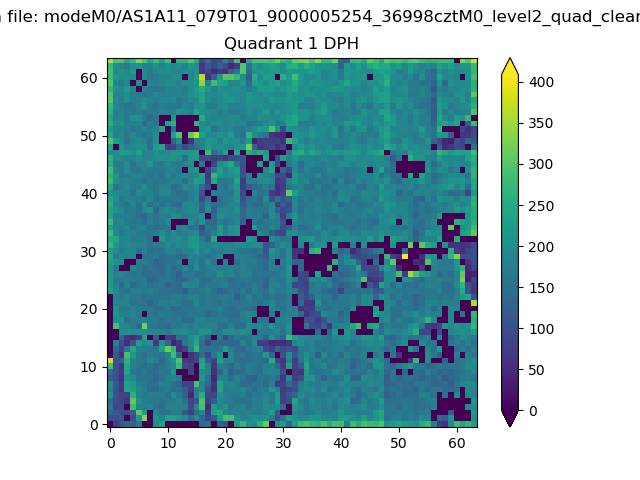 |
Quadrant B |
|---|---|---|---|
| Quadrant D | 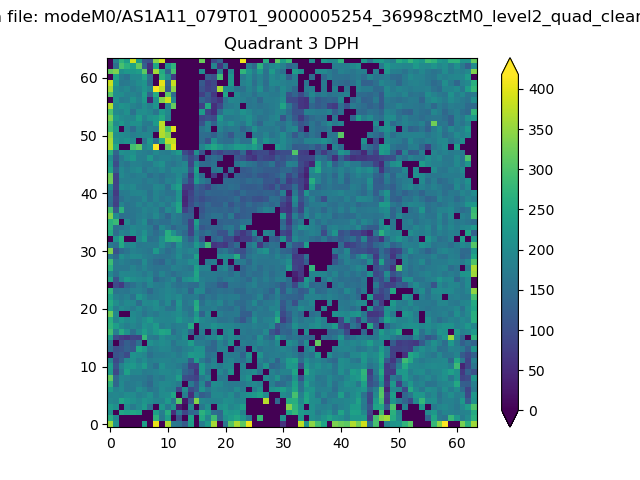 |
 |
Quadrant C |
| Plot type | Count rate plots | Images |
|---|---|---|
| Comparison with Poisson distribution Blue bars denote a histogram of data divided into 1 sec bins. Red curve is a Poisson curve with rate = median count rate of data. |
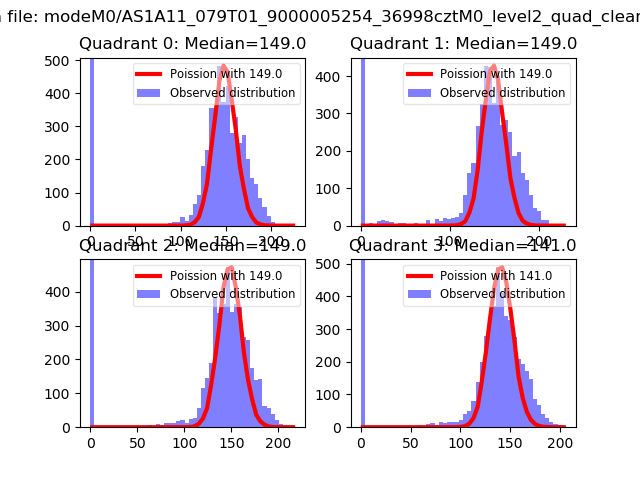 |
 |
| Quadrant-wise count rates Data is divided into 100 sec bins |
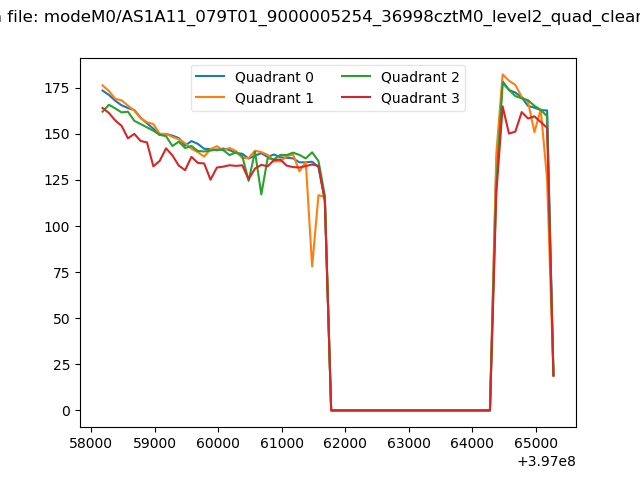 |
|
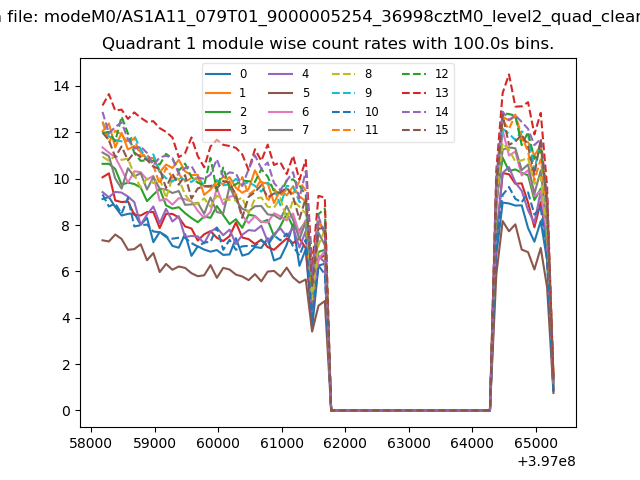
| Module-wise count rates for Quadrant A Data is divided into 100 sec bins |
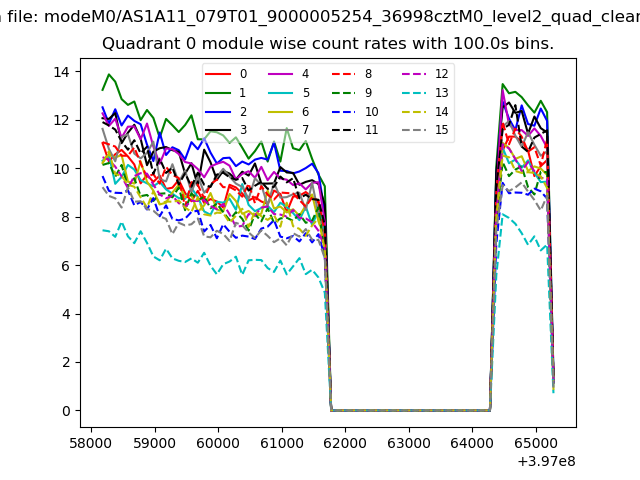 |
 |
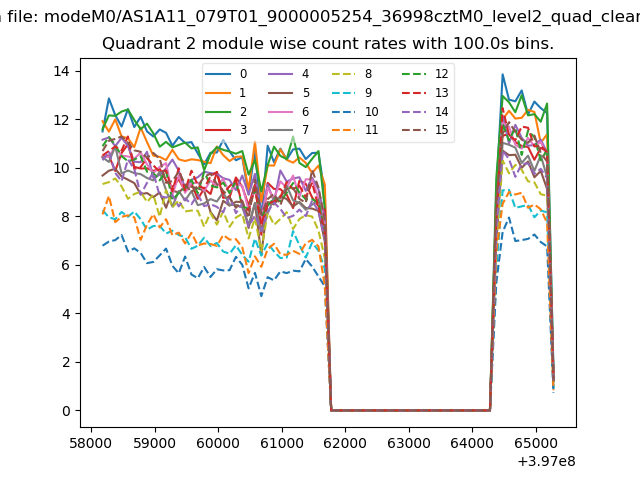
| Module-wise count rates for Quadrant B Data is divided into 100 sec bins |
 |
 |
| Module-wise count rates for Quadrant C Data is divided into 100 sec bins |
 |
 |
| Module-wise count rates for Quadrant D Data is divided into 100 sec bins |
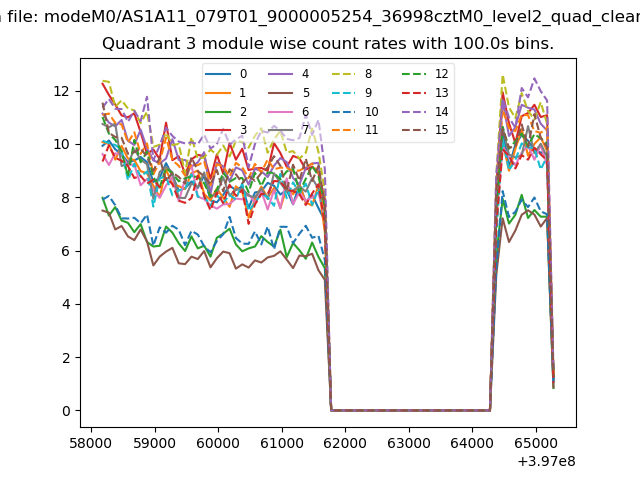 |
 |
| Parameter | Plot |
|---|---|
| CZT HV Monitor | 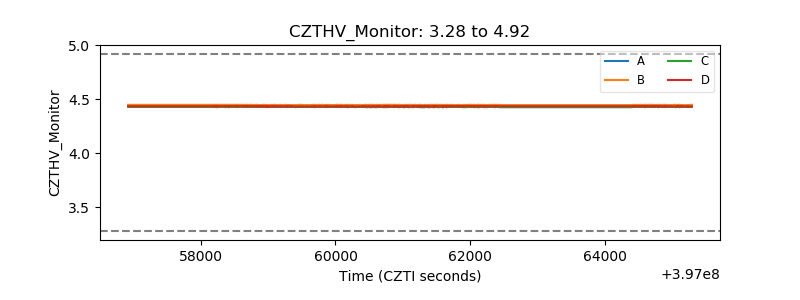 |
| D_VDD | 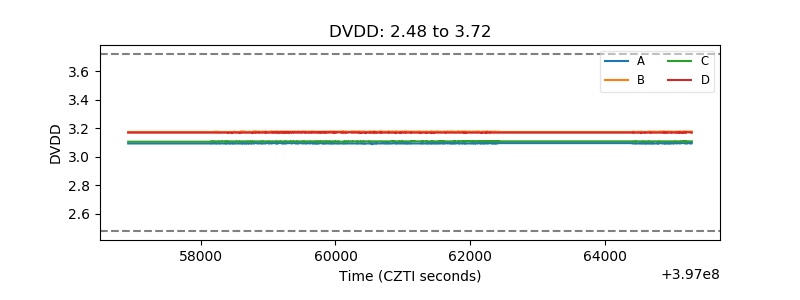 |
| Temperature 1 | 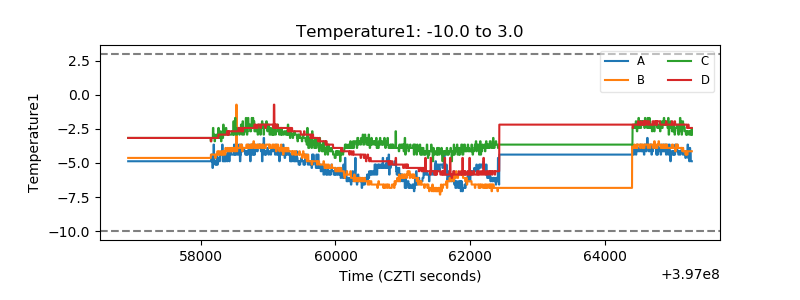 |
| Veto HV Monitor | 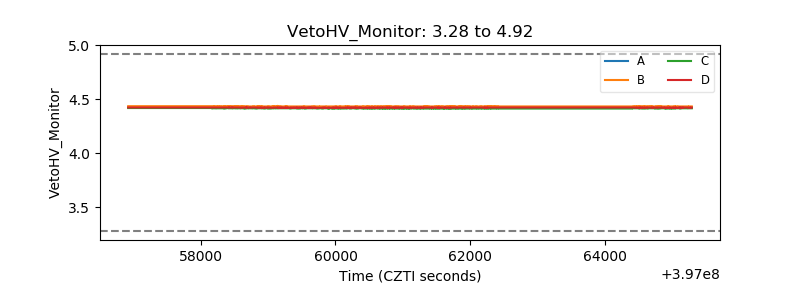 |
| Veto LLD | 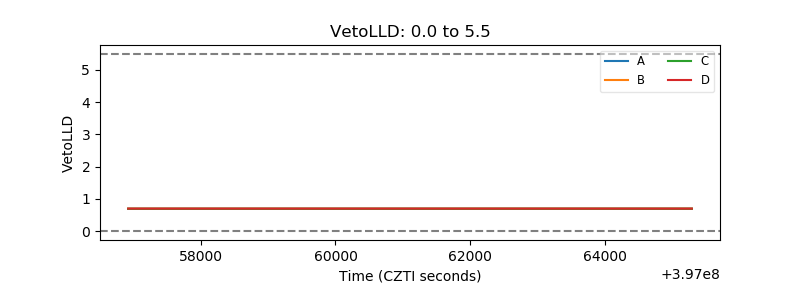 |
| Alpha Counter | 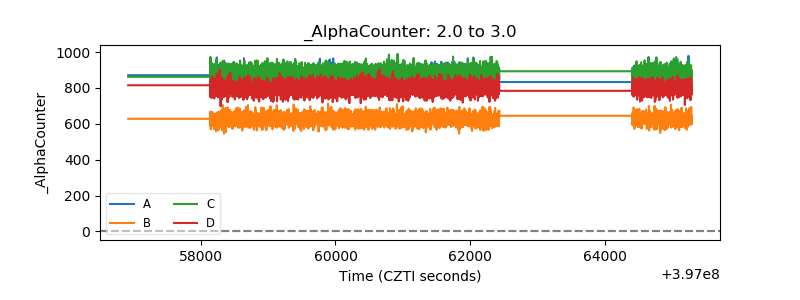 |
| _CPM_Rate | 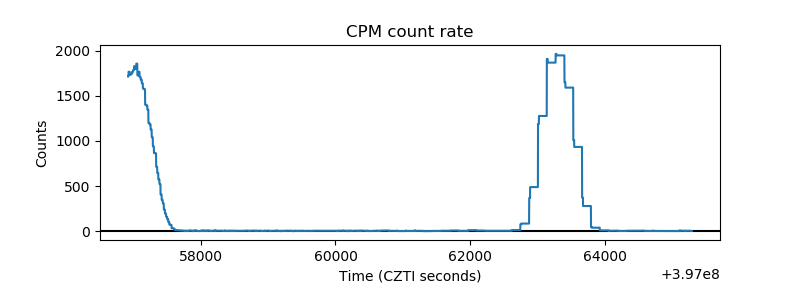 |
| CZT Counter | 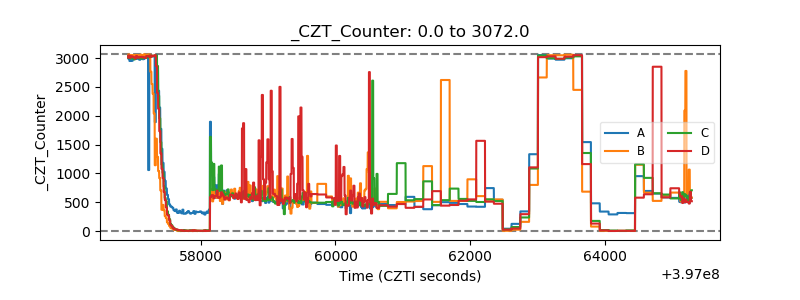 |
| +2.5 Volts monitor | 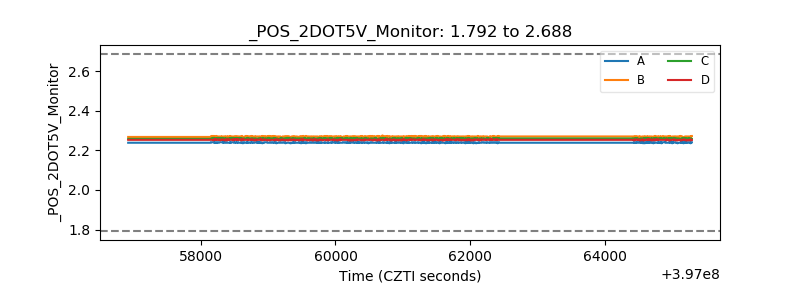 |
| +5 Volts monitor | 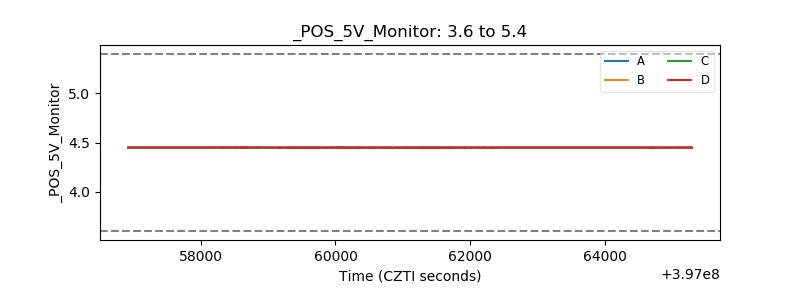 |
| _ROLL_ROT | 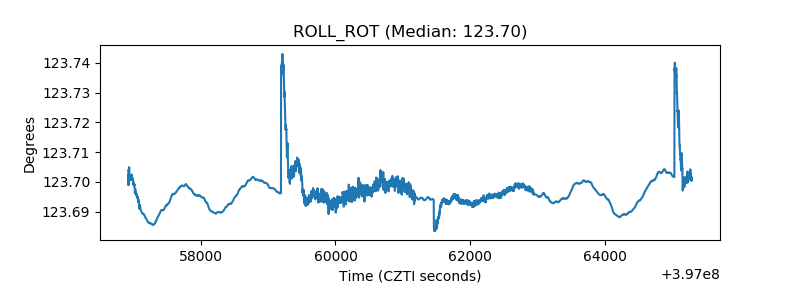 |
| _Roll_DEC | 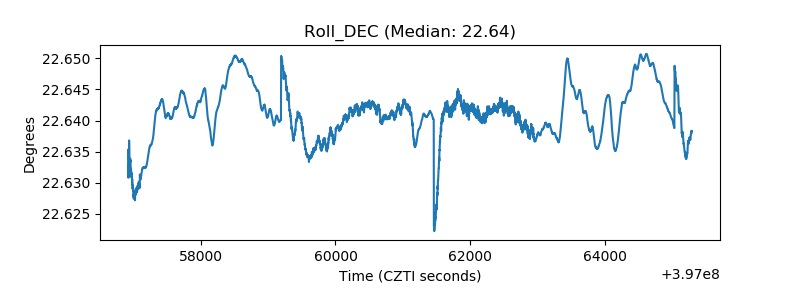 |
| _Roll_RA | 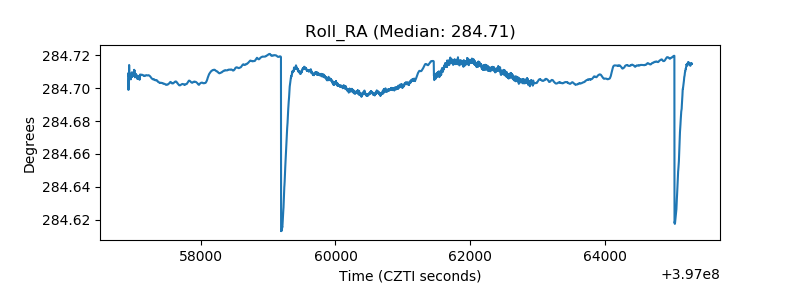 |
| Veto Counter | 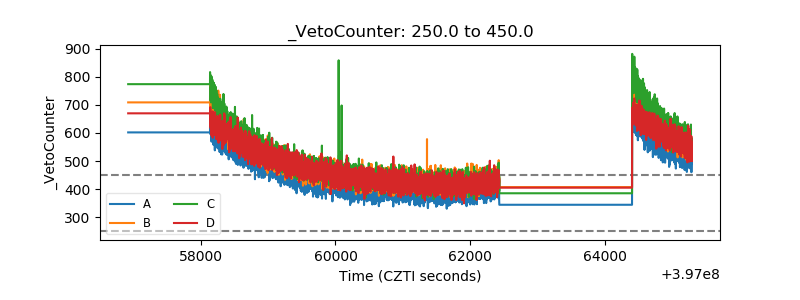 |