| Param | Original file | Final file |
|---|---|---|
| Filename | modeM0/AS1A11_079T01_9000005254_37001cztM0_level2.evt | modeM0/AS1A11_079T01_9000005254_37001cztM0_level2_quad_clean.evt |
| Size (bytes) | 400,098,240 | 67,193,280 |
| Size | 381.6 MB | 64.1 MB |
| Events in quadrant A | 2,458,527 | 432,806 |
| Events in quadrant B | 2,974,995 | 435,502 |
| Events in quadrant C | 2,829,358 | 433,365 |
| Events in quadrant D | 3,519,349 | 387,263 |
| Mode SS | |||
|---|---|---|---|
| Quadrant | BADHDUFLAG | Total packets | Discarded packets |
| A | 0 | 100 | 0 |
| B | 0 | 100 | 0 |
| C | 0 | 100 | 0 |
| D | 0 | 100 | 0 |
| Mode M9 | |||
|---|---|---|---|
| Quadrant | BADHDUFLAG | Total packets | Discarded packets |
| A | 0 | 30 | 0 |
| B | 0 | 30 | 0 |
| C | 0 | 30 | 0 |
| D | 0 | 31 | 0 |
| Mode M0 | |||
|---|---|---|---|
| Quadrant | BADHDUFLAG | Total packets | Discarded packets |
| A | 0 | 10415 | 3 |
| B | 0 | 11888 | 6 |
| C | 0 | 11381 | 2 |
| D | 0 | 13754 | 27 |
| Quadrant | Total seconds | Saturated seconds | Saturation percentage |
|---|---|---|---|
| A | 4927 | 10 | 0.202963% |
| B | 4924 | 89 | 1.807474% |
| C | 4927 | 37 | 0.750964% |
| D | 4923 | 366 | 7.434491% |
Noise dominated data is calculated using 1-second bins in cleaned event files. If a bin has >2000 counts, and if more than 50% of those come from <1% of pixels, then it is considered to be noise-dominated and hence unusable.
| Quadrant | # 1 sec bins | Bins with >0 counts | Bins with >2000 counts | High rate bins dominated by noise | Noise dominated (total time) | Noise dominated (detector-on time) | Marked lightcurve |
|---|---|---|---|---|---|---|---|
| A | 7050 | 4928 | 0 | 0 | 0.00% | 0.00% | 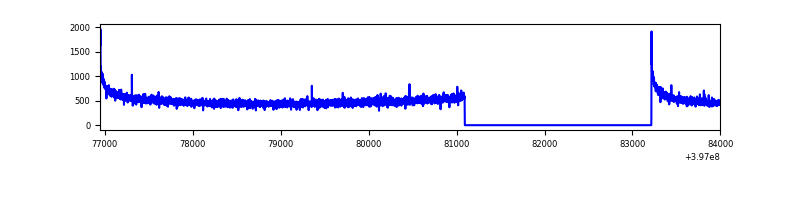 |
| B | 7050 | 4927 | 75 | 75 | 1.06% | 1.52% | 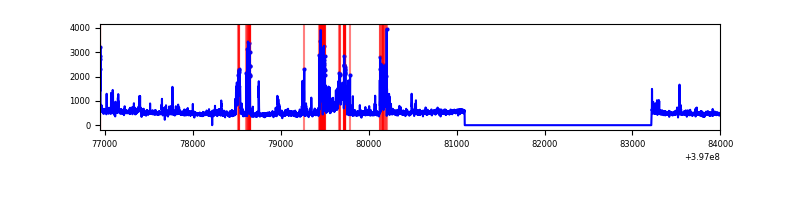 |
| C | 7050 | 4928 | 35 | 35 | 0.50% | 0.71% | 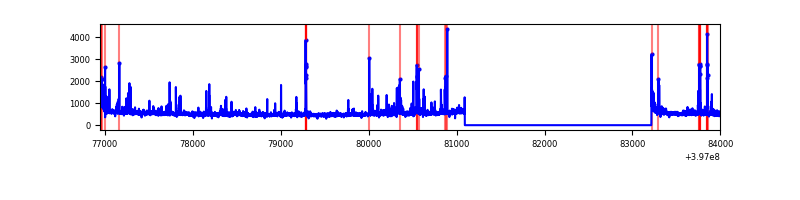 |
| D | 7050 | 4926 | 362 | 362 | 5.13% | 7.35% | 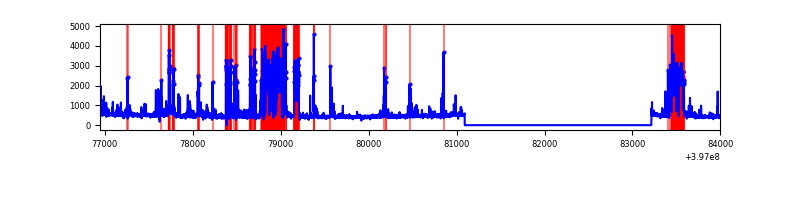 |
Top three noisy pixels from each quadrant. If the there are fewer than three noisy pixels in the level2.evt file, extra rows are filled as -1
| Pixel properties | Quadrant properties | ||||||
|---|---|---|---|---|---|---|---|
| Quadrant | DetID | PixID | Counts | Sigma | Mean | Median | Sigma |
| A | 10 | 83 | 209821 | 1805.52 | 579 | 569 | 115.9 |
| A | 13 | 254 | 6724 | 53.11 | 579 | 569 | 115.9 |
| A | 13 | 6 | 6264 | 49.14 | 579 | 569 | 115.9 |
| B | 5 | 200 | 366405 | 3359.73 | 572 | 556 | 108.9 |
| B | 5 | 184 | 109556 | 1000.99 | 572 | 556 | 108.9 |
| B | 0 | 213 | 75567 | 688.85 | 572 | 556 | 108.9 |
| C | 15 | 214 | 212690 | 1606.85 | 569 | 576 | 132.0 |
| C | 14 | 254 | 115468 | 870.35 | 569 | 576 | 132.0 |
| C | 0 | 207 | 106613 | 803.27 | 569 | 576 | 132.0 |
| D | 2 | 153 | 580740 | 4378.14 | 546 | 532 | 132.5 |
| D | 12 | 17 | 519873 | 3918.85 | 546 | 532 | 132.5 |
| D | 1 | 52 | 162279 | 1220.51 | 546 | 532 | 132.5 |
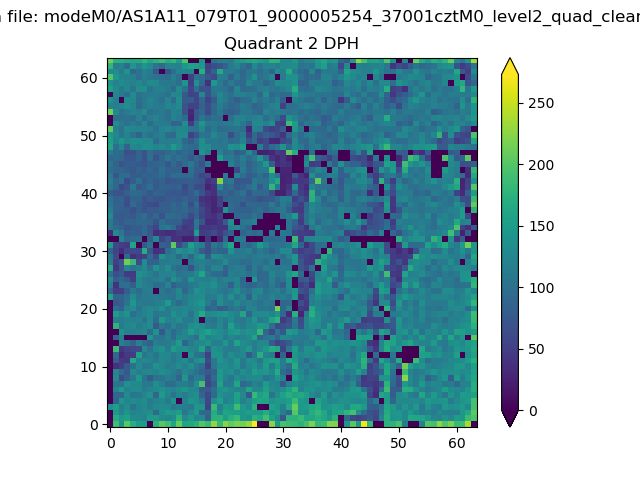
Histogram calculated using DETX and DETY for each event in the final _common_clean file
| Quadrant A | 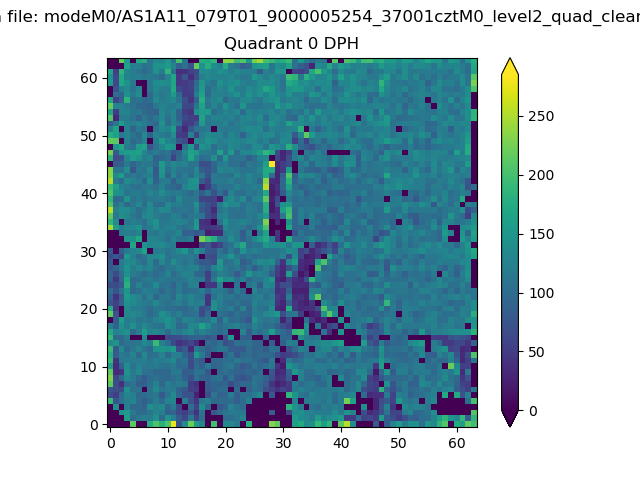 |
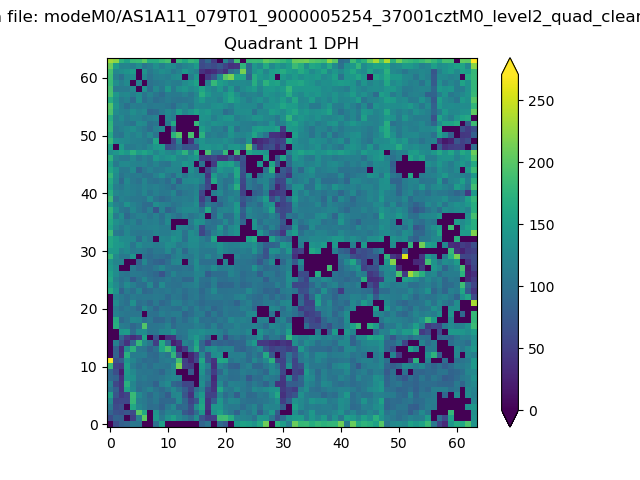 |
Quadrant B |
|---|---|---|---|
| Quadrant D | 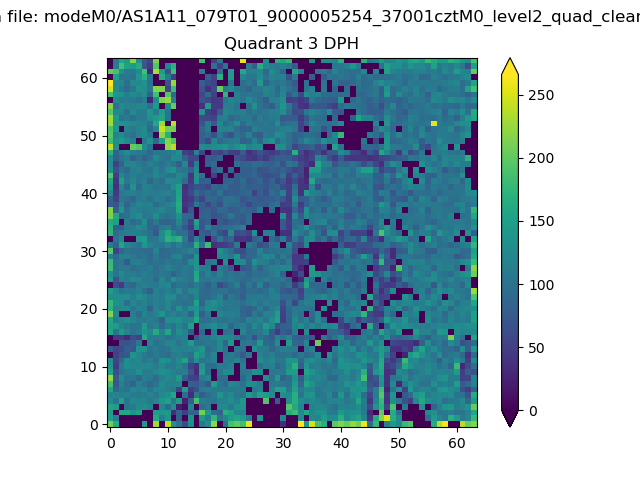 |
 |
Quadrant C |
| Plot type | Count rate plots | Images |
|---|---|---|
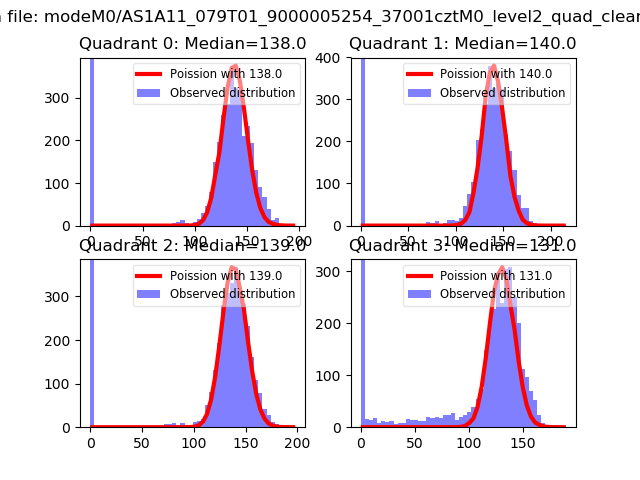
| Comparison with Poisson distribution Blue bars denote a histogram of data divided into 1 sec bins. Red curve is a Poisson curve with rate = median count rate of data. |
 |
 |
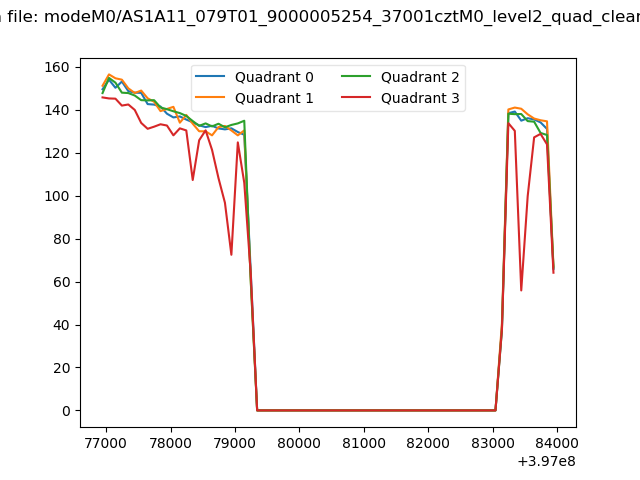
| Quadrant-wise count rates Data is divided into 100 sec bins |
 |
|
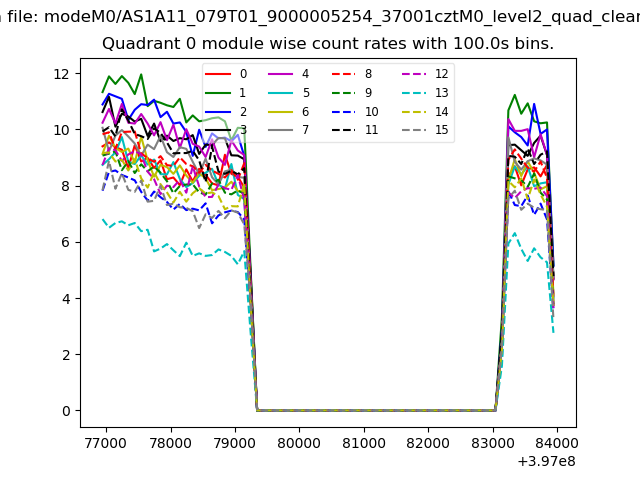
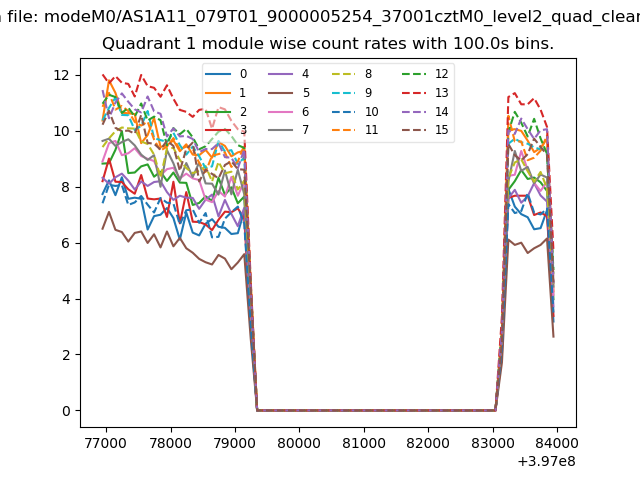
| Module-wise count rates for Quadrant A Data is divided into 100 sec bins |
 |
 |
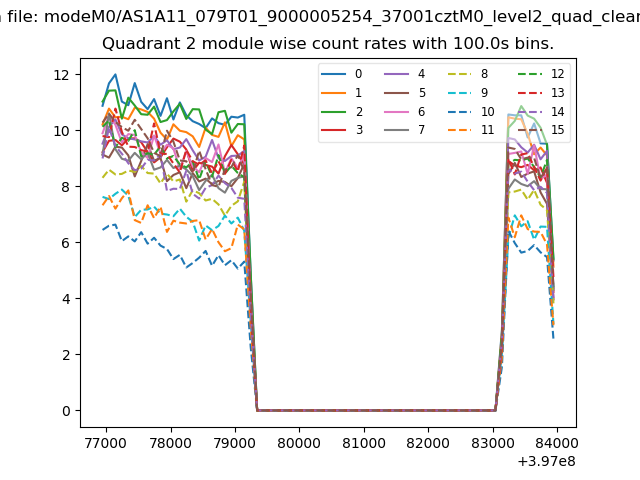
| Module-wise count rates for Quadrant B Data is divided into 100 sec bins |
 |
 |
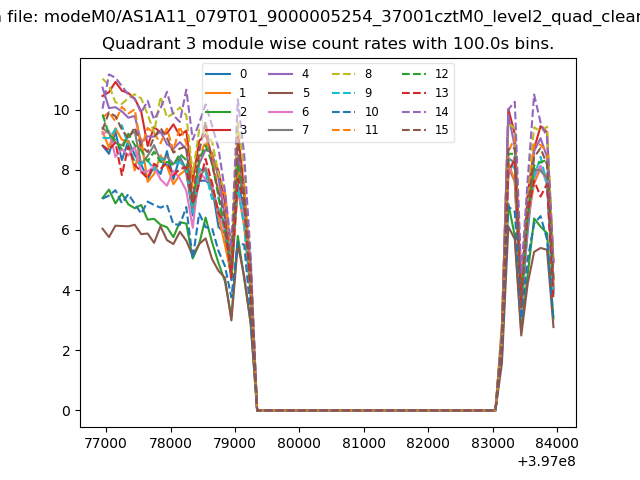
| Module-wise count rates for Quadrant C Data is divided into 100 sec bins |
 |
 |
| Module-wise count rates for Quadrant D Data is divided into 100 sec bins |
 |
 |
| Parameter | Plot |
|---|---|
| CZT HV Monitor | 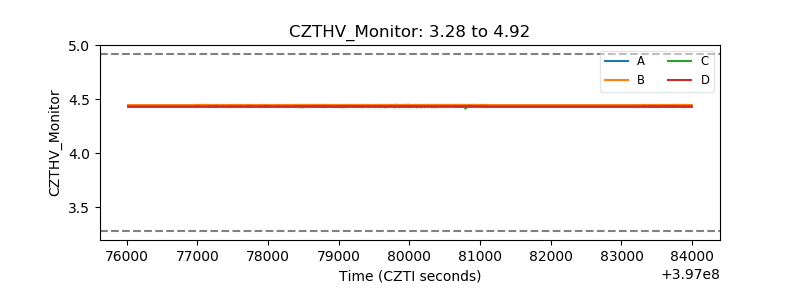 |
| D_VDD | 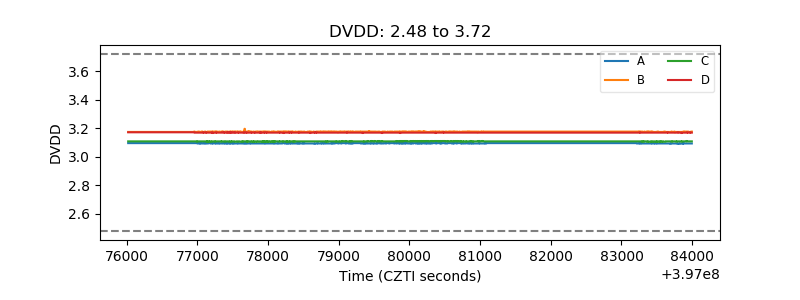 |
| Temperature 1 | 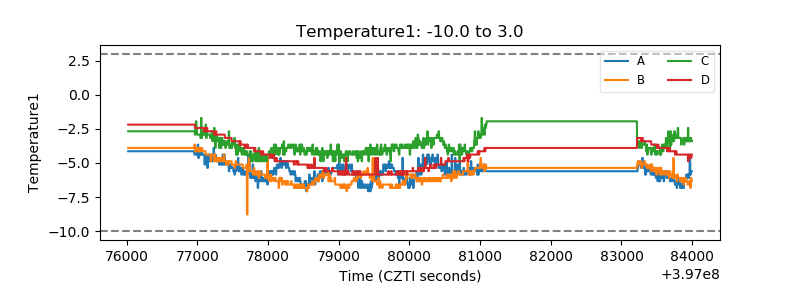 |
| Veto HV Monitor | 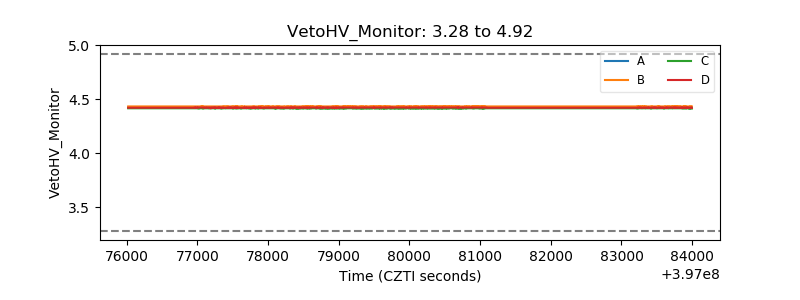 |
| Veto LLD | 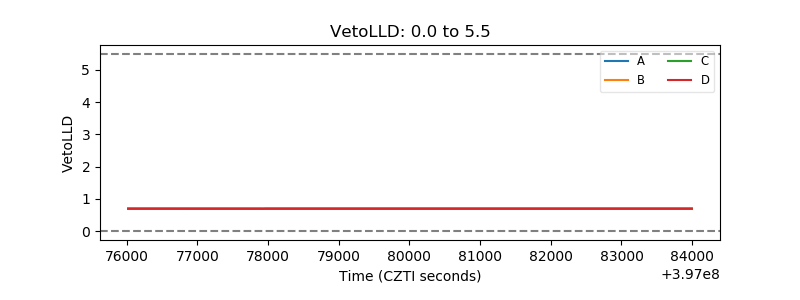 |
| Alpha Counter | 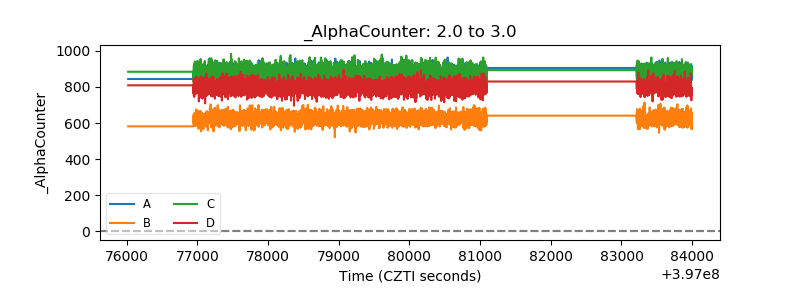 |
| _CPM_Rate | 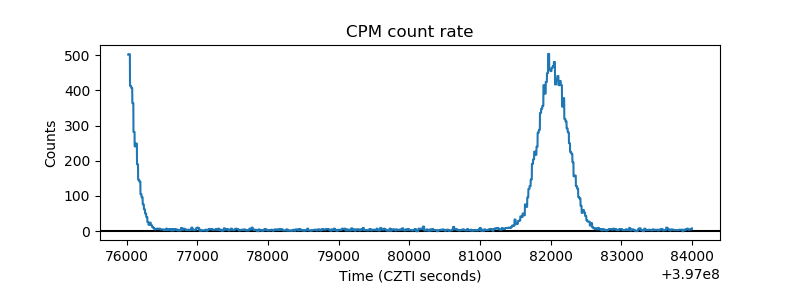 |
| CZT Counter | 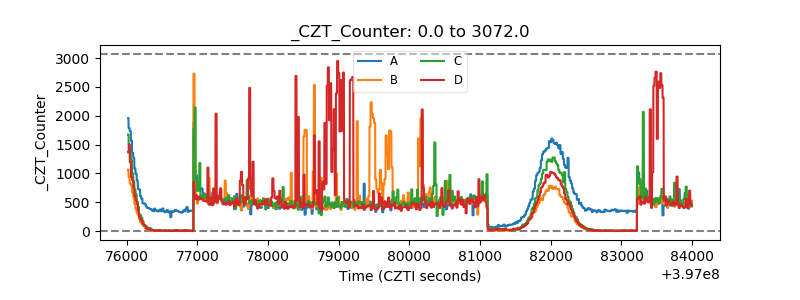 |
| +2.5 Volts monitor |  |
| +5 Volts monitor | 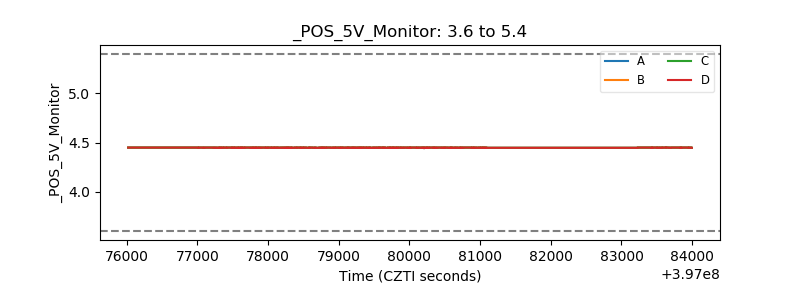 |
| _ROLL_ROT |  |
| _Roll_DEC | 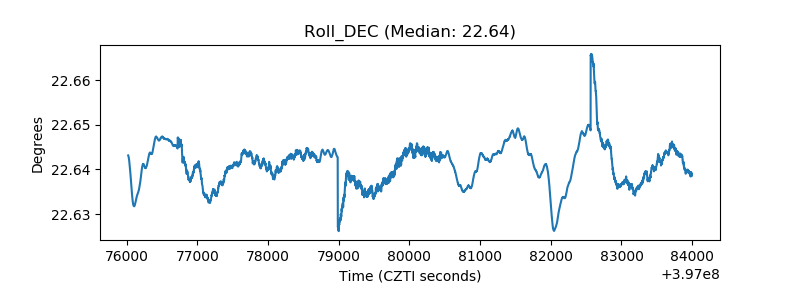 |
| _Roll_RA | 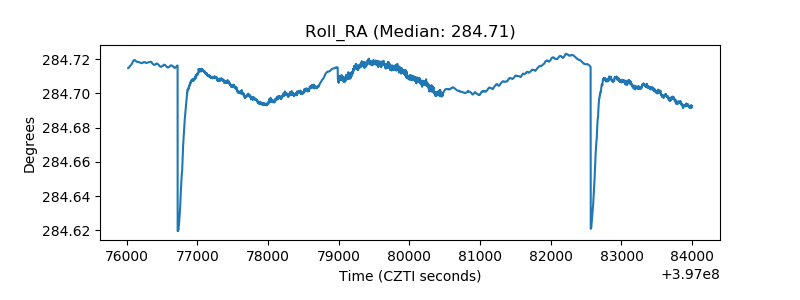 |
| Veto Counter |  |