| Param | Original file | Final file |
|---|---|---|
| Filename | modeM0/AS1A11_079T01_9000005254_37002cztM0_level2.evt | modeM0/AS1A11_079T01_9000005254_37002cztM0_level2_quad_clean.evt |
| Size (bytes) | 359,645,760 | 57,643,200 |
| Size | 343.0 MB | 55.0 MB |
| Events in quadrant A | 2,446,160 | 352,311 |
| Events in quadrant B | 2,738,918 | 356,193 |
| Events in quadrant C | 2,698,739 | 354,400 |
| Events in quadrant D | 2,667,412 | 331,597 |
| Mode SS | |||
|---|---|---|---|
| Quadrant | BADHDUFLAG | Total packets | Discarded packets |
| A | 0 | 104 | 0 |
| B | 0 | 104 | 0 |
| C | 0 | 104 | 0 |
| D | 0 | 104 | 0 |
| Mode M9 | |||
|---|---|---|---|
| Quadrant | BADHDUFLAG | Total packets | Discarded packets |
| A | 0 | 31 | 0 |
| B | 0 | 31 | 0 |
| C | 0 | 31 | 0 |
| D | 0 | 32 | 0 |
| Mode M0 | |||
|---|---|---|---|
| Quadrant | BADHDUFLAG | Total packets | Discarded packets |
| A | 0 | 10441 | 3 |
| B | 0 | 11344 | 2 |
| C | 0 | 11063 | 2 |
| D | 0 | 11488 | 2 |
| Quadrant | Total seconds | Saturated seconds | Saturation percentage |
|---|---|---|---|
| A | 4994 | 9 | 0.180216% |
| B | 4994 | 49 | 0.981177% |
| C | 4994 | 30 | 0.600721% |
| D | 4994 | 138 | 2.763316% |
Noise dominated data is calculated using 1-second bins in cleaned event files. If a bin has >2000 counts, and if more than 50% of those come from <1% of pixels, then it is considered to be noise-dominated and hence unusable.
| Quadrant | # 1 sec bins | Bins with >0 counts | Bins with >2000 counts | High rate bins dominated by noise | Noise dominated (total time) | Noise dominated (detector-on time) | Marked lightcurve |
|---|---|---|---|---|---|---|---|
| A | 6936 | 4995 | 0 | 0 | 0.00% | 0.00% |  |
| B | 6936 | 4995 | 39 | 39 | 0.56% | 0.78% | 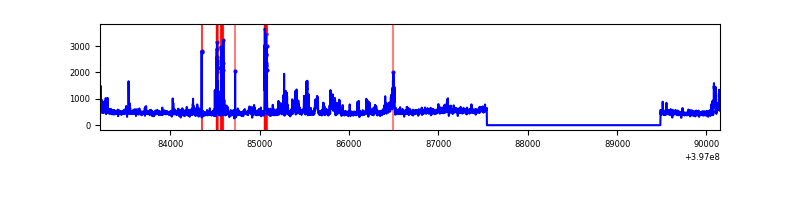 |
| C | 6936 | 4995 | 28 | 28 | 0.40% | 0.56% | 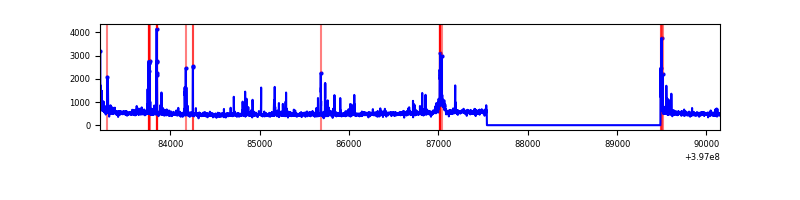 |
| D | 6936 | 4995 | 128 | 128 | 1.85% | 2.56% | 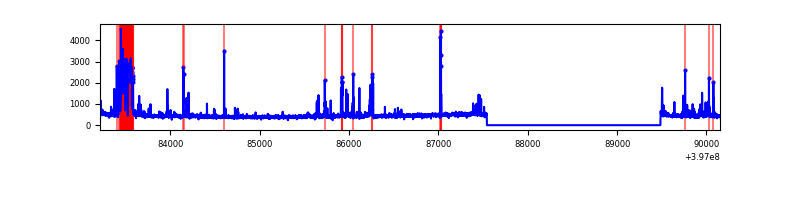 |
Top three noisy pixels from each quadrant. If the there are fewer than three noisy pixels in the level2.evt file, extra rows are filled as -1
| Pixel properties | Quadrant properties | ||||||
|---|---|---|---|---|---|---|---|
| Quadrant | DetID | PixID | Counts | Sigma | Mean | Median | Sigma |
| A | 10 | 83 | 210587 | 1830.62 | 568 | 557 | 114.7 |
| A | 15 | 223 | 17918 | 151.32 | 568 | 557 | 114.7 |
| A | 15 | 222 | 8852 | 72.3 | 568 | 557 | 114.7 |
| B | 5 | 184 | 232960 | 2142.75 | 564 | 550 | 108.5 |
| B | 5 | 172 | 126606 | 1162.2 | 564 | 550 | 108.5 |
| B | 0 | 221 | 48003 | 437.5 | 564 | 550 | 108.5 |
| C | 15 | 214 | 213740 | 1630.73 | 556 | 561 | 130.7 |
| C | 0 | 207 | 86405 | 656.67 | 556 | 561 | 130.7 |
| C | 0 | 10 | 80241 | 609.52 | 556 | 561 | 130.7 |
| D | 2 | 153 | 347245 | 2593.7 | 544 | 530 | 133.7 |
| D | 1 | 52 | 66714 | 495.11 | 544 | 530 | 133.7 |
| D | 2 | 250 | 64138 | 475.84 | 544 | 530 | 133.7 |
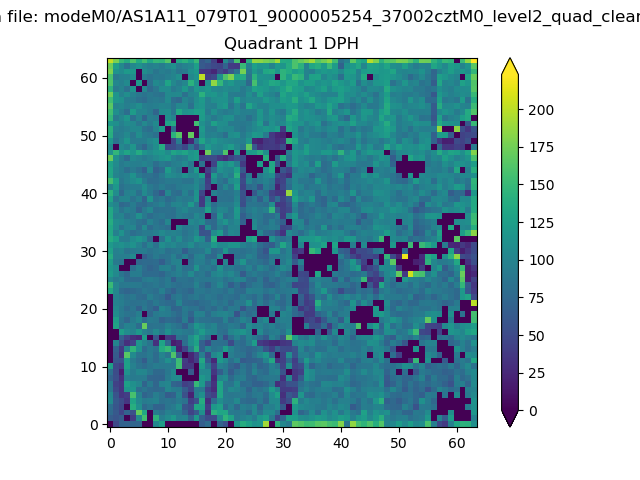
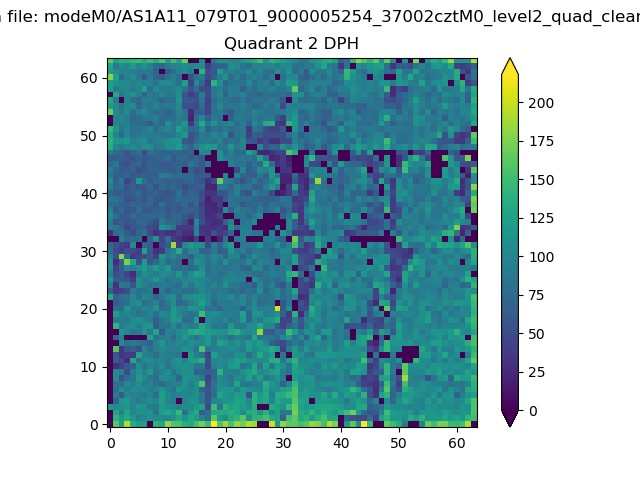
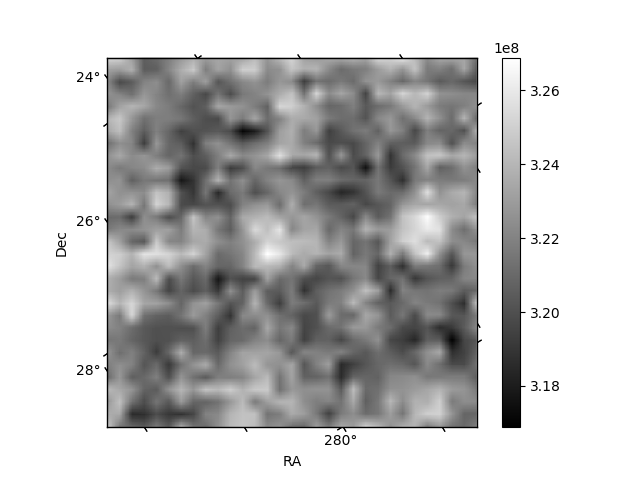
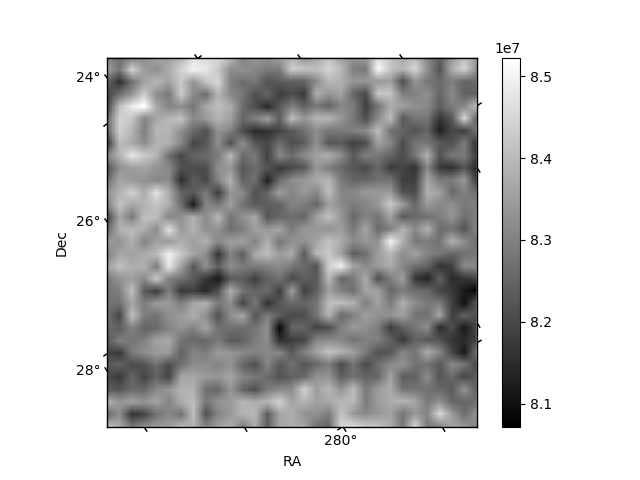
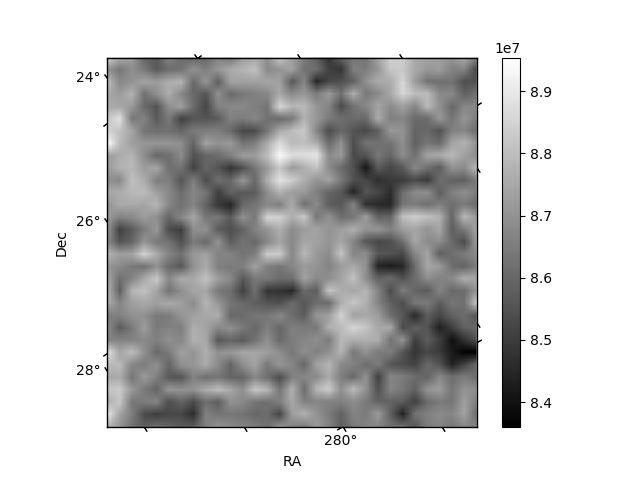
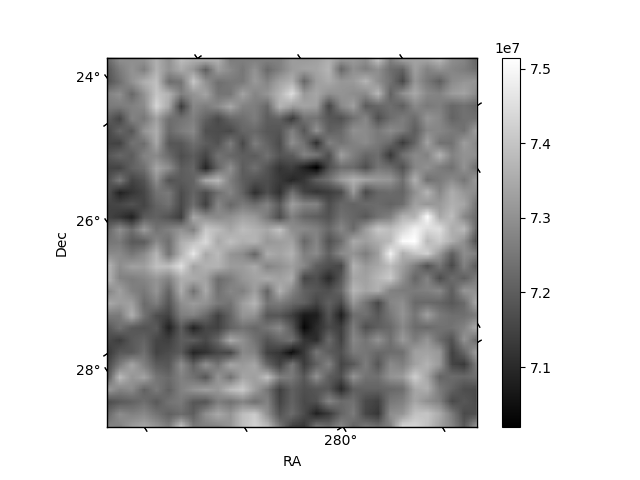
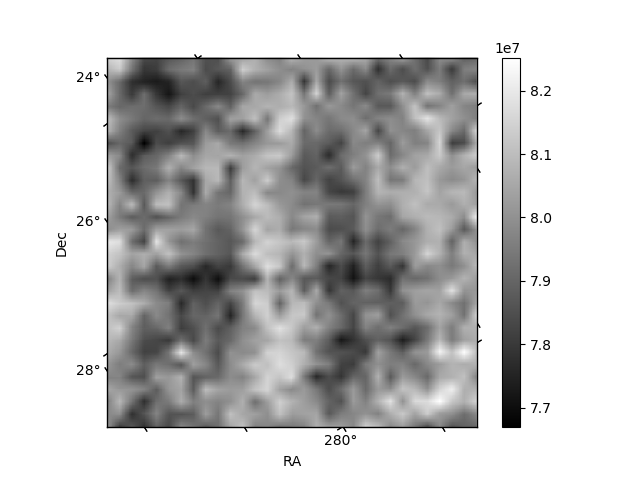
Histogram calculated using DETX and DETY for each event in the final _common_clean file
| Quadrant A | 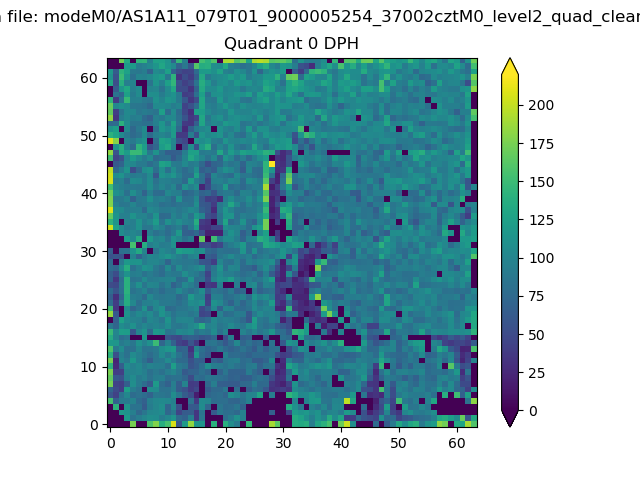 |
 |
Quadrant B |
|---|---|---|---|
| Quadrant D | 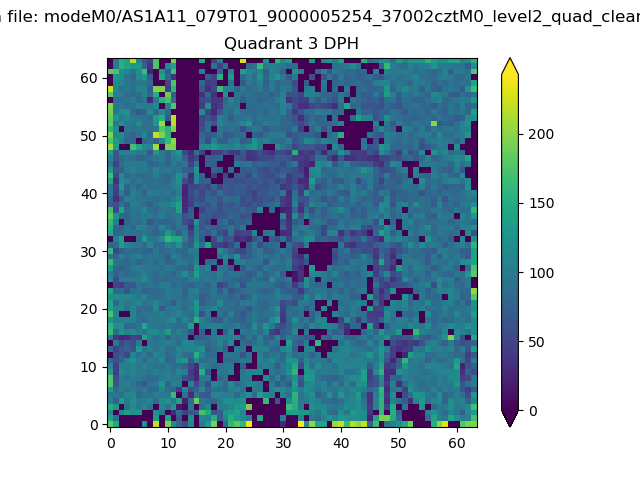 |
 |
Quadrant C |
| Plot type | Count rate plots | Images |
|---|---|---|
| Comparison with Poisson distribution Blue bars denote a histogram of data divided into 1 sec bins. Red curve is a Poisson curve with rate = median count rate of data. |
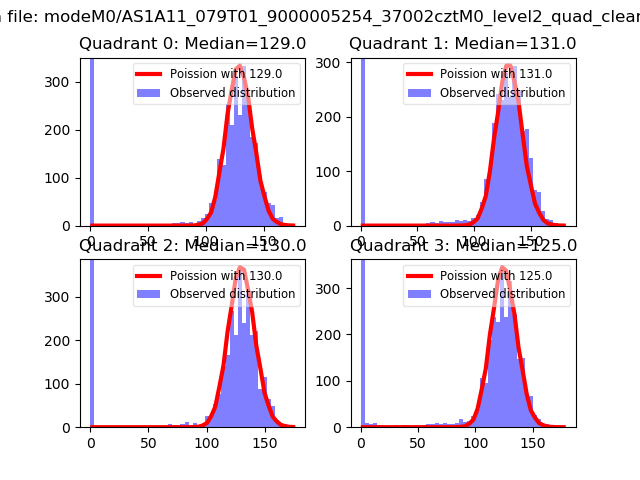 |
 |
| Quadrant-wise count rates Data is divided into 100 sec bins |
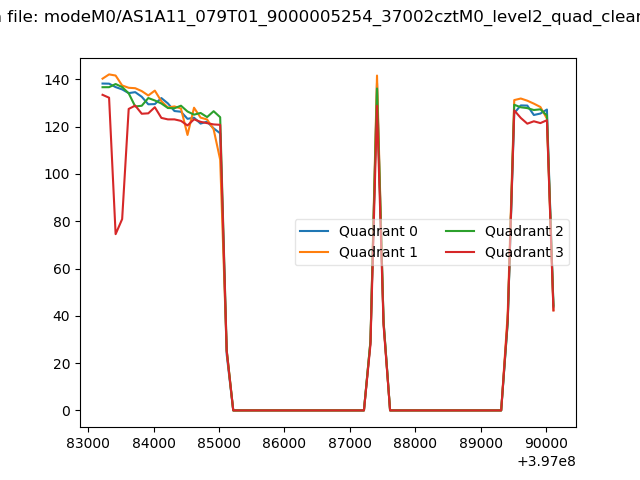 |
|
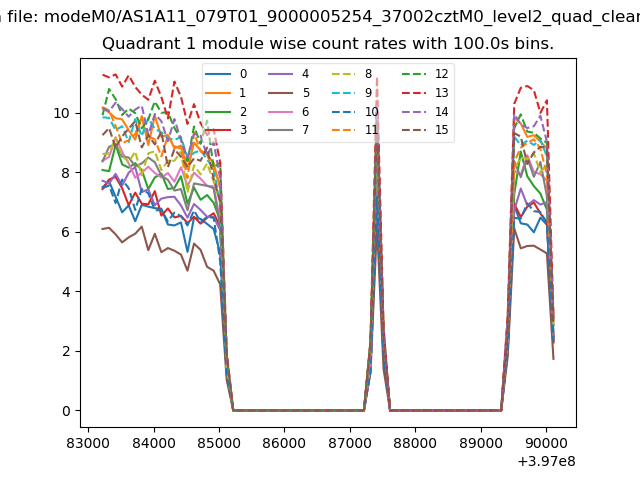
| Module-wise count rates for Quadrant A Data is divided into 100 sec bins |
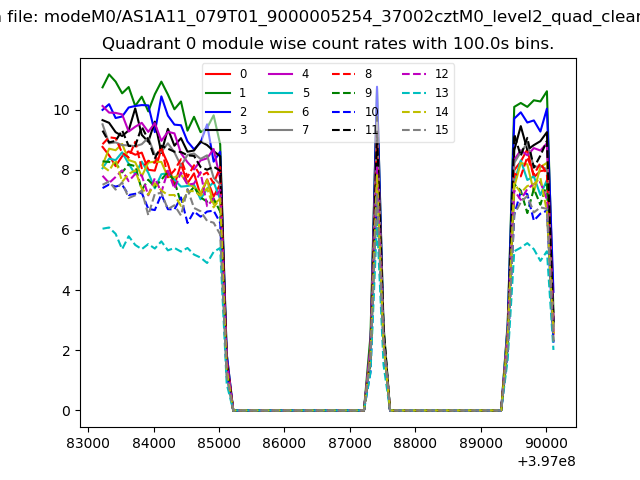 |
 |
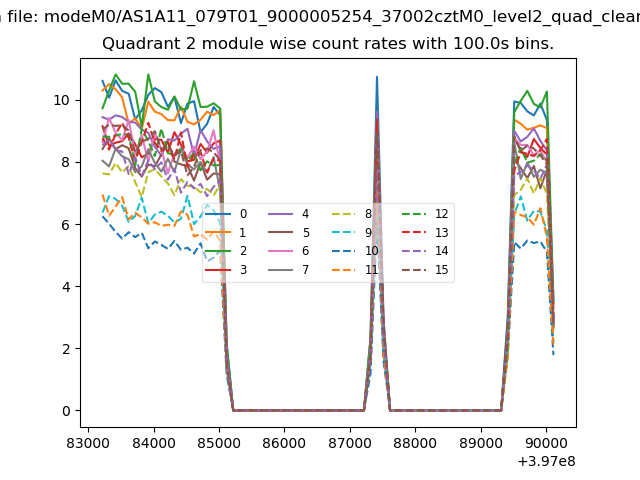
| Module-wise count rates for Quadrant B Data is divided into 100 sec bins |
 |
 |
| Module-wise count rates for Quadrant C Data is divided into 100 sec bins |
 |
 |
| Module-wise count rates for Quadrant D Data is divided into 100 sec bins |
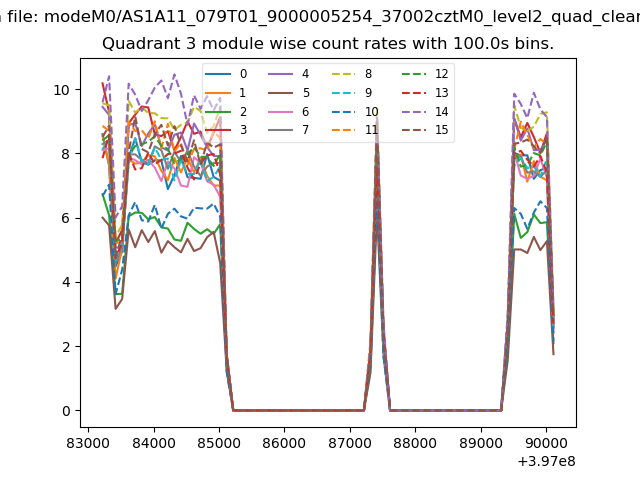 |
 |
| Parameter | Plot |
|---|---|
| CZT HV Monitor | 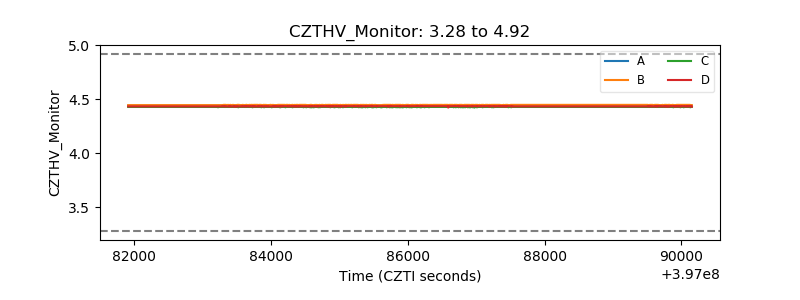 |
| D_VDD | 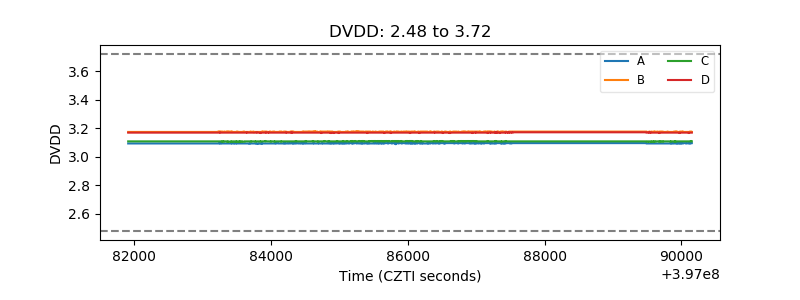 |
| Temperature 1 | 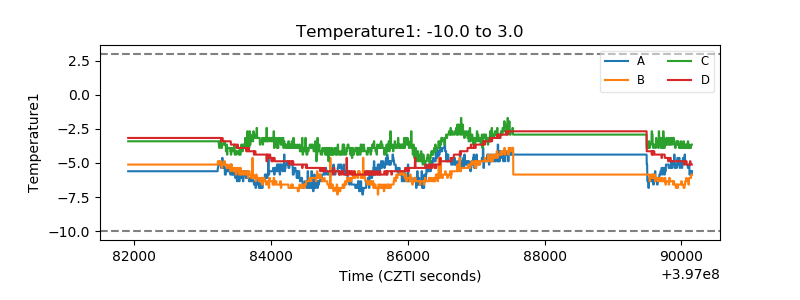 |
| Veto HV Monitor | 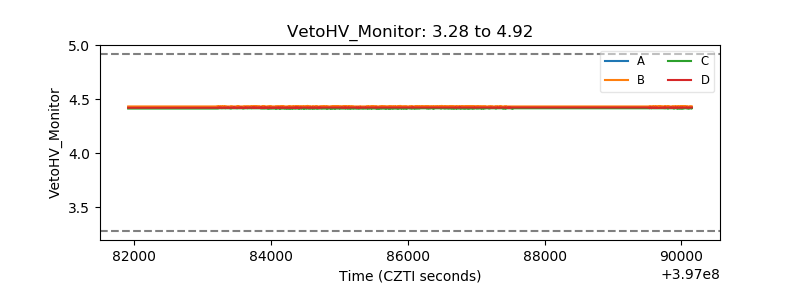 |
| Veto LLD | 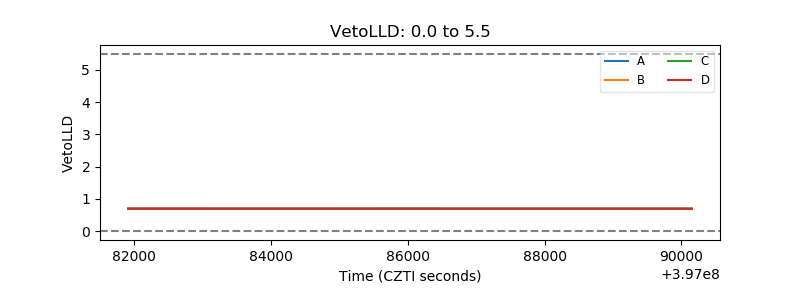 |
| Alpha Counter | 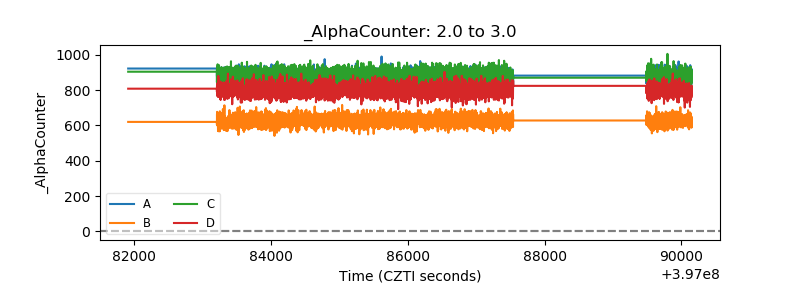 |
| _CPM_Rate | 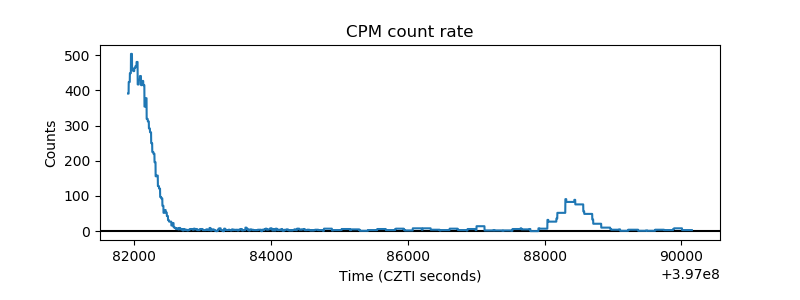 |
| CZT Counter | 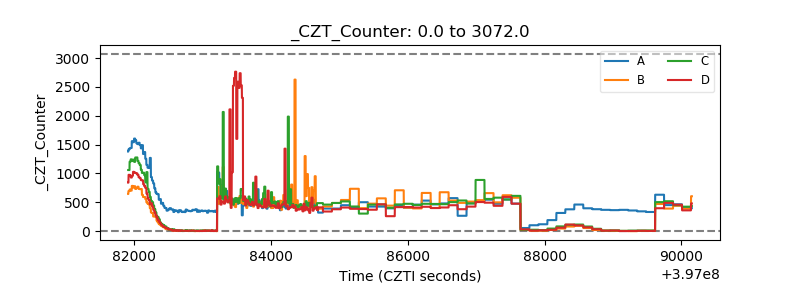 |
| +2.5 Volts monitor | 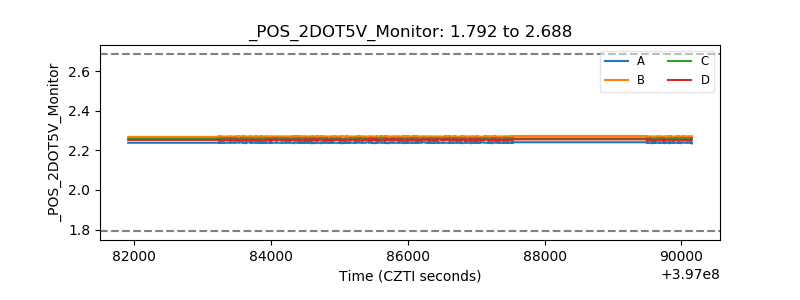 |
| +5 Volts monitor | 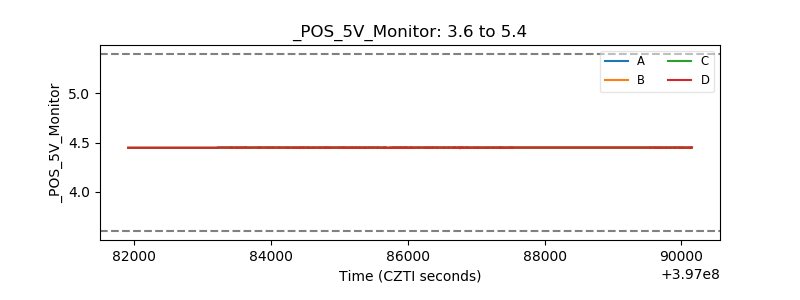 |
| _ROLL_ROT | 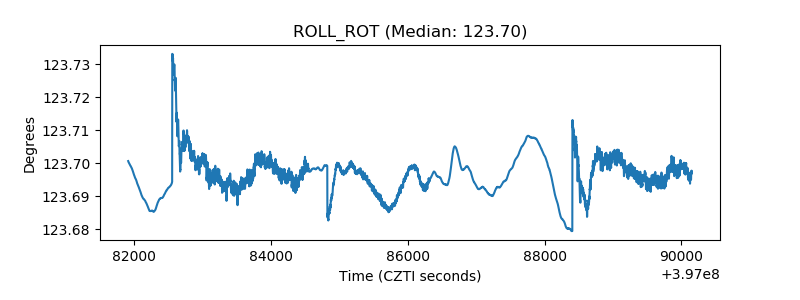 |
| _Roll_DEC | 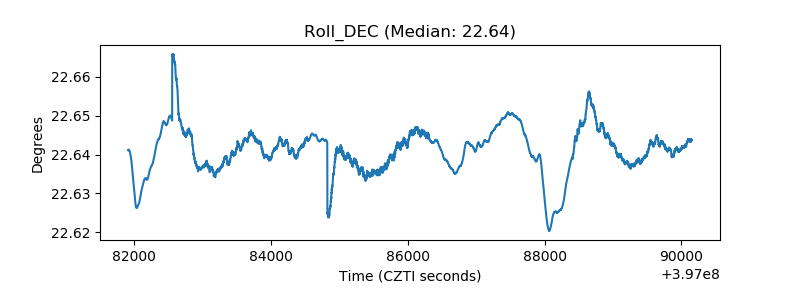 |
| _Roll_RA | 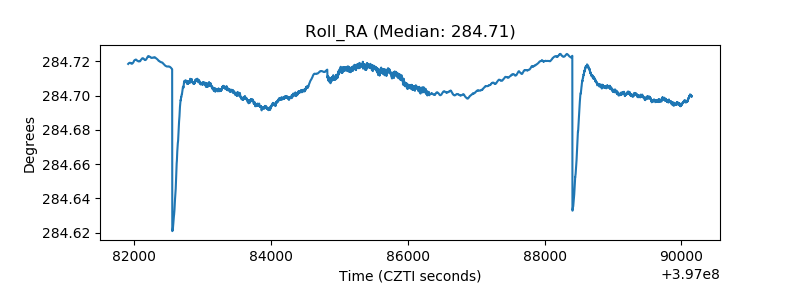 |
| Veto Counter | 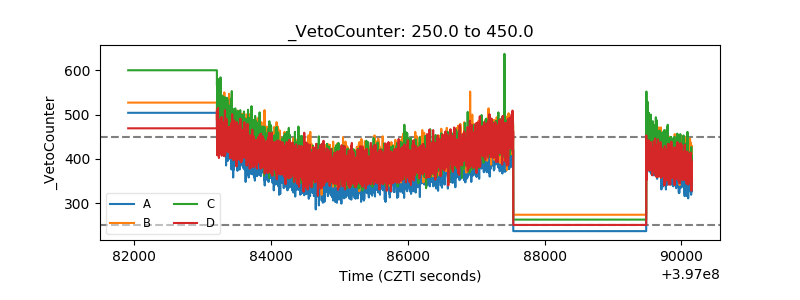 |