| Param | Original file | Final file |
|---|---|---|
| Filename | modeM0/AS1A11_079T01_9000005254_37003cztM0_level2.evt | modeM0/AS1A11_079T01_9000005254_37003cztM0_level2_quad_clean.evt |
| Size (bytes) | 423,308,160 | 64,221,120 |
| Size | 403.7 MB | 61.2 MB |
| Events in quadrant A | 2,711,679 | 395,820 |
| Events in quadrant B | 4,317,117 | 386,350 |
| Events in quadrant C | 2,792,391 | 399,437 |
| Events in quadrant D | 2,631,352 | 384,417 |
| Mode SS | |||
|---|---|---|---|
| Quadrant | BADHDUFLAG | Total packets | Discarded packets |
| A | 0 | 110 | 0 |
| B | 0 | 110 | 0 |
| C | 0 | 110 | 0 |
| D | 0 | 110 | 0 |
| Mode M9 | |||
|---|---|---|---|
| Quadrant | BADHDUFLAG | Total packets | Discarded packets |
| A | 0 | 33 | 0 |
| B | 0 | 33 | 0 |
| C | 0 | 33 | 0 |
| D | 0 | 34 | 0 |
| Mode M0 | |||
|---|---|---|---|
| Quadrant | BADHDUFLAG | Total packets | Discarded packets |
| A | 0 | 11610 | 3 |
| B | 0 | 16512 | 2 |
| C | 0 | 11655 | 2 |
| D | 0 | 11753 | 2 |
| Quadrant | Total seconds | Saturated seconds | Saturation percentage |
|---|---|---|---|
| A | 5406 | 22 | 0.406955% |
| B | 5406 | 408 | 7.547170% |
| C | 5406 | 22 | 0.406955% |
| D | 5406 | 42 | 0.776915% |
Noise dominated data is calculated using 1-second bins in cleaned event files. If a bin has >2000 counts, and if more than 50% of those come from <1% of pixels, then it is considered to be noise-dominated and hence unusable.
| Quadrant | # 1 sec bins | Bins with >0 counts | Bins with >2000 counts | High rate bins dominated by noise | Noise dominated (total time) | Noise dominated (detector-on time) | Marked lightcurve |
|---|---|---|---|---|---|---|---|
| A | 6989 | 5407 | 14 | 14 | 0.20% | 0.26% | 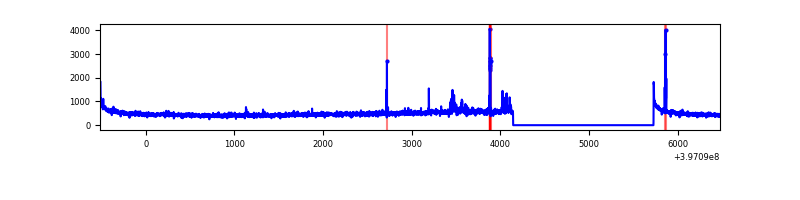 |
| B | 6989 | 5407 | 290 | 290 | 4.15% | 5.36% | 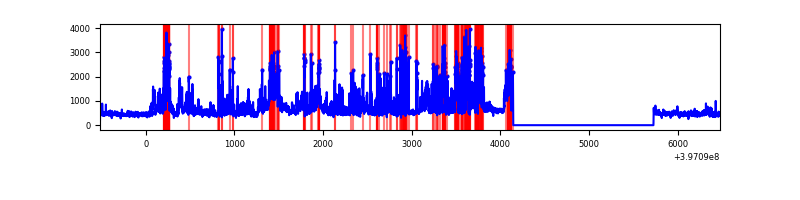 |
| C | 6989 | 5407 | 20 | 20 | 0.29% | 0.37% | 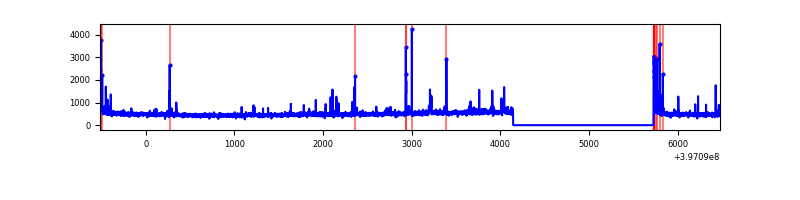 |
| D | 6989 | 5407 | 39 | 39 | 0.56% | 0.72% | 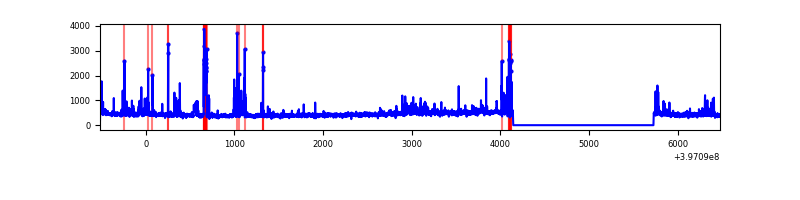 |
Top three noisy pixels from each quadrant. If the there are fewer than three noisy pixels in the level2.evt file, extra rows are filled as -1
| Pixel properties | Quadrant properties | ||||||
|---|---|---|---|---|---|---|---|
| Quadrant | DetID | PixID | Counts | Sigma | Mean | Median | Sigma |
| A | 10 | 83 | 219851 | 1758.28 | 610 | 599 | 124.7 |
| A | 9 | 143 | 65858 | 523.34 | 610 | 599 | 124.7 |
| A | 7 | 16 | 50934 | 403.66 | 610 | 599 | 124.7 |
| B | 5 | 184 | 1794770 | 15699.59 | 591 | 576 | 114.3 |
| B | 0 | 213 | 47100 | 407.1 | 591 | 576 | 114.3 |
| B | 5 | 172 | 44321 | 382.78 | 591 | 576 | 114.3 |
| C | 15 | 214 | 232441 | 1656.57 | 597 | 602 | 140.0 |
| C | 0 | 10 | 99612 | 707.46 | 597 | 602 | 140.0 |
| C | 14 | 254 | 47885 | 337.85 | 597 | 602 | 140.0 |
| D | 1 | 52 | 113885 | 780.27 | 592 | 575 | 145.2 |
| D | 2 | 153 | 101587 | 695.59 | 592 | 575 | 145.2 |
| D | 2 | 250 | 61245 | 417.78 | 592 | 575 | 145.2 |
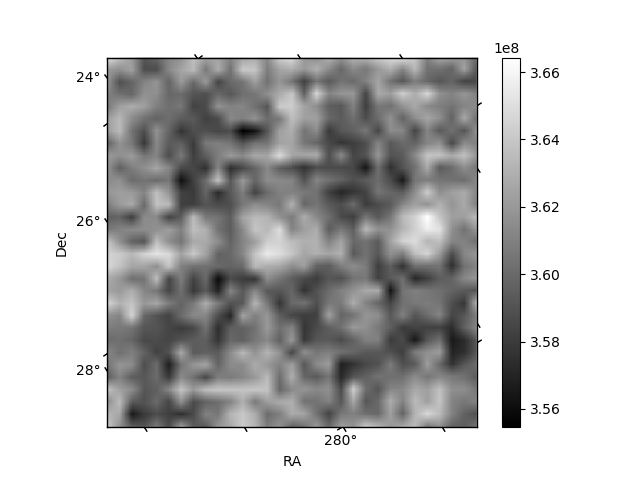
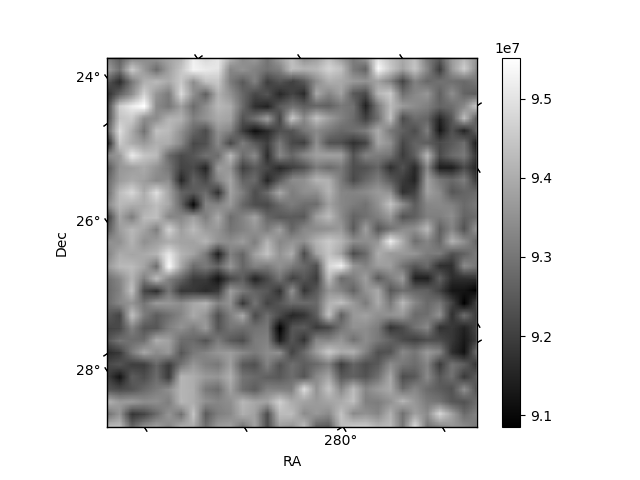
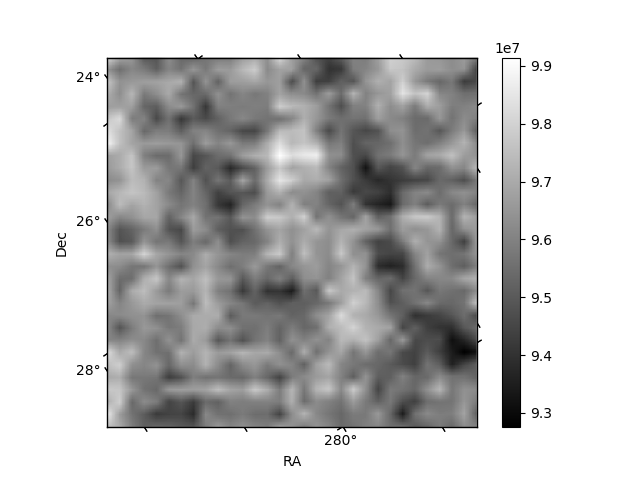
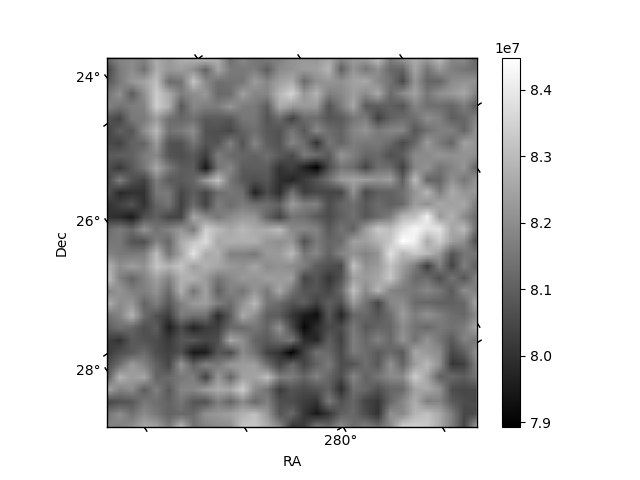
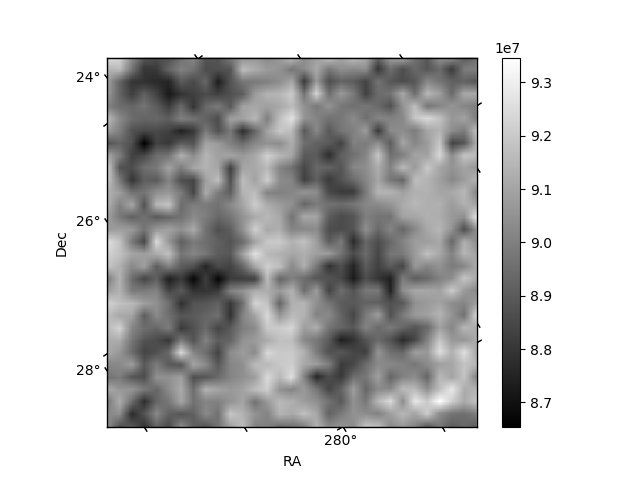
Histogram calculated using DETX and DETY for each event in the final _common_clean file
| Quadrant A | 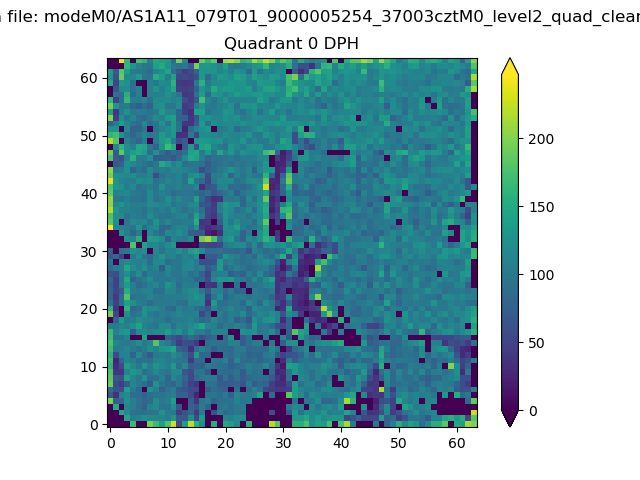 |
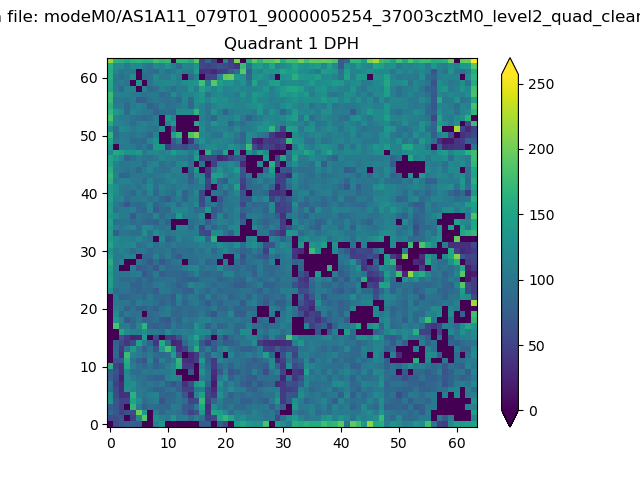 |
Quadrant B |
|---|---|---|---|
| Quadrant D | 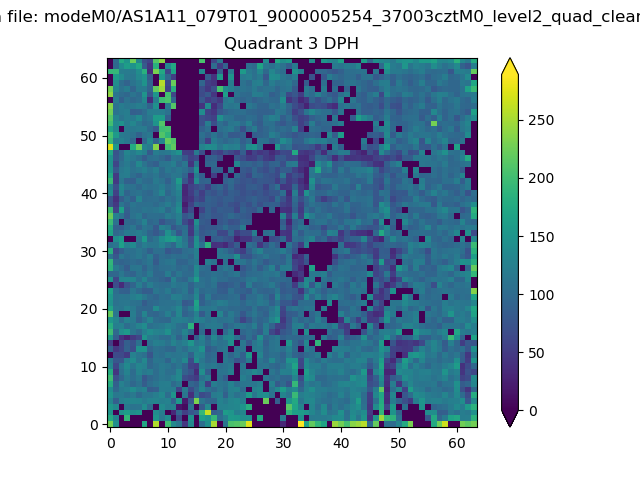 |
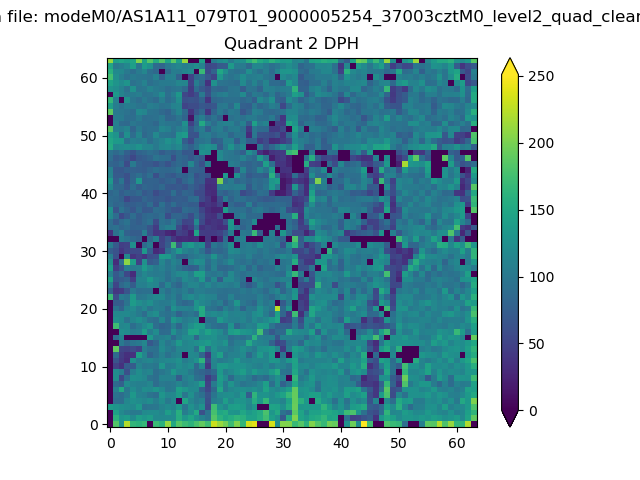 |
Quadrant C |
| Plot type | Count rate plots | Images |
|---|---|---|
| Comparison with Poisson distribution Blue bars denote a histogram of data divided into 1 sec bins. Red curve is a Poisson curve with rate = median count rate of data. |
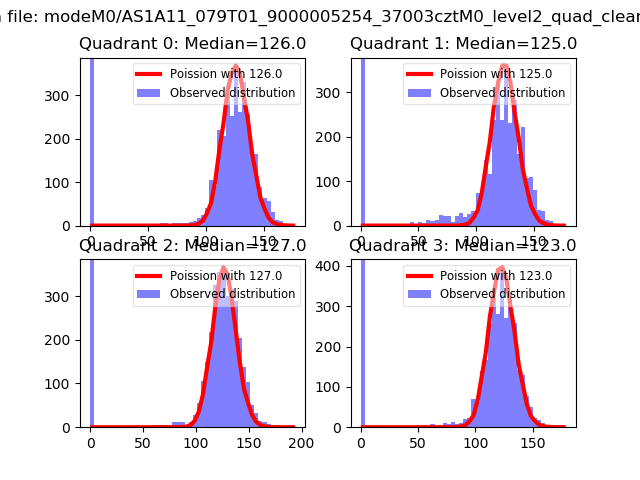 |
 |
| Quadrant-wise count rates Data is divided into 100 sec bins |
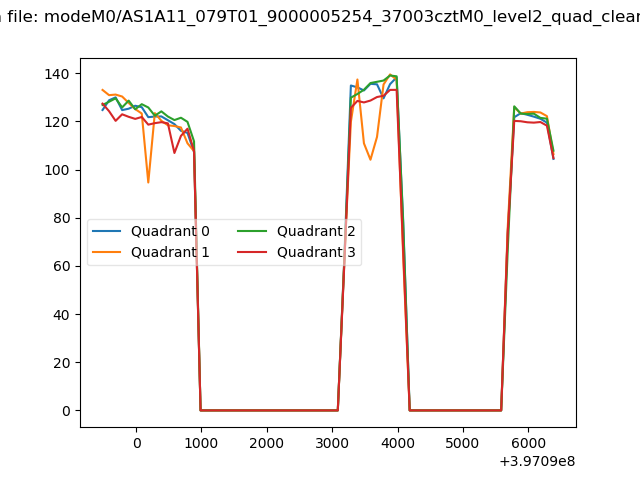 |
|
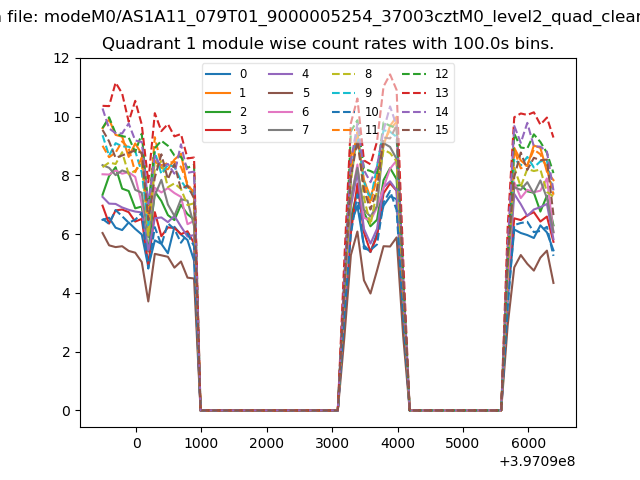
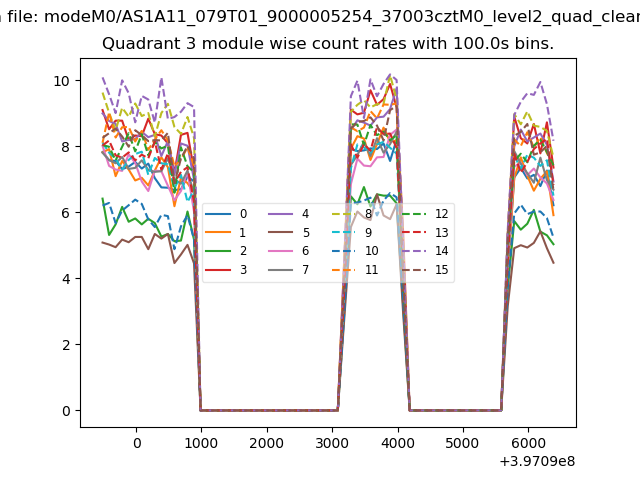
| Module-wise count rates for Quadrant A Data is divided into 100 sec bins |
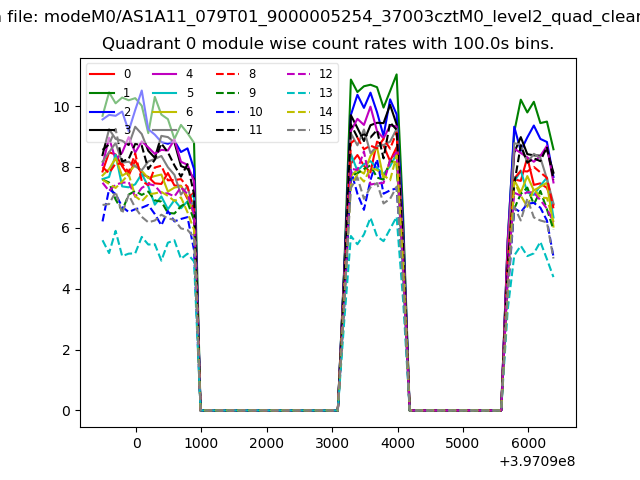 |
 |
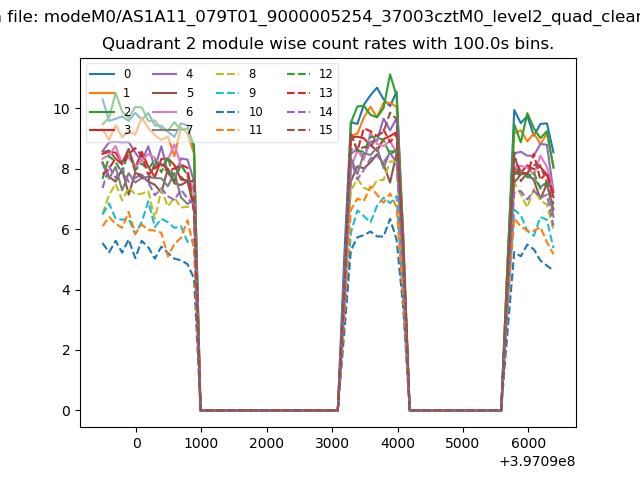
| Module-wise count rates for Quadrant B Data is divided into 100 sec bins |
 |
 |
| Module-wise count rates for Quadrant C Data is divided into 100 sec bins |
 |
 |
| Module-wise count rates for Quadrant D Data is divided into 100 sec bins |
 |
 |
| Parameter | Plot |
|---|---|
| CZT HV Monitor | 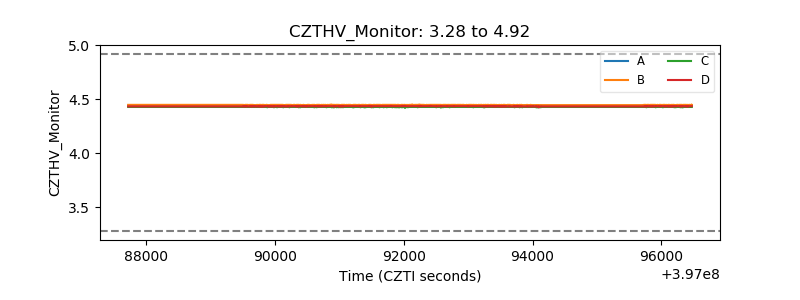 |
| D_VDD | 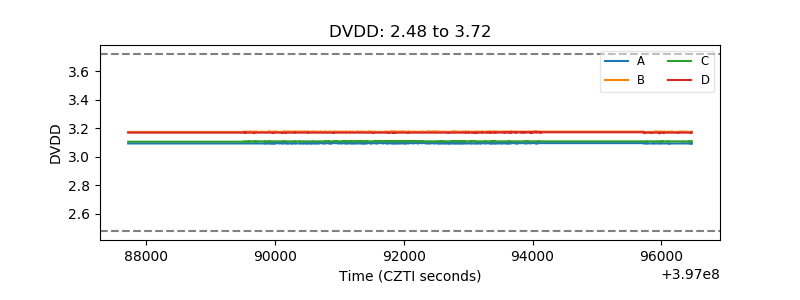 |
| Temperature 1 | 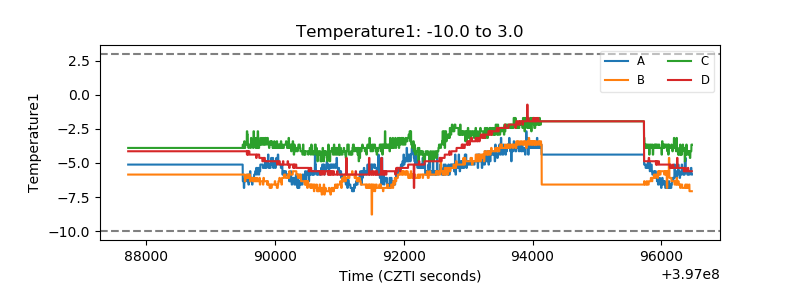 |
| Veto HV Monitor |  |
| Veto LLD | 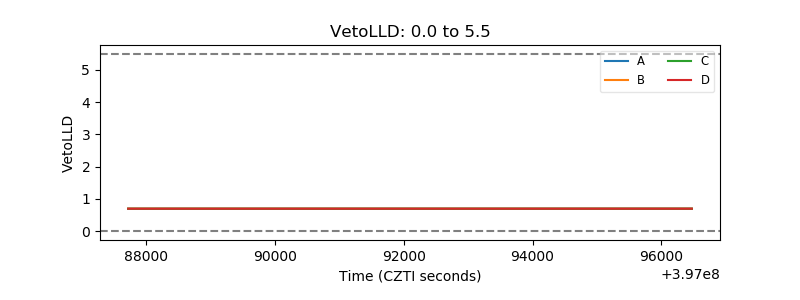 |
| Alpha Counter | 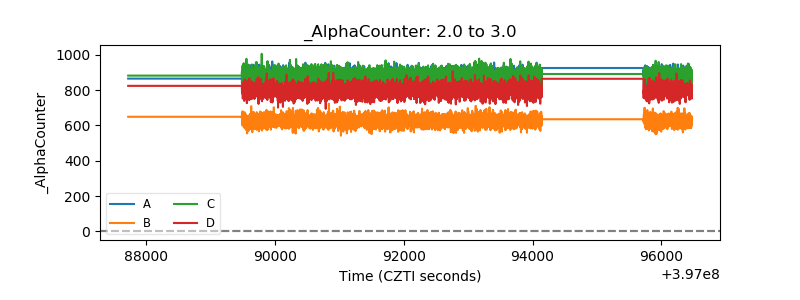 |
| _CPM_Rate | 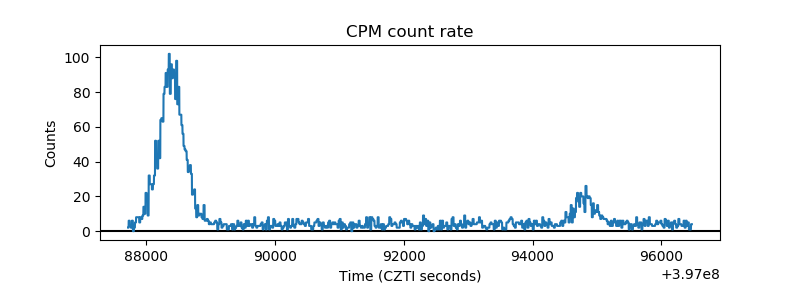 |
| CZT Counter | 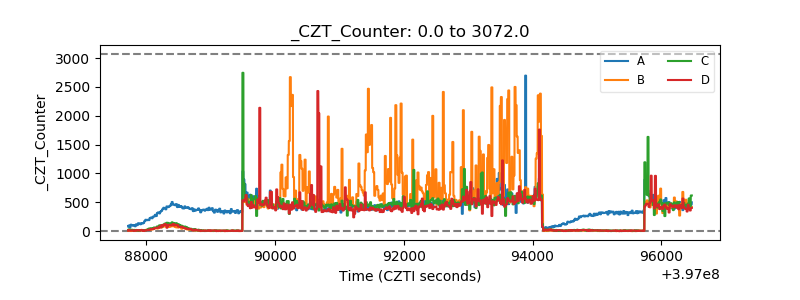 |
| +2.5 Volts monitor | 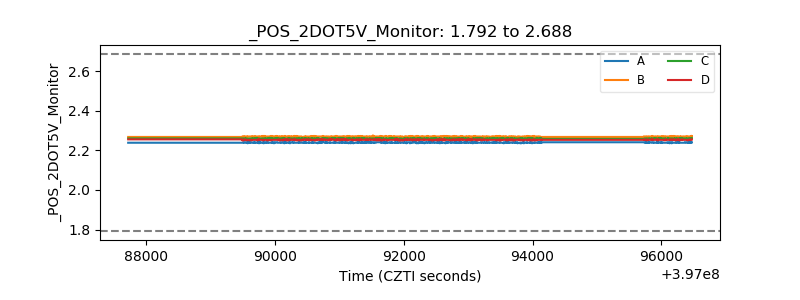 |
| +5 Volts monitor | 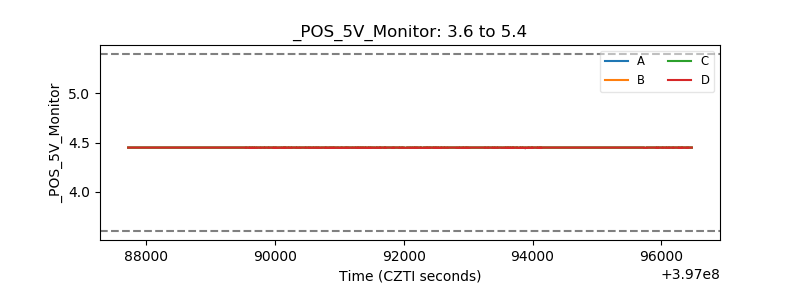 |
| _ROLL_ROT | 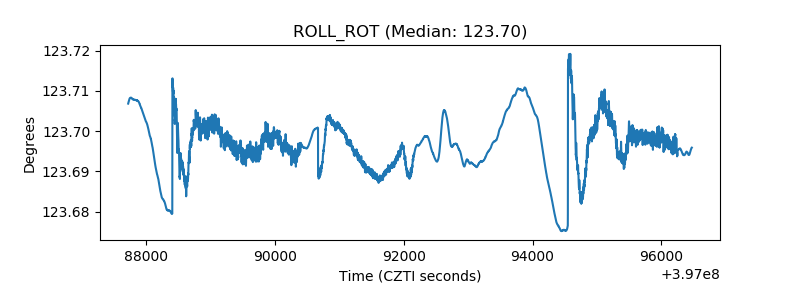 |
| _Roll_DEC | 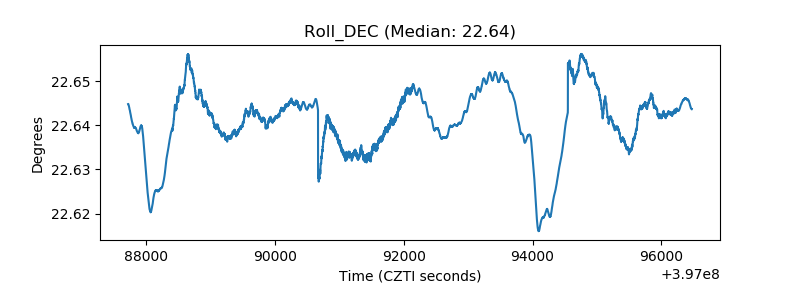 |
| _Roll_RA | 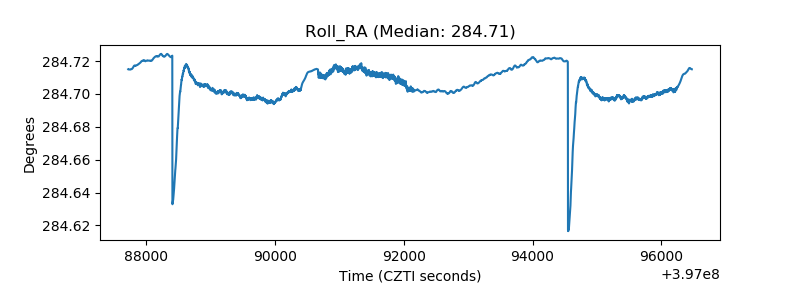 |
| Veto Counter | 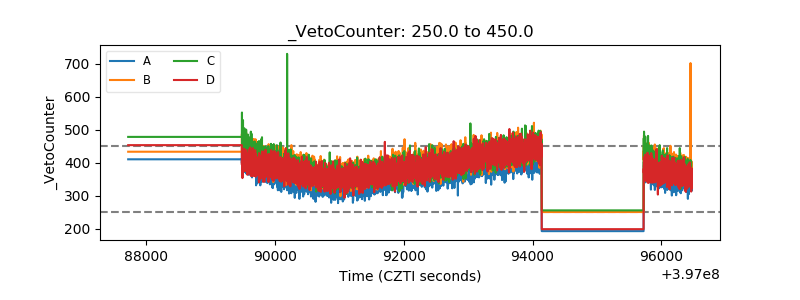 |