| Param | Original file | Final file |
|---|---|---|
| Filename | modeM0/AS1A11_079T01_9000005254_37004cztM0_level2.evt | modeM0/AS1A11_079T01_9000005254_37004cztM0_level2_quad_clean.evt |
| Size (bytes) | 307,944,000 | 40,083,840 |
| Size | 293.7 MB | 38.2 MB |
| Events in quadrant A | 2,009,555 | 231,830 |
| Events in quadrant B | 2,766,529 | 229,226 |
| Events in quadrant C | 2,314,702 | 235,229 |
| Events in quadrant D | 1,954,647 | 226,881 |
| Mode SS | |||
|---|---|---|---|
| Quadrant | BADHDUFLAG | Total packets | Discarded packets |
| A | 0 | 84 | 0 |
| B | 0 | 84 | 0 |
| C | 0 | 84 | 0 |
| D | 0 | 84 | 0 |
| Mode M9 | |||
|---|---|---|---|
| Quadrant | BADHDUFLAG | Total packets | Discarded packets |
| A | 0 | 16 | 0 |
| B | 0 | 16 | 0 |
| C | 0 | 16 | 0 |
| D | 0 | 16 | 0 |
| Mode M0 | |||
|---|---|---|---|
| Quadrant | BADHDUFLAG | Total packets | Discarded packets |
| A | 0 | 8701 | 1 |
| B | 0 | 11047 | 1 |
| C | 0 | 9465 | 1 |
| D | 0 | 8811 | 1 |
| Quadrant | Total seconds | Saturated seconds | Saturation percentage |
|---|---|---|---|
| A | 4115 | 19 | 0.461725% |
| B | 4115 | 200 | 4.860267% |
| C | 4115 | 48 | 1.166464% |
| D | 4115 | 21 | 0.510328% |
Noise dominated data is calculated using 1-second bins in cleaned event files. If a bin has >2000 counts, and if more than 50% of those come from <1% of pixels, then it is considered to be noise-dominated and hence unusable.
| Quadrant | # 1 sec bins | Bins with >0 counts | Bins with >2000 counts | High rate bins dominated by noise | Noise dominated (total time) | Noise dominated (detector-on time) | Marked lightcurve |
|---|---|---|---|---|---|---|---|
| A | 5698 | 4116 | 13 | 13 | 0.23% | 0.32% | 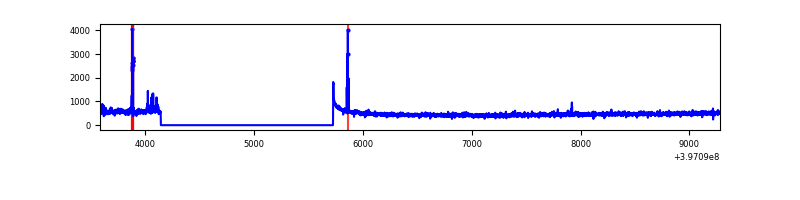 |
| B | 5698 | 4116 | 124 | 124 | 2.18% | 3.01% | 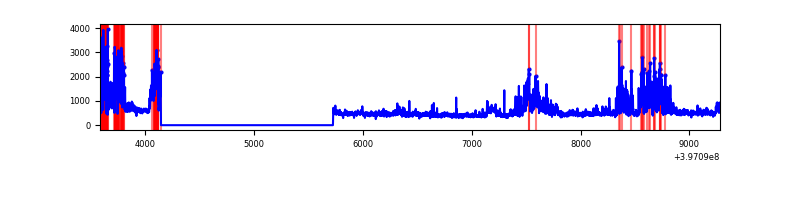 |
| C | 5698 | 4116 | 53 | 53 | 0.93% | 1.29% | 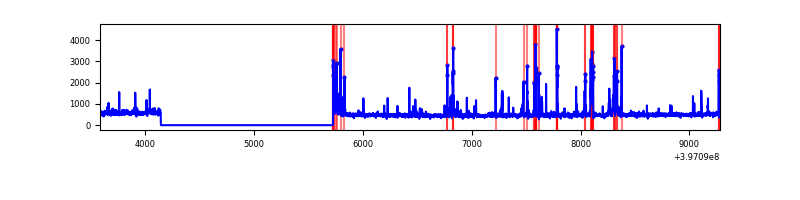 |
| D | 5698 | 4116 | 18 | 18 | 0.32% | 0.44% | 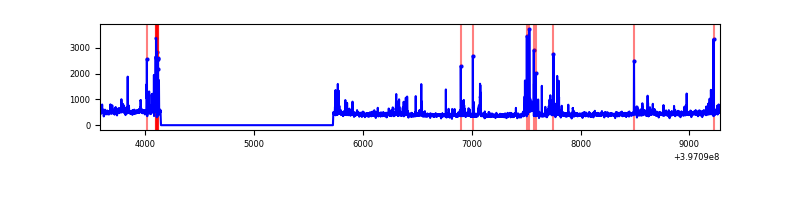 |
Top three noisy pixels from each quadrant. If the there are fewer than three noisy pixels in the level2.evt file, extra rows are filled as -1
| Pixel properties | Quadrant properties | ||||||
|---|---|---|---|---|---|---|---|
| Quadrant | DetID | PixID | Counts | Sigma | Mean | Median | Sigma |
| A | 10 | 83 | 139085 | 1477.38 | 460 | 450 | 93.8 |
| A | 7 | 16 | 45631 | 481.48 | 460 | 450 | 93.8 |
| A | 9 | 143 | 28640 | 300.41 | 460 | 450 | 93.8 |
| B | 5 | 184 | 541857 | 6163.8 | 450 | 439 | 87.8 |
| B | 14 | 252 | 304490 | 3461.48 | 450 | 439 | 87.8 |
| B | 0 | 213 | 48413 | 546.16 | 450 | 439 | 87.8 |
| C | 15 | 214 | 171691 | 1613.04 | 447 | 449 | 106.2 |
| C | 15 | 159 | 141132 | 1325.19 | 447 | 449 | 106.2 |
| C | 14 | 254 | 84690 | 793.52 | 447 | 449 | 106.2 |
| D | 1 | 52 | 92090 | 830.6 | 447 | 436 | 110.3 |
| D | 2 | 250 | 69052 | 621.82 | 447 | 436 | 110.3 |
| D | 12 | 17 | 35901 | 321.39 | 447 | 436 | 110.3 |
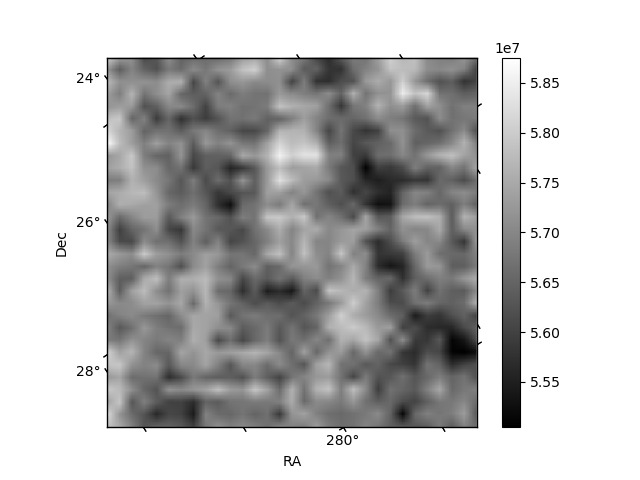
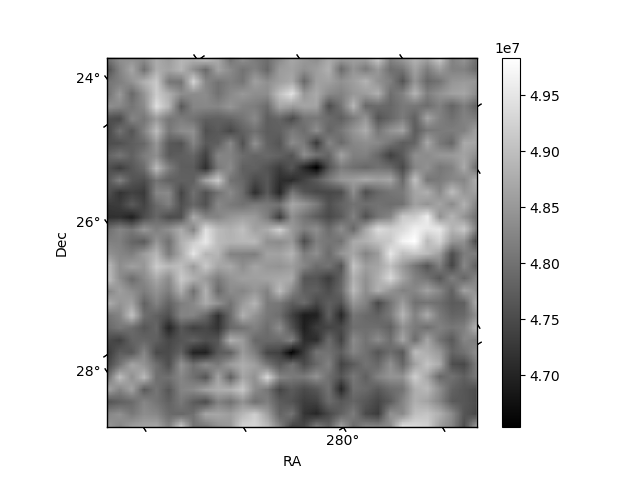
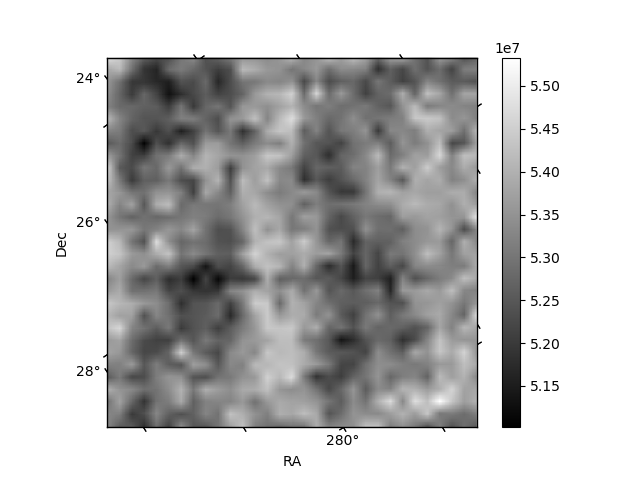
Histogram calculated using DETX and DETY for each event in the final _common_clean file
| Quadrant A | 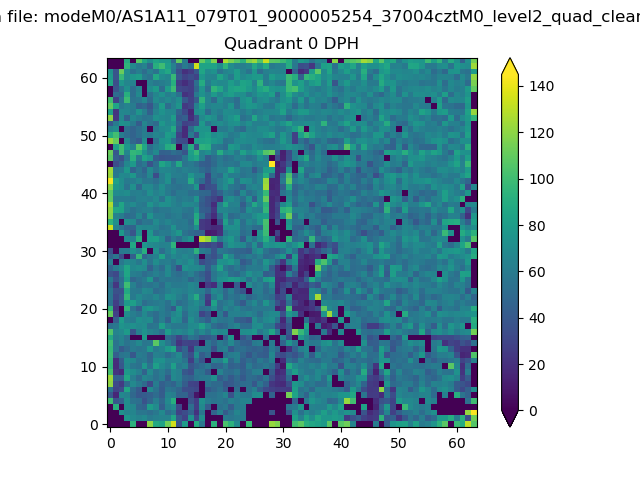 |
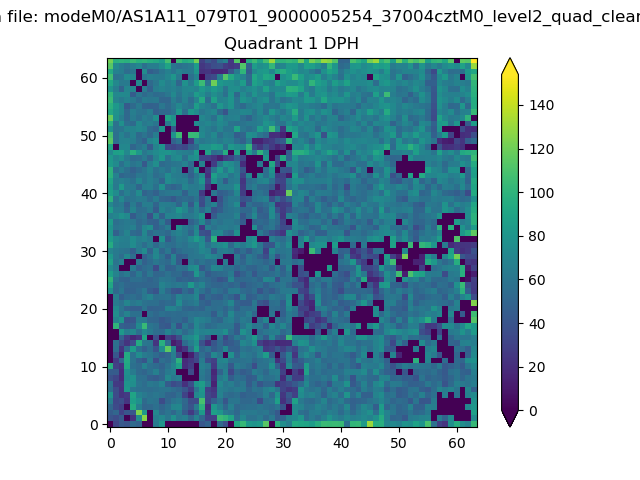 |
Quadrant B |
|---|---|---|---|
| Quadrant D | 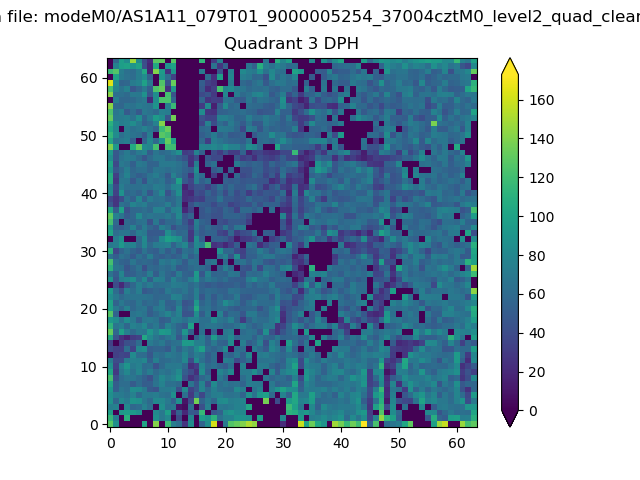 |
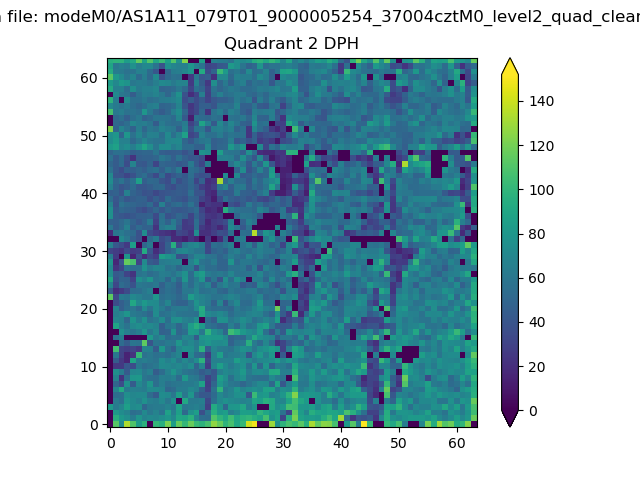 |
Quadrant C |
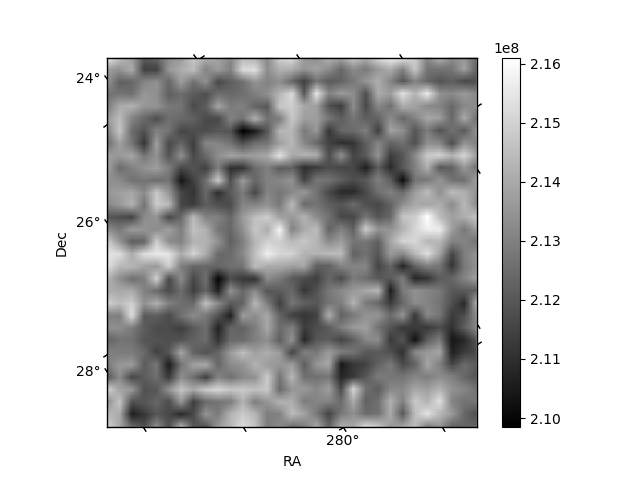
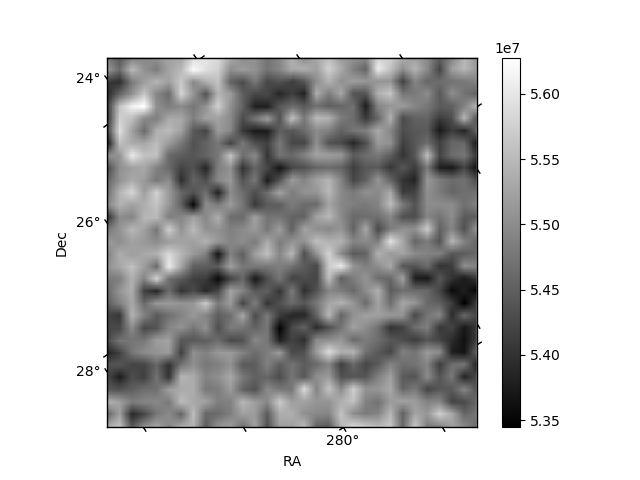
| Plot type | Count rate plots | Images |
|---|---|---|
| Comparison with Poisson distribution Blue bars denote a histogram of data divided into 1 sec bins. Red curve is a Poisson curve with rate = median count rate of data. |
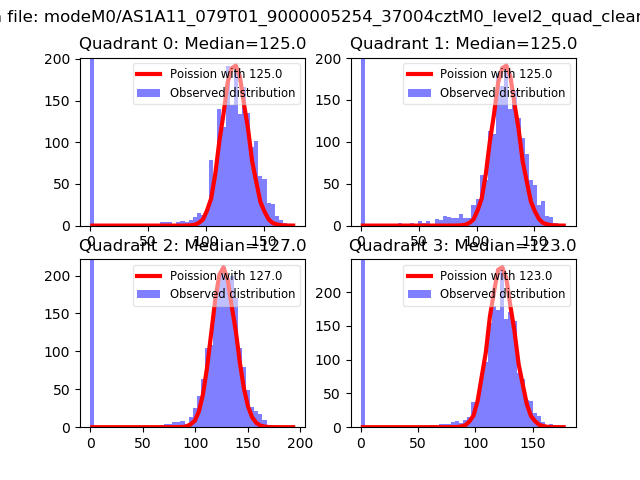 |
 |
| Quadrant-wise count rates Data is divided into 100 sec bins |
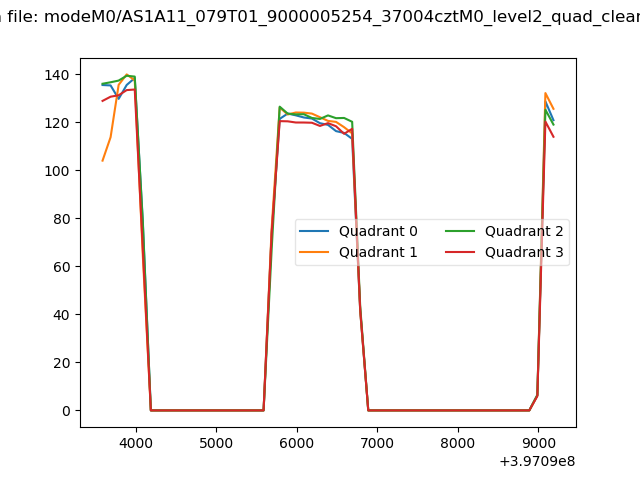 |
|
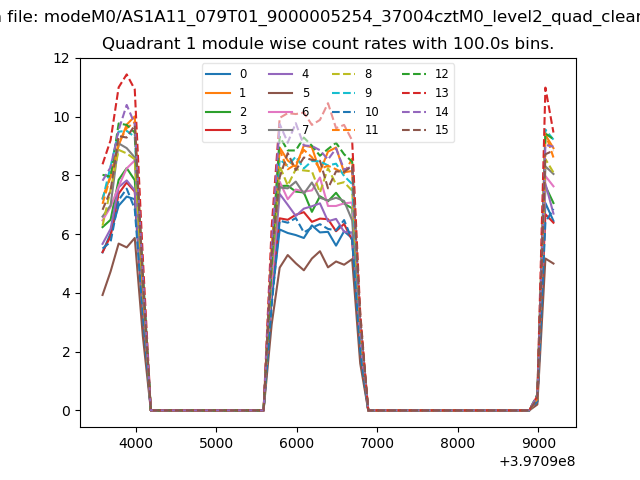
| Module-wise count rates for Quadrant A Data is divided into 100 sec bins |
 |
 |
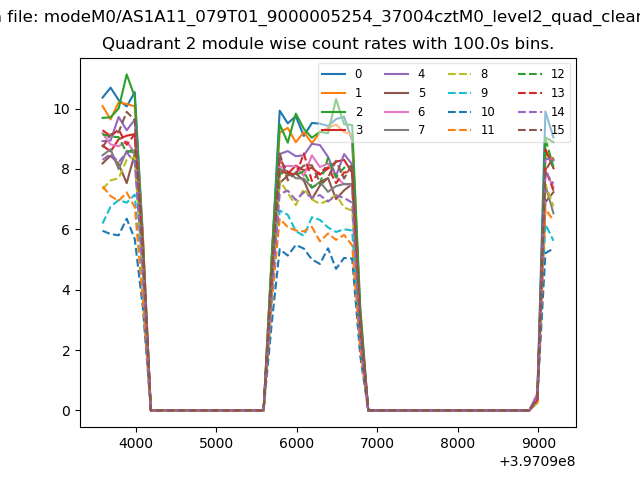
| Module-wise count rates for Quadrant B Data is divided into 100 sec bins |
 |
 |
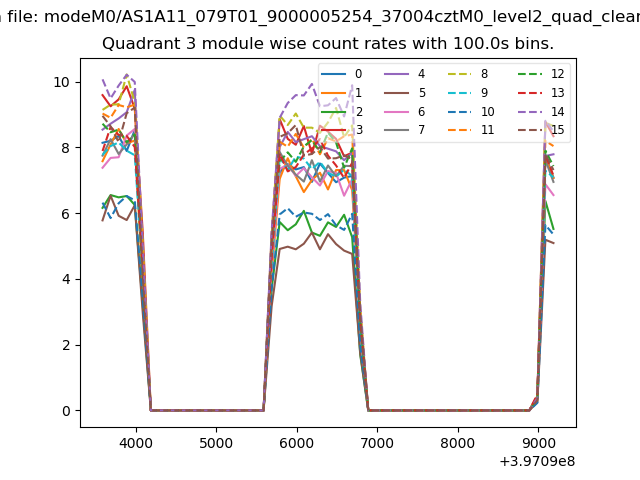
| Module-wise count rates for Quadrant C Data is divided into 100 sec bins |
 |
 |
| Module-wise count rates for Quadrant D Data is divided into 100 sec bins |
 |
 |
| Parameter | Plot |
|---|---|
| CZT HV Monitor | 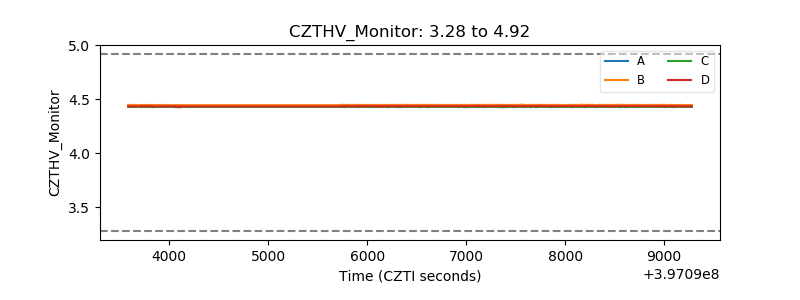 |
| D_VDD | 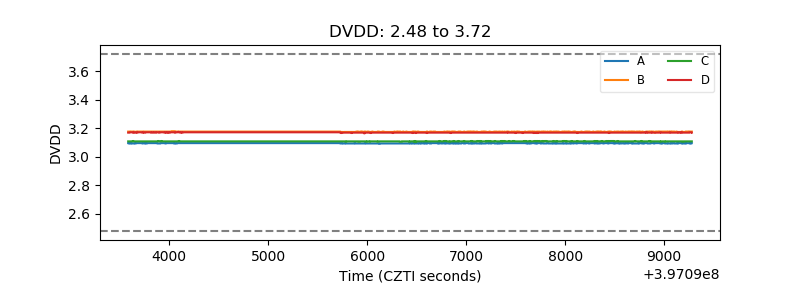 |
| Temperature 1 | 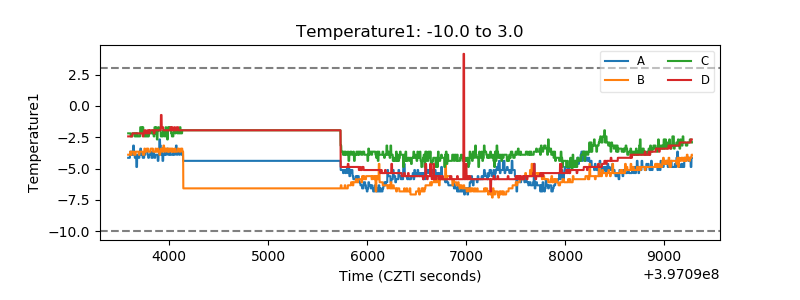 |
| Veto HV Monitor |  |
| Veto LLD | 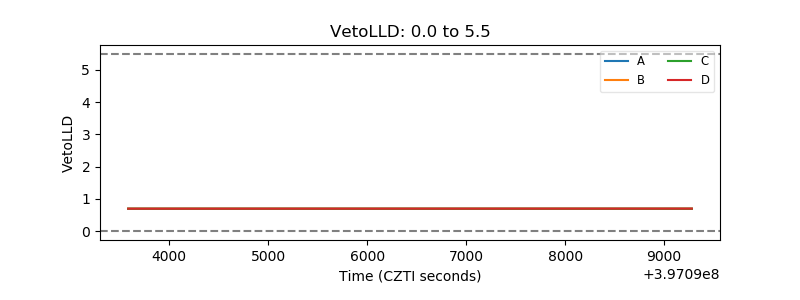 |
| Alpha Counter | 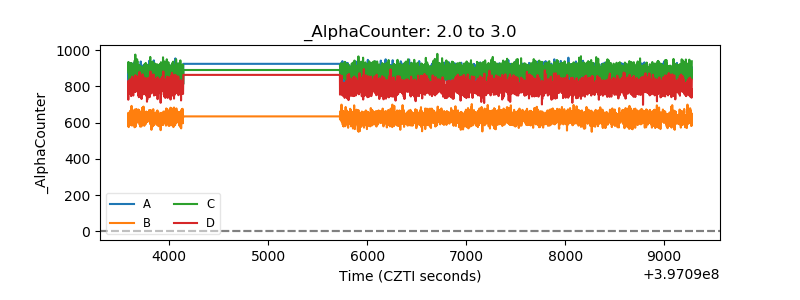 |
| _CPM_Rate | 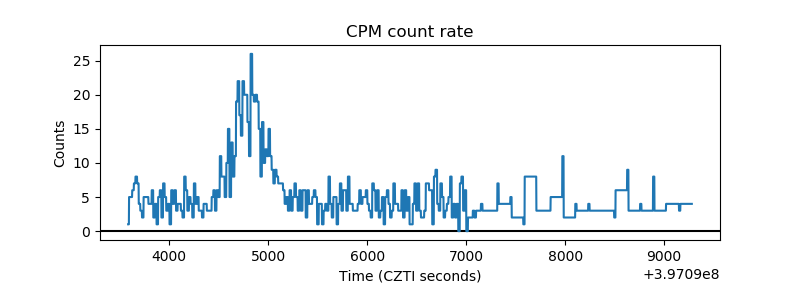 |
| CZT Counter | 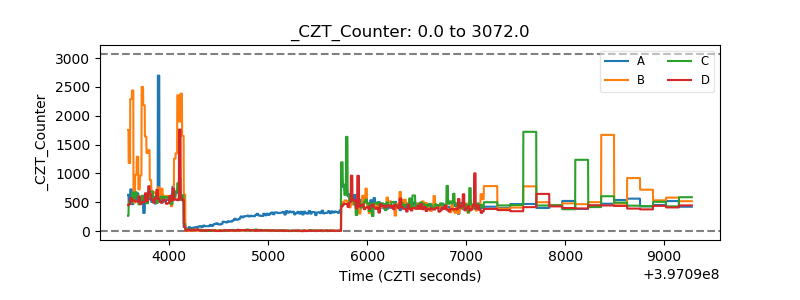 |
| +2.5 Volts monitor | 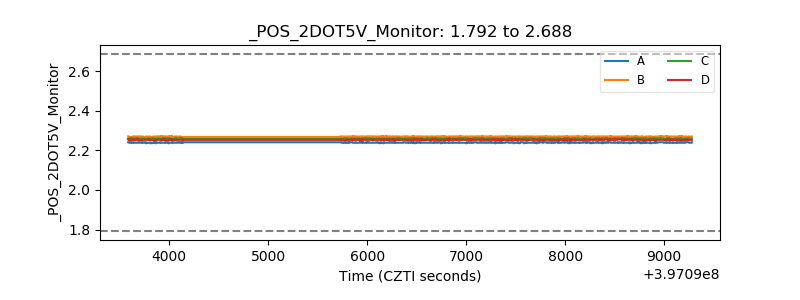 |
| +5 Volts monitor | 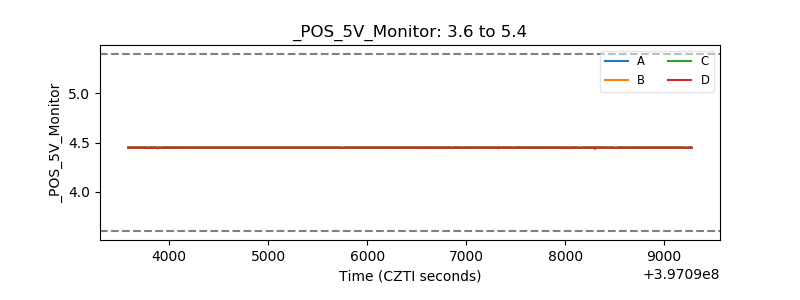 |
| _ROLL_ROT | 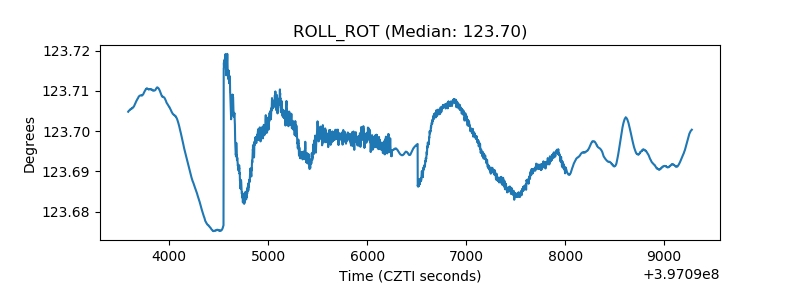 |
| _Roll_DEC | 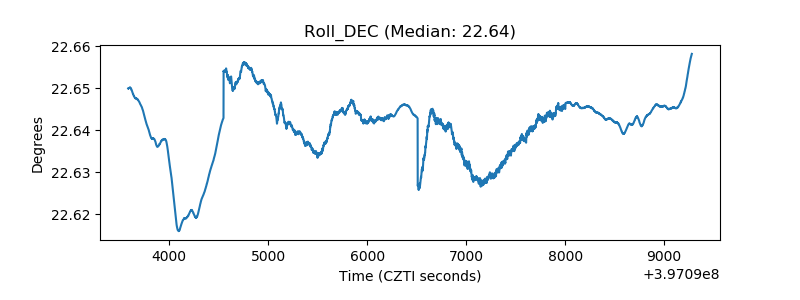 |
| _Roll_RA | 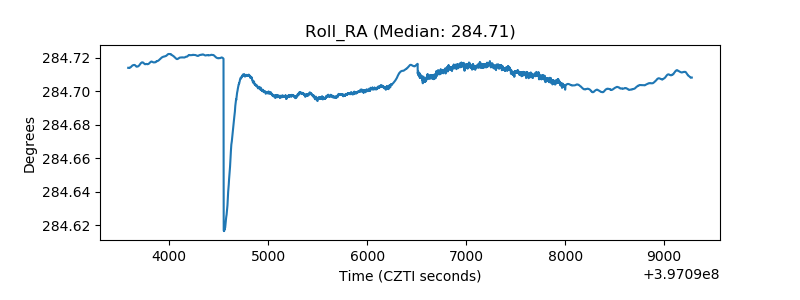 |
| Veto Counter | 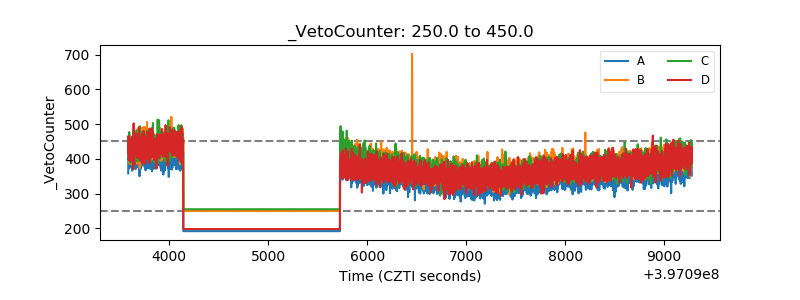 |