| Param | Original file | Final file |
|---|---|---|
| Filename | modeM0/AS1C07_015T01_9000005256cztM0_level2.fits | modeM0/AS1C07_015T01_9000005256cztM0_level2_quad_clean.evt |
| Size (bytes) | 135,757,440 | 130,976,640 |
| Size | 129.5 MB | 124.9 MB |
| Events in quadrant A | 818,618 | 804,918 |
| Events in quadrant B | 752,030 | 668,671 |
| Events in quadrant C | 800,062 | 763,173 |
| Events in quadrant D | 688,268 | 677,282 |
| Mode M9 | |||
|---|---|---|---|
| Quadrant | BADHDUFLAG | Total packets | Discarded packets |
| A | 0 | 39 | 0 |
| B | 0 | 39 | 0 |
| C | 0 | 39 | 0 |
| D | 0 | 39 | 0 |
| Mode SS | |||
|---|---|---|---|
| Quadrant | BADHDUFLAG | Total packets | Discarded packets |
| A | 0 | 312 | 0 |
| B | 0 | 312 | 0 |
| C | 0 | 312 | 0 |
| D | 0 | 312 | 0 |
| Mode M0 | |||
|---|---|---|---|
| Quadrant | BADHDUFLAG | Total packets | Discarded packets |
| A | 0 | 31422 | 0 |
| B | 0 | 42241 | 0 |
| C | 0 | 31923 | 0 |
| D | 0 | 43731 | 0 |
| Quadrant | Total seconds | Saturated seconds | Saturation percentage |
|---|---|---|---|
| A | 15236 | 19 | 0.124705% |
| B | 15236 | 1522 | 9.989499% |
| C | 15236 | 28 | 0.183775% |
| D | 15236 | 746 | 4.896298% |
Noise dominated data is calculated using 1-second bins in cleaned event files. If a bin has >2000 counts, and if more than 50% of those come from <1% of pixels, then it is considered to be noise-dominated and hence unusable.
| Quadrant | # 1 sec bins | Bins with >0 counts | Bins with >2000 counts | High rate bins dominated by noise | Noise dominated (total time) | Noise dominated (detector-on time) | Marked lightcurve |
|---|---|---|---|---|---|---|---|
| A | 19174 | 15236 | 0 | 0 | 0.00% | 0.00% |  |
| B | 19174 | 15235 | 0 | 0 | 0.00% | 0.00% |  |
| C | 19174 | 15235 | 0 | 0 | 0.00% | 0.00% |  |
| D | 19174 | 15231 | 0 | 0 | 0.00% | 0.00% |  |
Top three noisy pixels from each quadrant. If the there are fewer than three noisy pixels in the level2.evt file, extra rows are filled as -1
| Pixel properties | Quadrant properties | ||||||
|---|---|---|---|---|---|---|---|
| Quadrant | DetID | PixID | Counts | Sigma | Mean | Median | Sigma |
| A | 9 | 19 | 694 | 9.01 | 213 | 201 | 54.7 |
| A | 7 | 110 | 662 | 8.43 | 213 | 201 | 54.7 |
| A | 0 | 29 | 630 | 7.84 | 213 | 201 | 54.7 |
| B | 2 | 9 | 615 | 10.27 | 199 | 190 | 41.4 |
| B | 3 | 80 | 529 | 8.19 | 199 | 190 | 41.4 |
| B | 5 | 128 | 527 | 8.14 | 199 | 190 | 41.4 |
| C | 3 | 234 | 600 | 7.15 | 212 | 199 | 56.1 |
| C | 1 | 65 | 551 | 6.28 | 212 | 199 | 56.1 |
| C | 3 | 187 | 534 | 5.98 | 212 | 199 | 56.1 |
| D | 6 | 67 | 505 | 5.99 | 197 | 180 | 54.2 |
| D | 10 | 113 | 501 | 5.92 | 197 | 180 | 54.2 |
| D | 7 | 3 | 490 | 5.72 | 197 | 180 | 54.2 |
Histogram calculated using DETX and DETY for each event in the final _common_clean file
| Quadrant A | 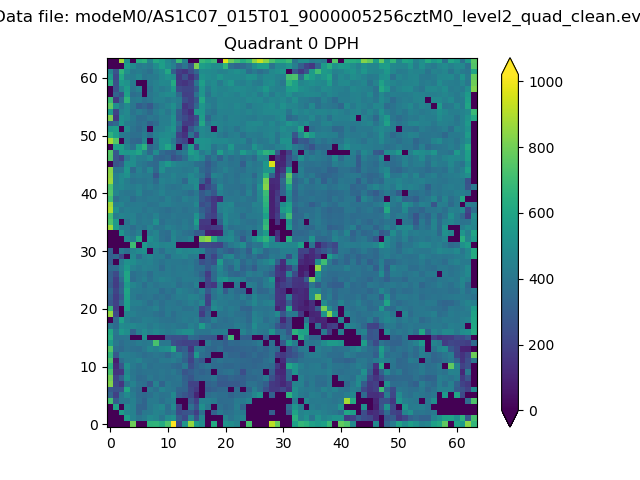 |
 |
Quadrant B |
|---|---|---|---|
| Quadrant D |  |
 |
Quadrant C |
| Plot type | Count rate plots | Images |
|---|---|---|
| Comparison with Poisson distribution Blue bars denote a histogram of data divided into 1 sec bins. Red curve is a Poisson curve with rate = median count rate of data. |
 |
 |
| Quadrant-wise count rates Data is divided into 100 sec bins |
 |
|
| Module-wise count rates for Quadrant A Data is divided into 100 sec bins |
 |
 |
| Module-wise count rates for Quadrant B Data is divided into 100 sec bins |
 |
 |
| Module-wise count rates for Quadrant C Data is divided into 100 sec bins |
 |
 |
| Module-wise count rates for Quadrant D Data is divided into 100 sec bins |
 |
 |
| Parameter | Plot |
|---|---|
| CZT HV Monitor |  |
| D_VDD |  |
| Temperature 1 |  |
| Veto HV Monitor |  |
| Veto LLD |  |
| Alpha Counter |  |
| _CPM_Rate |  |
| CZT Counter |  |
| +2.5 Volts monitor |  |
| +5 Volts monitor |  |
| _ROLL_ROT |  |
| _Roll_DEC |  |
| _Roll_RA |  |
| Veto Counter |  |