| Param | Original file | Final file |
|---|---|---|
| Filename | modeM0/AS1C07_015T01_9000005256_37004cztM0_level2.evt | modeM0/AS1C07_015T01_9000005256_37004cztM0_level2_quad_clean.evt |
| Size (bytes) | 100,074,240 | 25,272,000 |
| Size | 95.4 MB | 24.1 MB |
| Events in quadrant A | 741,315 | 165,219 |
| Events in quadrant B | 692,351 | 166,380 |
| Events in quadrant C | 758,384 | 163,834 |
| Events in quadrant D | 735,247 | 159,686 |
| Mode M9 | |||
|---|---|---|---|
| Quadrant | BADHDUFLAG | Total packets | Discarded packets |
| A | 0 | 13 | 0 |
| B | 0 | 13 | 0 |
| C | 0 | 13 | 0 |
| D | 0 | 13 | 0 |
| Mode SS | |||
|---|---|---|---|
| Quadrant | BADHDUFLAG | Total packets | Discarded packets |
| A | 0 | 32 | 0 |
| B | 0 | 32 | 0 |
| C | 0 | 32 | 0 |
| D | 0 | 32 | 0 |
| Mode M0 | |||
|---|---|---|---|
| Quadrant | BADHDUFLAG | Total packets | Discarded packets |
| A | 0 | 3106 | 2 |
| B | 0 | 3007 | 1 |
| C | 0 | 3161 | 1 |
| D | 0 | 3234 | 1 |
| Quadrant | Total seconds | Saturated seconds | Saturation percentage |
|---|---|---|---|
| A | 1476 | 2 | 0.135501% |
| B | 1476 | 2 | 0.135501% |
| C | 1476 | 9 | 0.609756% |
| D | 1476 | 12 | 0.813008% |
Noise dominated data is calculated using 1-second bins in cleaned event files. If a bin has >2000 counts, and if more than 50% of those come from <1% of pixels, then it is considered to be noise-dominated and hence unusable.
| Quadrant | # 1 sec bins | Bins with >0 counts | Bins with >2000 counts | High rate bins dominated by noise | Noise dominated (total time) | Noise dominated (detector-on time) | Marked lightcurve |
|---|---|---|---|---|---|---|---|
| A | 2818 | 1477 | 0 | 0 | 0.00% | 0.00% | 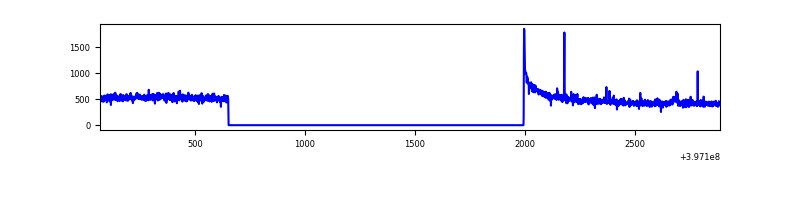 |
| B | 2818 | 1477 | 0 | 0 | 0.00% | 0.00% | 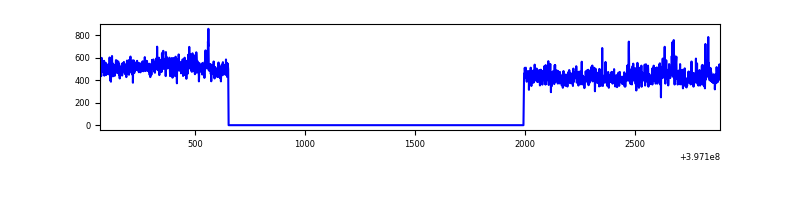 |
| C | 2818 | 1477 | 7 | 7 | 0.25% | 0.47% | 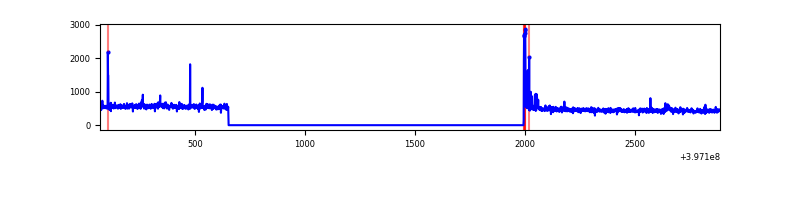 |
| D | 2818 | 1477 | 8 | 8 | 0.28% | 0.54% | 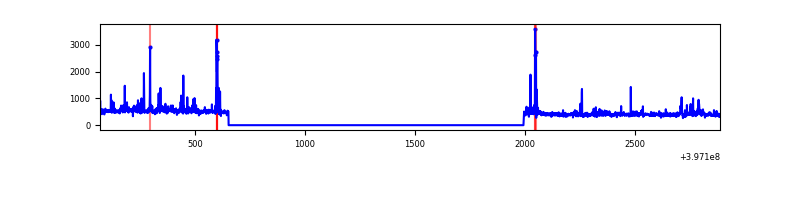 |
Top three noisy pixels from each quadrant. If the there are fewer than three noisy pixels in the level2.evt file, extra rows are filled as -1
| Pixel properties | Quadrant properties | ||||||
|---|---|---|---|---|---|---|---|
| Quadrant | DetID | PixID | Counts | Sigma | Mean | Median | Sigma |
| A | 10 | 83 | 88019 | 2462.94 | 166 | 163 | 35.7 |
| A | 13 | 6 | 2901 | 76.76 | 166 | 163 | 35.7 |
| A | 7 | 3 | 2817 | 74.4 | 166 | 163 | 35.7 |
| B | 0 | 221 | 15811 | 456.18 | 166 | 162 | 34.3 |
| B | 0 | 213 | 11039 | 317.07 | 166 | 162 | 34.3 |
| B | 0 | 190 | 4190 | 117.42 | 166 | 162 | 34.3 |
| C | 15 | 214 | 66413 | 1660.01 | 165 | 165 | 39.9 |
| C | 0 | 10 | 39869 | 994.88 | 165 | 165 | 39.9 |
| C | 14 | 254 | 4299 | 103.59 | 165 | 165 | 39.9 |
| D | 1 | 52 | 61462 | 1496.11 | 164 | 159 | 41.0 |
| D | 2 | 153 | 23635 | 572.94 | 164 | 159 | 41.0 |
| D | 2 | 250 | 15266 | 368.69 | 164 | 159 | 41.0 |
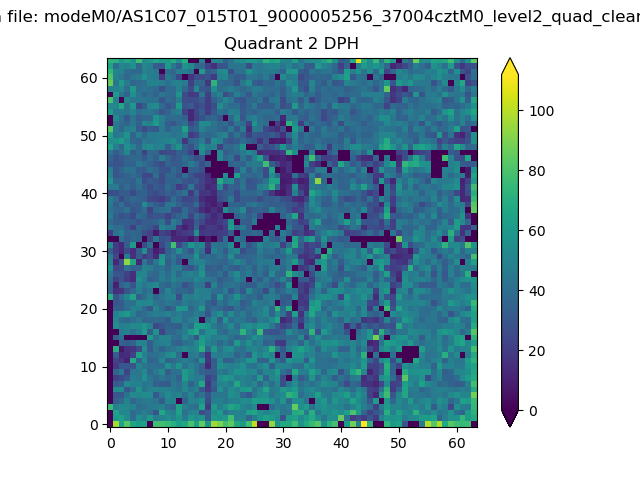
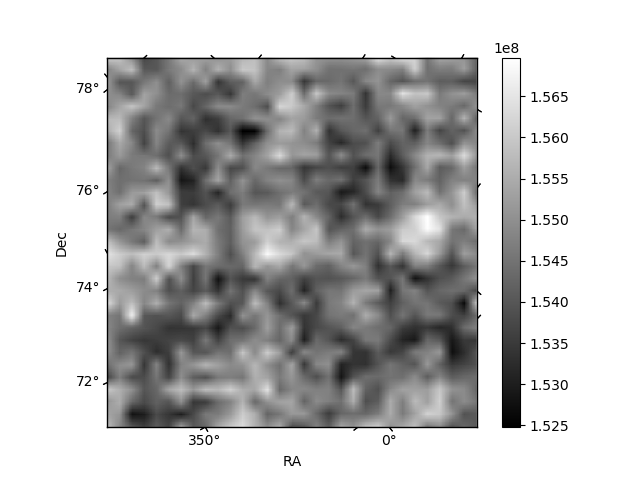
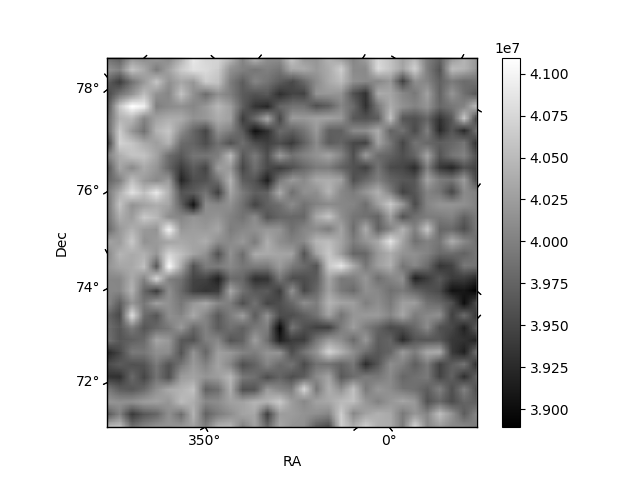
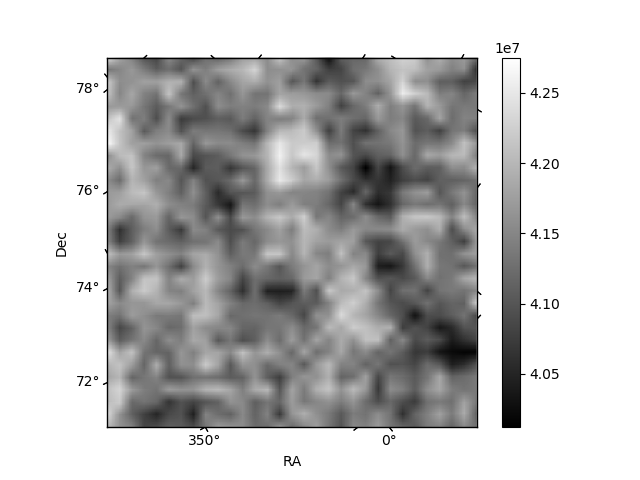
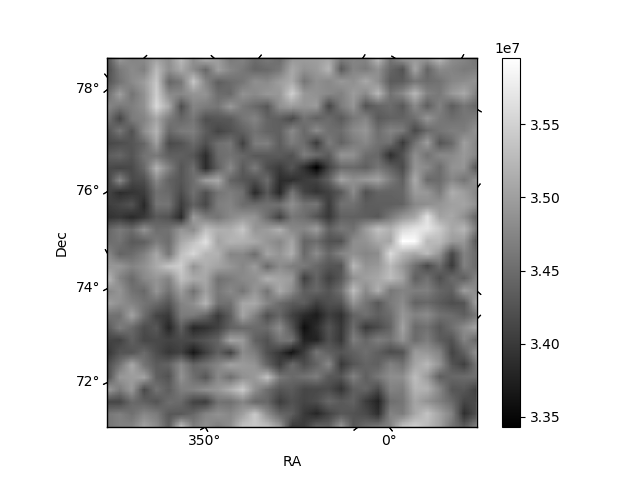
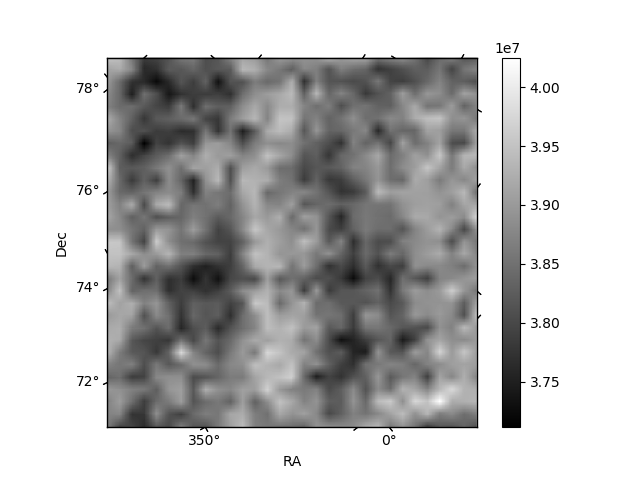
Histogram calculated using DETX and DETY for each event in the final _common_clean file
| Quadrant A | 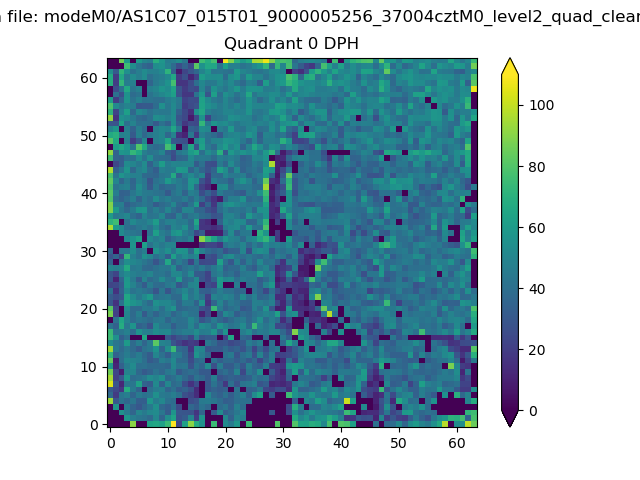 |
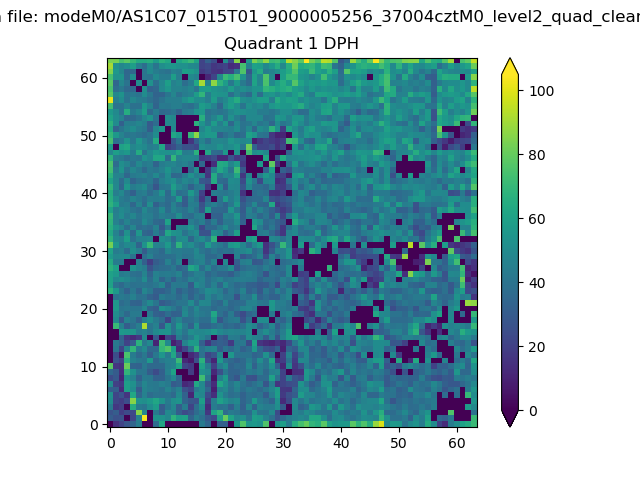 |
Quadrant B |
|---|---|---|---|
| Quadrant D | 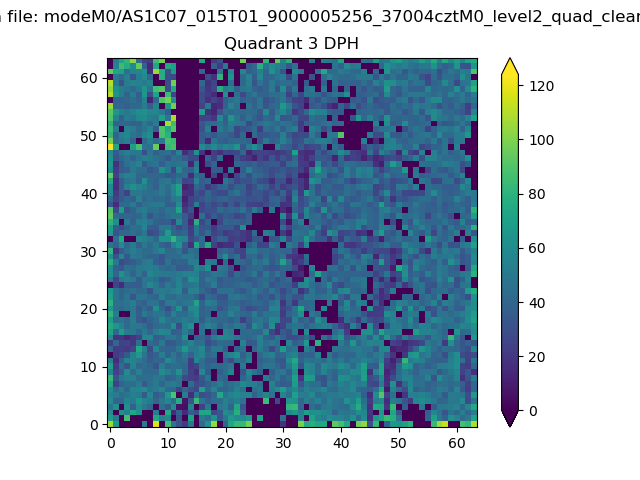 |
 |
Quadrant C |
| Plot type | Count rate plots | Images |
|---|---|---|
| Comparison with Poisson distribution Blue bars denote a histogram of data divided into 1 sec bins. Red curve is a Poisson curve with rate = median count rate of data. |
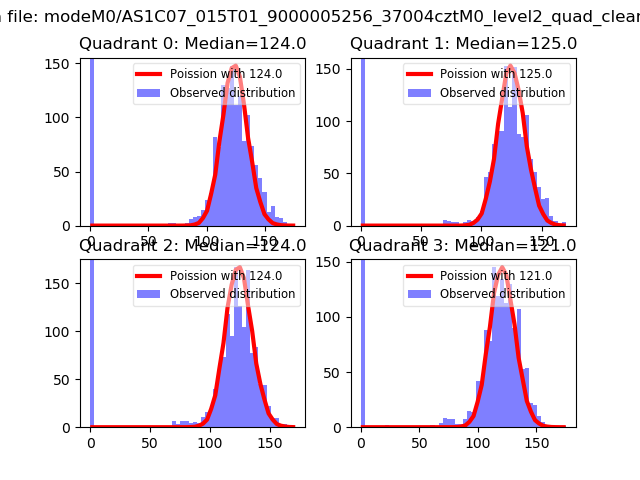 |
 |
| Quadrant-wise count rates Data is divided into 100 sec bins |
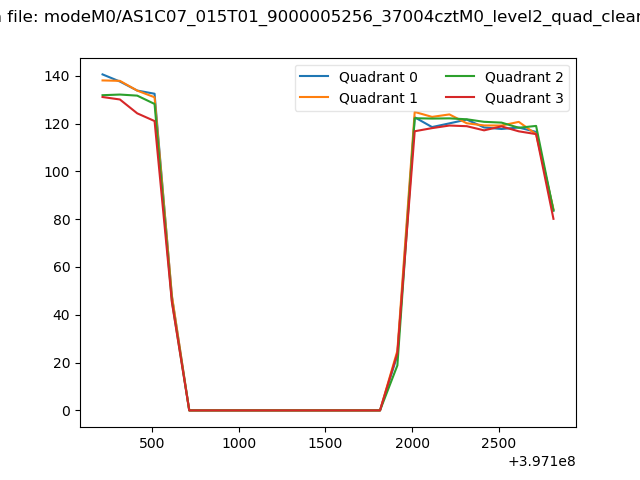 |
|
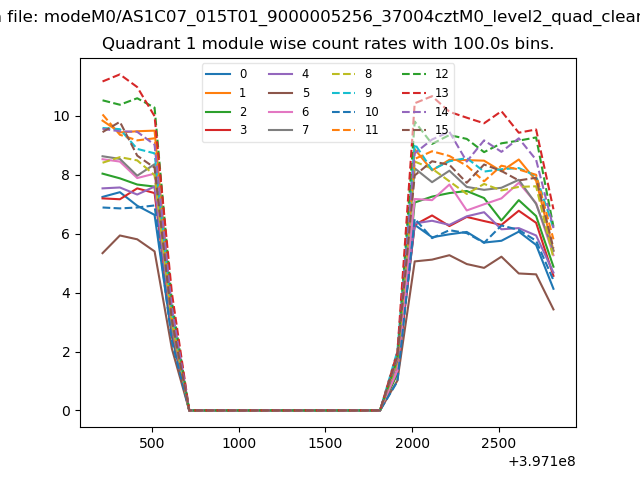
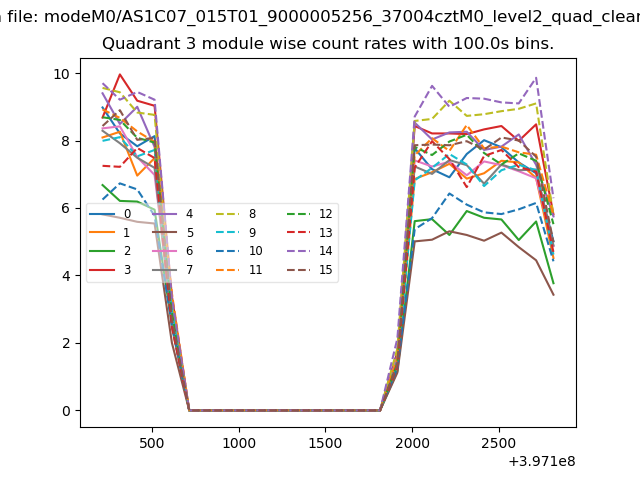
| Module-wise count rates for Quadrant A Data is divided into 100 sec bins |
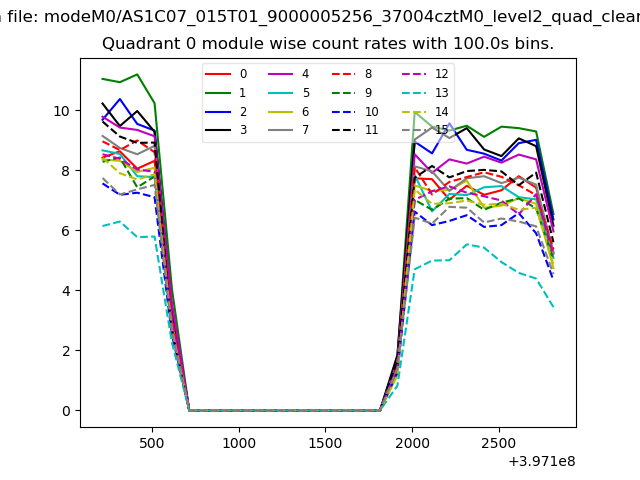 |
 |
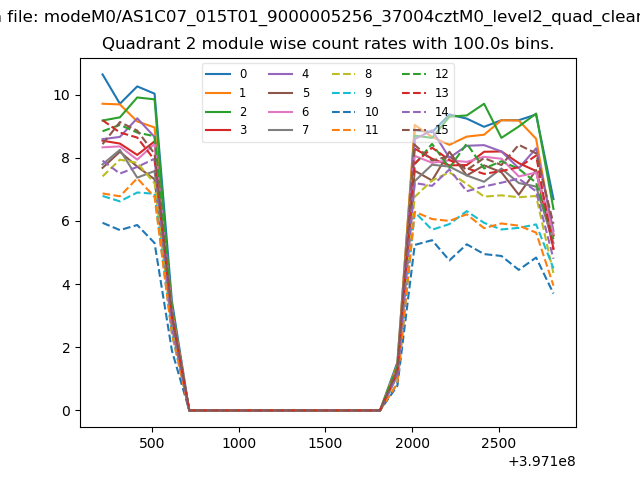
| Module-wise count rates for Quadrant B Data is divided into 100 sec bins |
 |
 |
| Module-wise count rates for Quadrant C Data is divided into 100 sec bins |
 |
 |
| Module-wise count rates for Quadrant D Data is divided into 100 sec bins |
 |
 |
| Parameter | Plot |
|---|---|
| CZT HV Monitor | 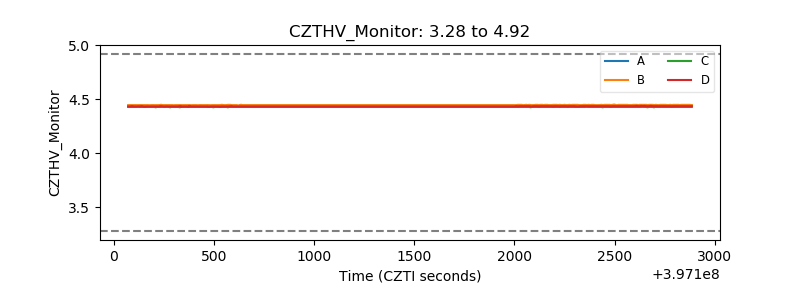 |
| D_VDD | 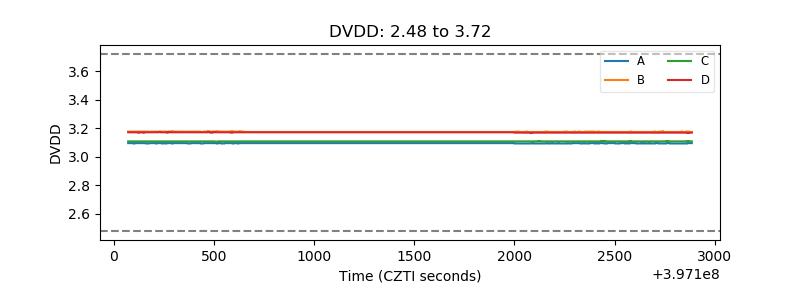 |
| Temperature 1 | 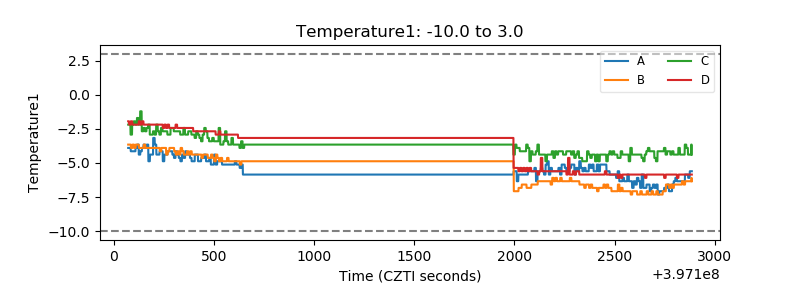 |
| Veto HV Monitor | 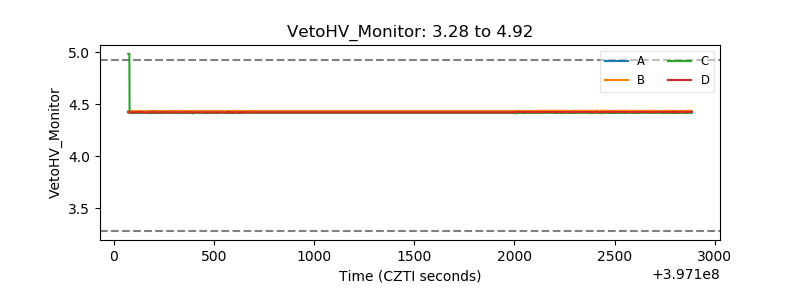 |
| Veto LLD | 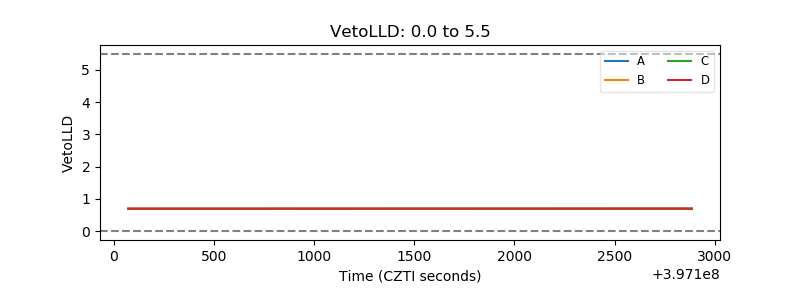 |
| Alpha Counter | 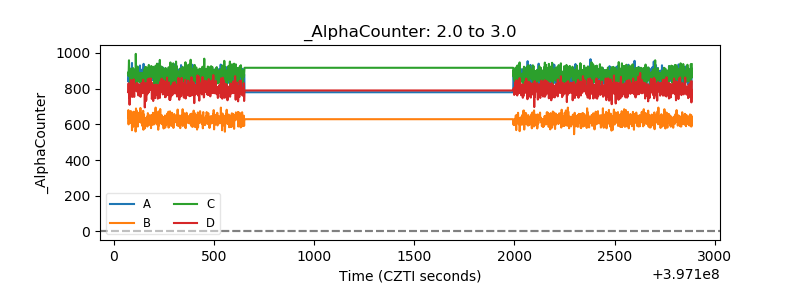 |
| _CPM_Rate | 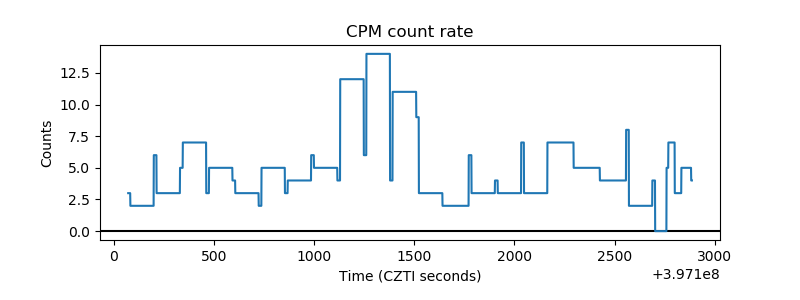 |
| CZT Counter | 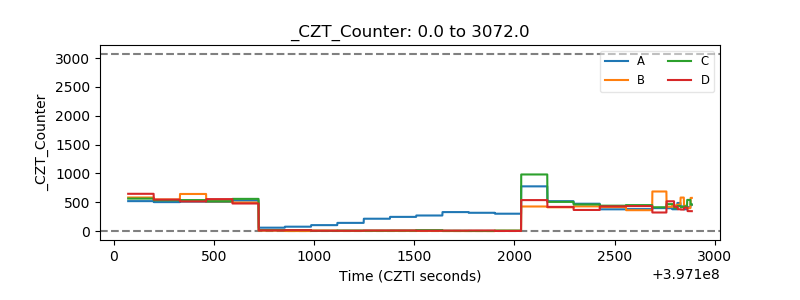 |
| +2.5 Volts monitor | 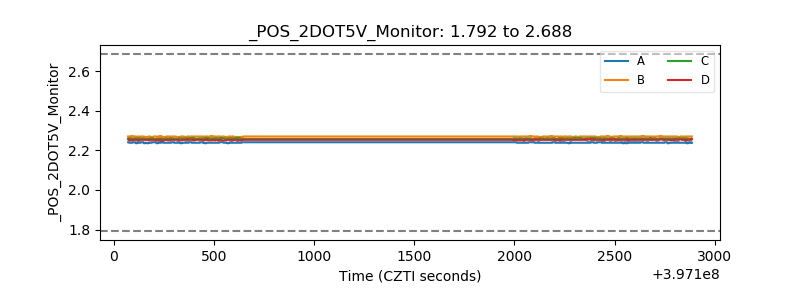 |
| +5 Volts monitor | 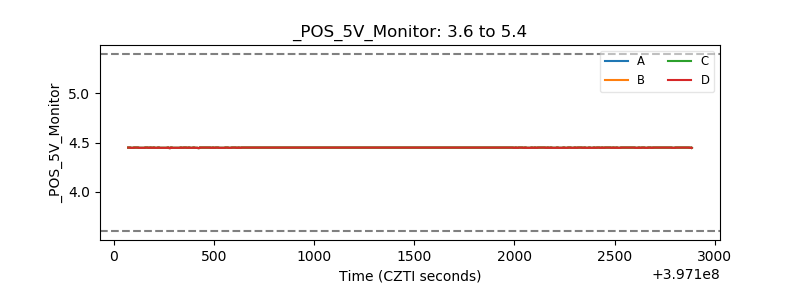 |
| _ROLL_ROT | 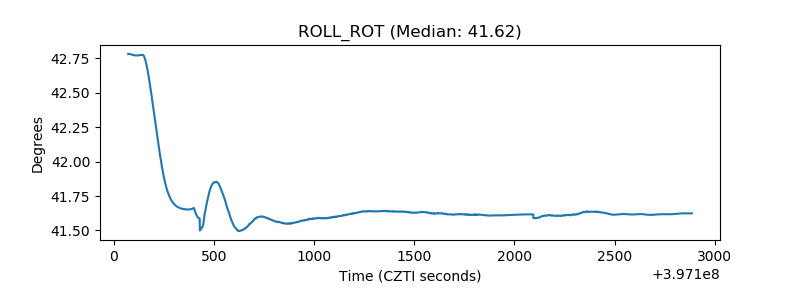 |
| _Roll_DEC | 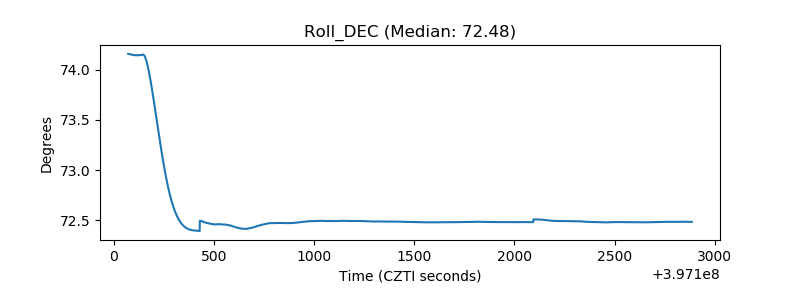 |
| _Roll_RA | 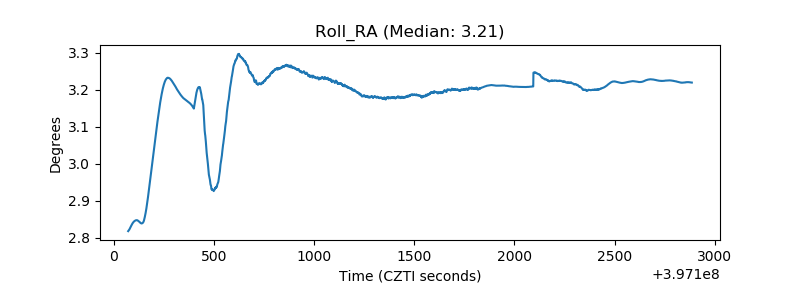 |
| Veto Counter | 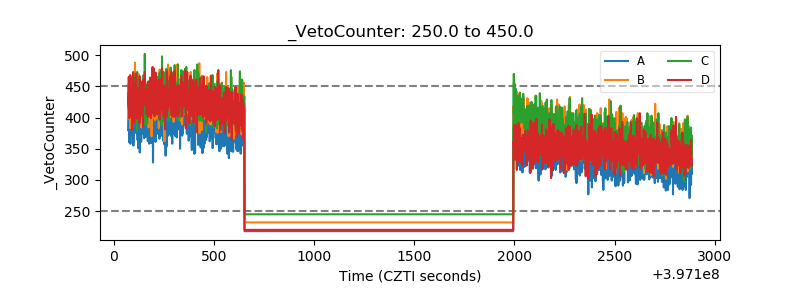 |